.... Small-cap ETF Closes above Chandelier Exit
.... New Highs Expand within Tech and Industrials
.... Tech Stocks and ETFs Dominate New High List
.... Agribusiness ETF Gets a Wedge Breakout
.... Chinese Stocks Remain Subdued
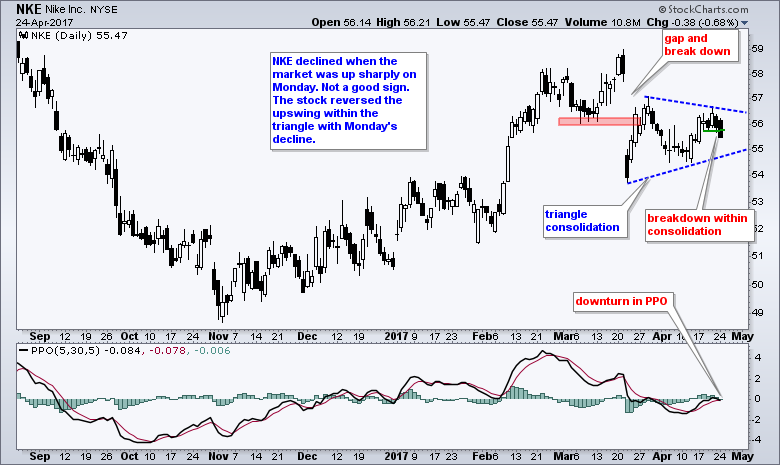
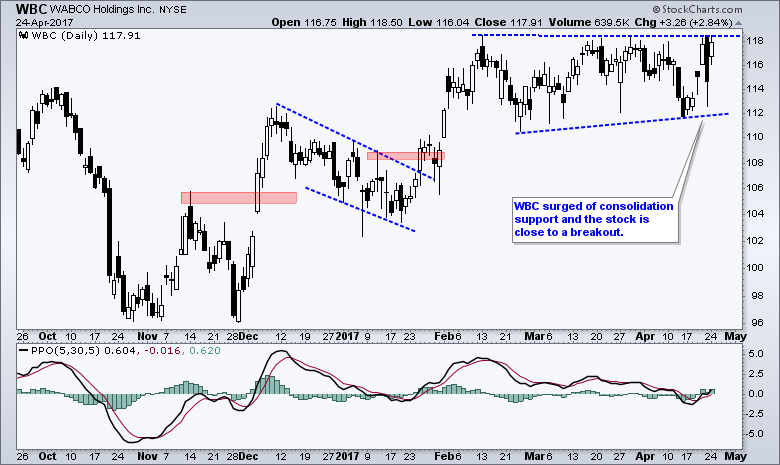
.... Stocks to Watch: HBAN, JBHT, CA, PFPT, NKE, WBC ....
IJR Closes above Chandelier Exit
With a big surge in the major index ETFs, it is time to re-visit the mean-reversion strategy using 5-day RSI and the Chandelier Exit. The system buys when RSI(5) moves above 30, which means it was below 30 and short-term oversold before the signal. The system then sets a trailing stop based on the Chandelier Exit. Some entry signals trigger when the ETF is still below the Chandelier Exit and this means traders must simply wait until price moves above the Chandelier Exit before setting the trailing stop. The Chandelier Exit (22,1) seemed to work better for IJR, while and Chandelier (22,2) worked slightly better for QQQ and SPY. The choice of settings is entirely yours. Please read the System Trader article and review the ChartSchool article on the Chandelier Exit if you have any questions.
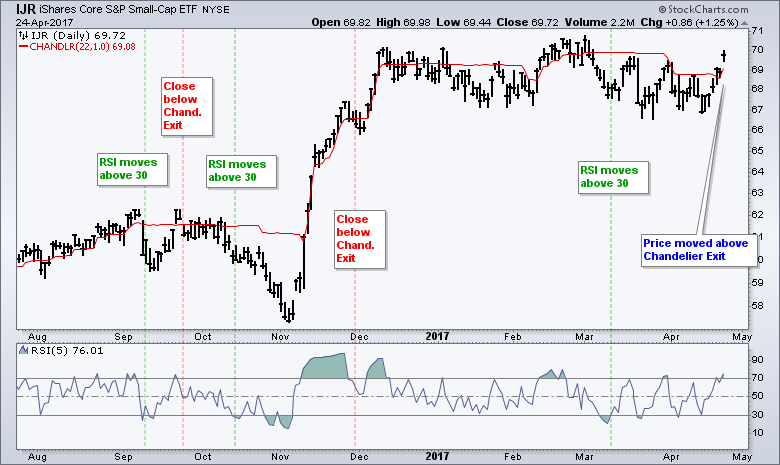
The chart above shows IJR triggering a bullish signal on March 10th and moving above the Chandelier Exit on April 20th, some five week's later. A stop-loss can now be set using the Chandelier Exit (22,1), which finished at 69.08 on Monday. Note that this system does not use any other stop-loss. IJR fell sharply after the bullish signal in mid October, but surged in November and the trade finished a winner, even though it would have been tough to hold.
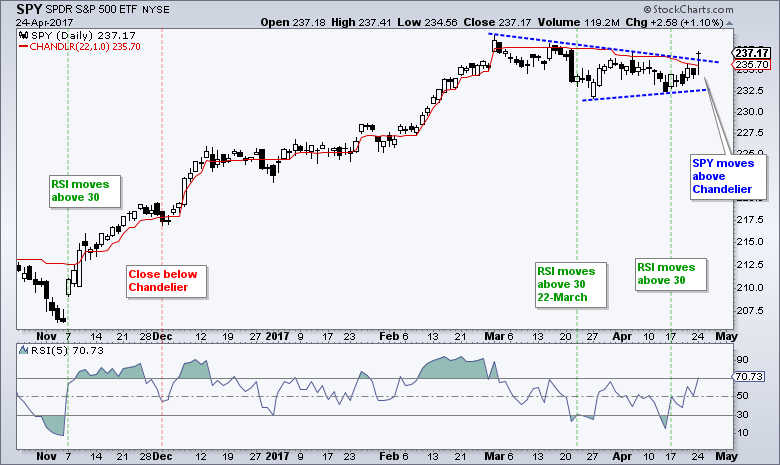
I updated this mean-reversion system by testing a strategy that traded SPY, MDY, IJR, QQQ and DIA (buy on RSI cross above 30 and sell on cross below Chandelier Exit (22,1)). The chart below shows two bullish signals for SPY (March 22nd and April 17th). The ETF just moved above the Chandelier Exit on Monday and this is the first chance to set a stop. MDY and DIA also moved above their Chandelier Exits on Monday.
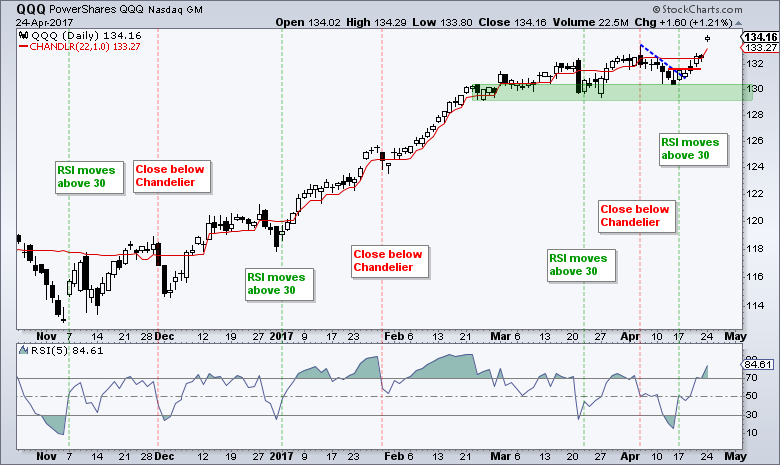
QQQ continues to lead the market with a mini breakout four days ago and a surge to new highs on Monday. RSI triggered bullish on April 17th and QQQ moved above the Chandelier Exit last Thursday.
New Highs Expand within Tech and Industrials
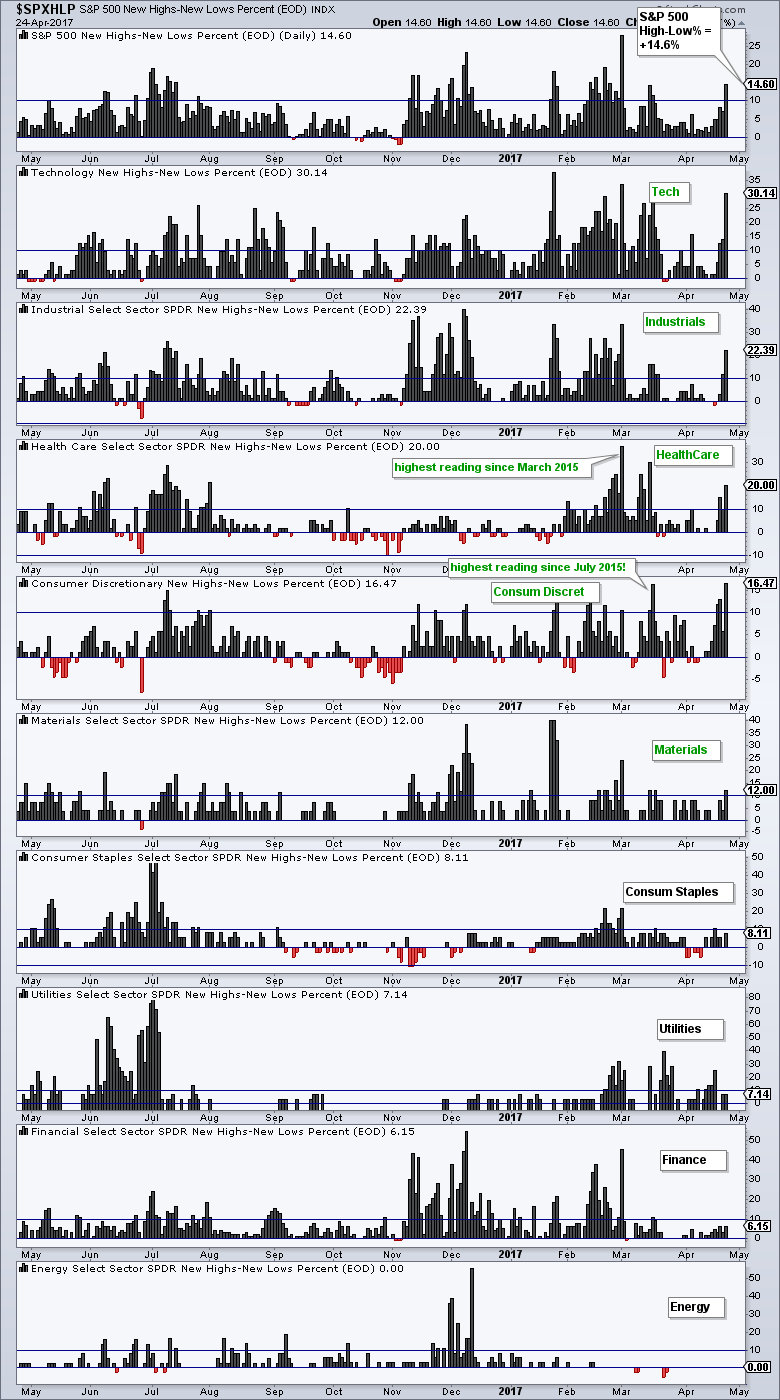
Chartists looking for strong sectors can keep an eye on the High-Low Percent indicators. The table below shows High-Low Percent for the nine S&P 500 sectors and the S&P 500. S&P 500 High-Low% ($SPXHLP) edged above 14% on Monday and hit its highest level since March 1st. The sectors are sorted by High-Low Percent with the highest values at the top. Some 30% of stocks in the technology sector hit new highs, over 20% of stocks in the industrials sector hit new highs and healthcare came in third with around 20%. Notice that the consumer discretionary sector also shows internal strength because High-Low Percent finished at 16.5%. Together, these four sectors account for around 58% of the S&P 500 and this is more than enough to tilt the balance to the bulls.
Tech Stocks and ETFs Dominate New High List
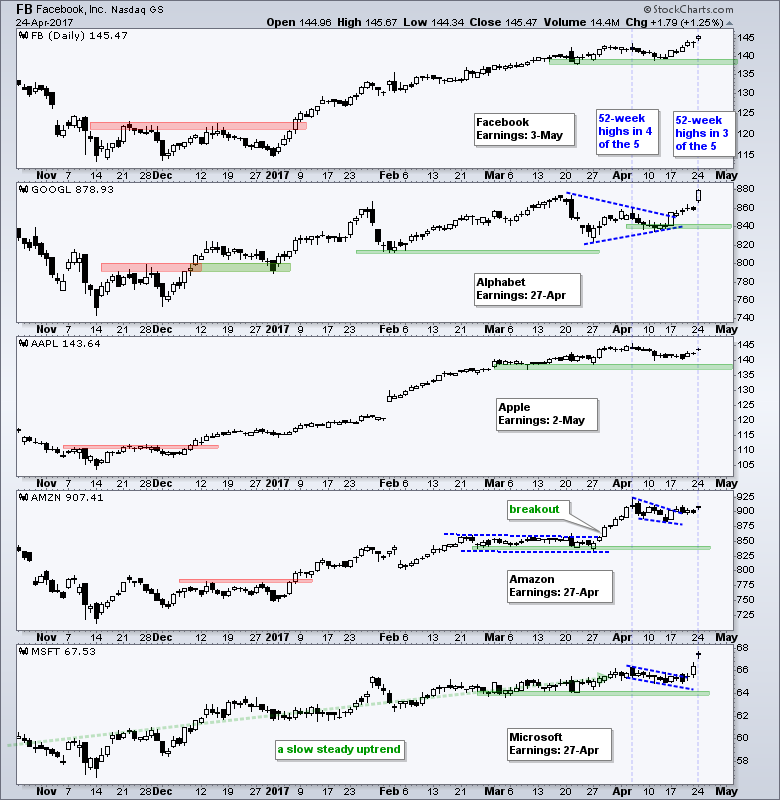
Elsewhere in tech-land, there were new highs in the Internet ETF (FDN), Cloud Computing ETF (SKYY) and Software iShares (IGV). Among the Fab Five, note that Alphabet (GOOGL), Microsoft (MSFT) and Facebook (FB) recorded new highs. Amazon (AMZN) and Apple (AAPL) hit new highs in early April and remain close to these highs. Even though the Semiconductor SPDR (XSD) did not hit a new high, there were new highs in three big semi-conductor equipment stocks: Applied Materials (AMAT), KLA Tencor (KLAC) and Lam Research (LRCX). I would also go as far as to argue that strength in these stocks has little to do with President Trump, Congress, North Korea or the French elections. Forget the narratives and watch the charts!
MOO Gets a Wedge Breakout
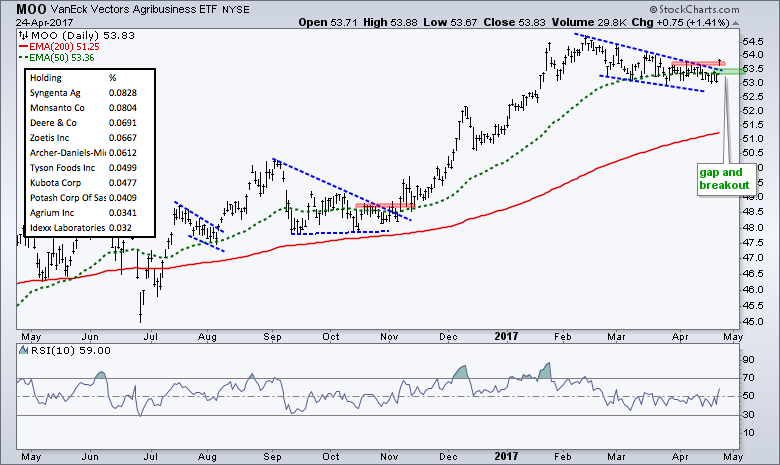
The Agribusiness ETF (MOO) turned bullish again as the ETF ended its wedge correction. First and foremost, the big trend is up as the ETF hit a new high in February and the 50-day EMA is above the 200-day EMA. This means the decline from mid February to mid April was a correction within the uptrend. Monday's gap and breakout signal an end to this correction and a resumption of the uptrend. A strong breakout should hold so I would re-evaluate if the gap is filled (close below 53).
Chinese Stocks Remain Subdued
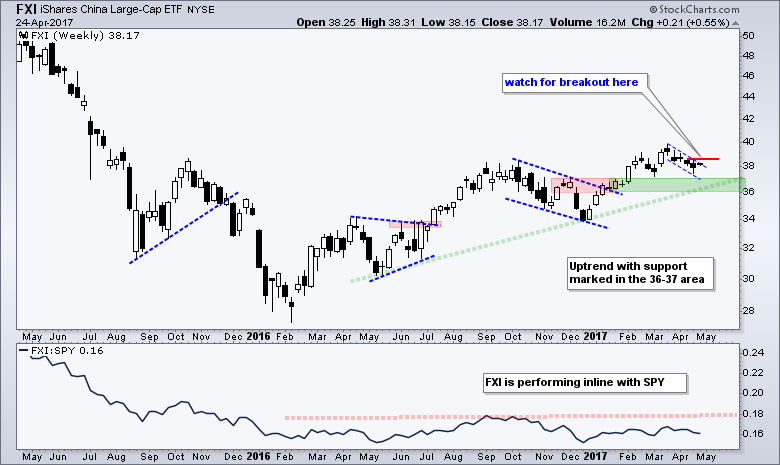
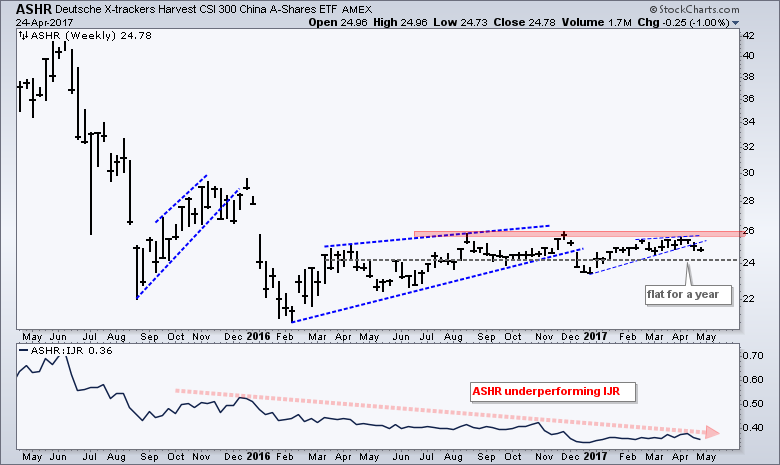
Most of the major equity markets in the world moved higher on Monday, but Chinese stocks did not participate and remained subdued. The charts below show the China iShares ETF (FXI) and the China 300 A-Share ETF (ASHR). Before getting into the analysis, allow me to explain the differences. FXI consists of large-cap stocks with the top ten stocks account for over 50% of the ETF and the financials sector accounting for over 50%. ASHR consists of small and mid cap Chinese shares that trade on the A-shares markets in Shanghai and Shenzen. This is a more domestically oriented ETF and financials account for around 35%.
The chart below shows the China iShares (FXI) in an uptrend overall and performing in-line with the S&P 500 SPDR (SPY). The last signal was the breakout in the 36-37 area and I am marking support here. FXI fell back over the last five weeks with a falling flag of sorts and I am watching for a breakout here. Such a move would be bullish and argue for a continuation of the bigger uptrend.
In contrast to FXI and US stocks, the China 300 A-Share ETF (ASHR) has struggled over the past 12-14 months. The chart shows ASHR bouncing in February-March 2016 and then trading flat for over a year. Most recently, the ETF formed a rising wedge the first three months of the year and broke the wedge trend line over the last two weeks. I am not sure how bearish this is because the ETF is still within a big trading range. There is a clear resistance zone at 26 to watch. A breakout here would be bullish and suggest that the slump is ending.
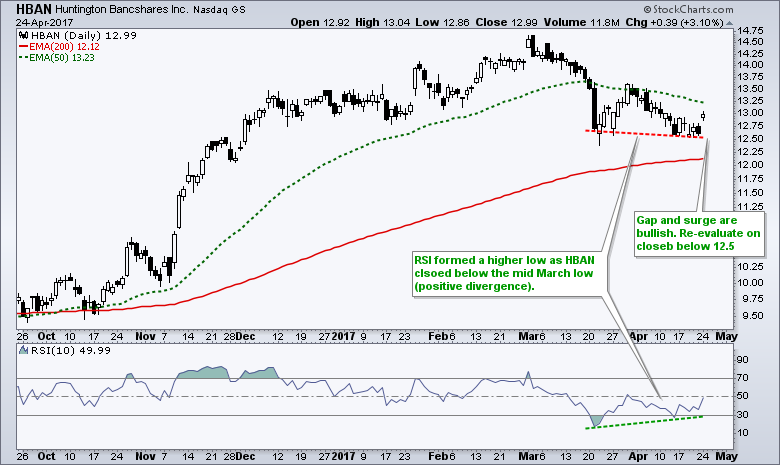
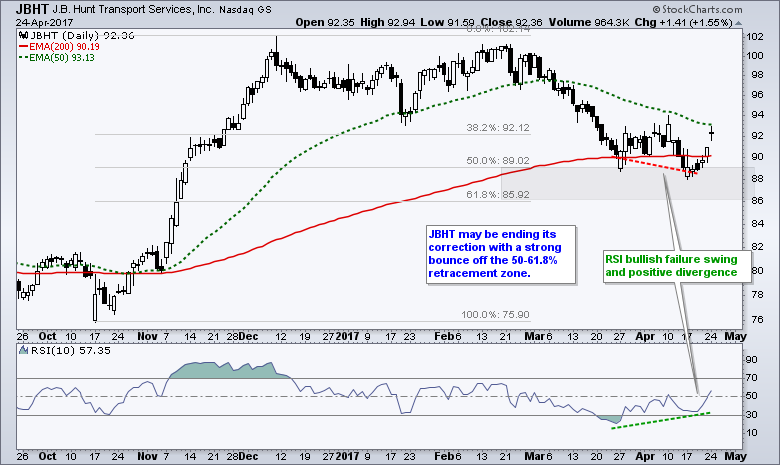
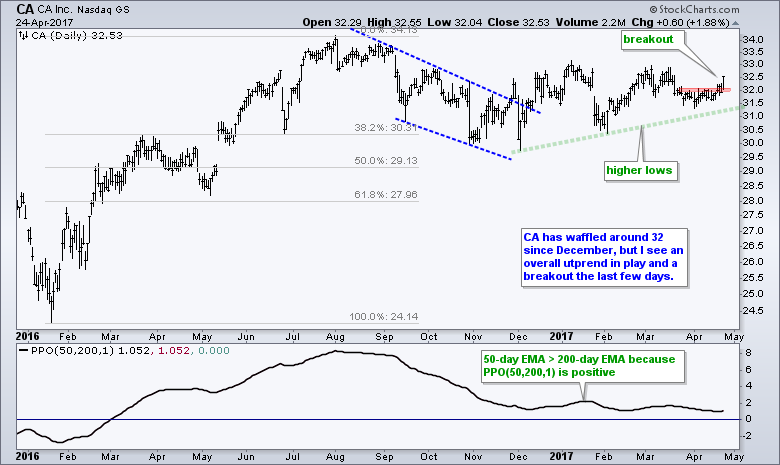
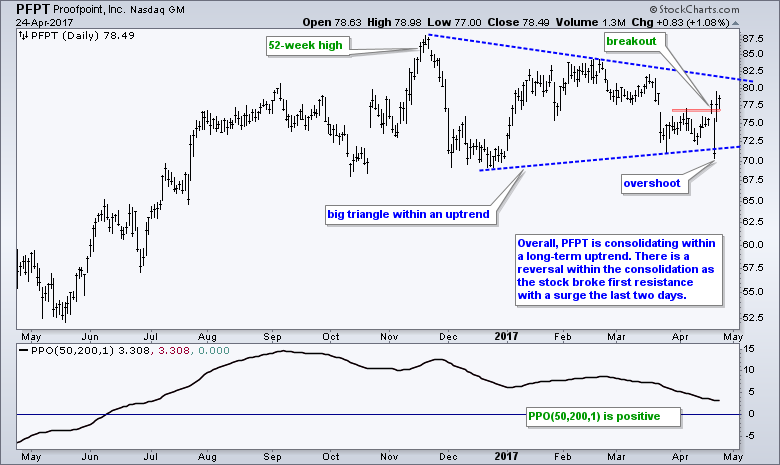
Stocks to Watch: HBAN, JBHT, CA, PFPT, NKE, WBC
******************************************************
Spotting Pullbacks and Upturns within an Uptrend using RSI and MACD Histogram.
Difference between EMA and SMA - Using %Above 200-day EMA for Breadth Analysis.
Backtesting Different Moving Average Pairs with SPY, QQQ and IWM.
ETF Master ChartPack - 300+ ETFs organized in a Master ChartList and in individual groups.
Follow me on Twitter @arthurhill - Keep up with my 140 character commentaries.
****************************************
Thanks for tuning in and have a good day!
--Arthur Hill CMT
Plan your Trade and Trade your Plan
*****************************************


