.... IJR Mean-Reversion Trade in Play
.... Marking Upswing Support for MDY
.... Chinese Stocks Spring to Life
.... Asian Index ETFs Show Broad Strength
.... Finding Stocks within an Industry Group
.... Aluminum Stocks Look Poised for Upturn
.... Railroad Stocks Lead with Big Gains
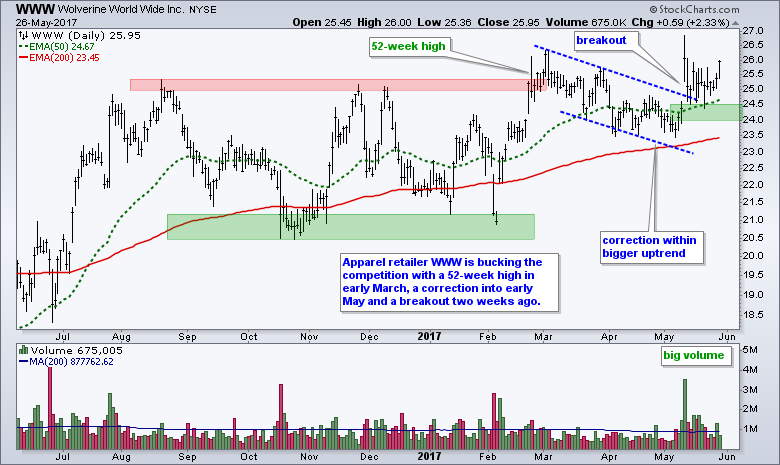
.... Stocks to Watch: MON, FLIR, CY, PANW, PAYX, WWW ....
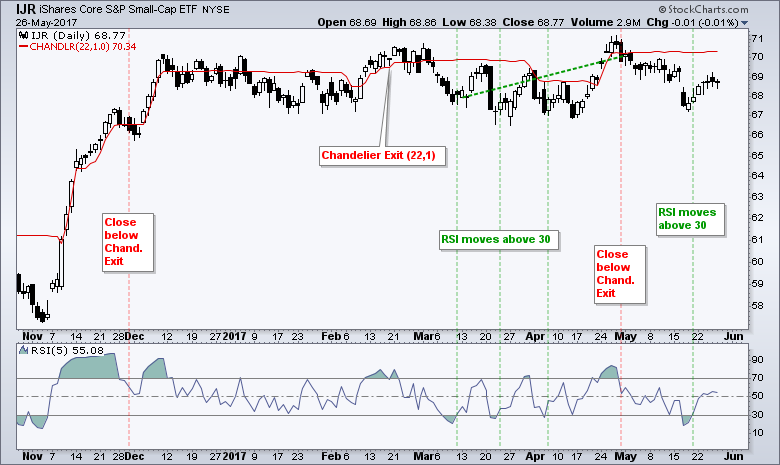
IJR Mean-Reversion Trade in Play
Small-caps and mid-caps continue to lag large-caps and large-techs. Before looking at the S&P SmallCap iShares (IJR) and S&P MidCap SPDR (MDY), note that SPY and QQQ hit 52-week highs last week and this is bullish for the broader market. IJR and MDY, in contrast, are largely flat since mid December, but both triggered short-term bullish signals using the RSI(5) mean-reversion strategy. You can read all the details in this System Trader article. Basically, the system goes long when RSI(5) moves above 30 and exits when the ETF closes below the Chandelier Exit (22,1). IJR triggered bullish on May 19th when RSI moved above 30. The ETF is still below the Chandelier Exit and this means an exit signal has yet to materialize. The system will simply wait until IJR closes above the Chandelier Exit and exit when IJR closes back below the Chandelier Exit. Note that signals are based on closing prices and actual trades take place on the next open. I am an end-of-day (EOD) trader.
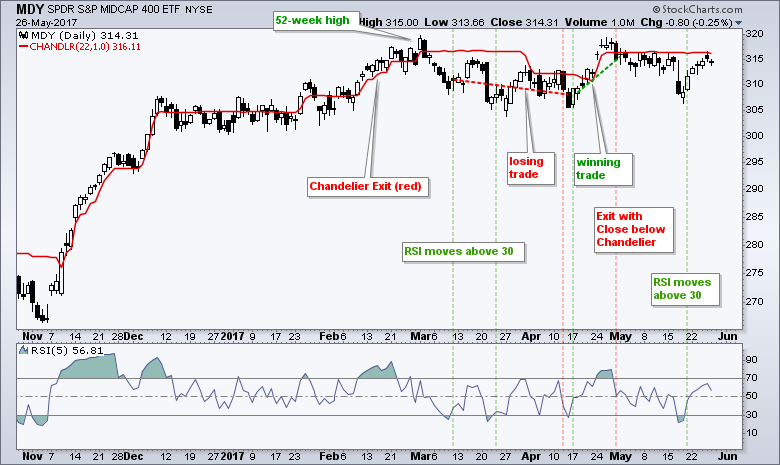
Marking Upswing Support for MDY
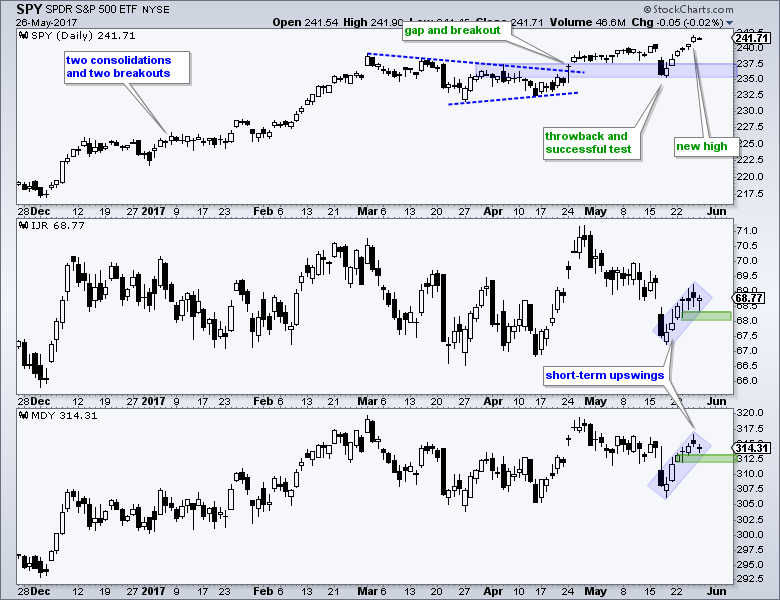
The charts above show RSI and the Chandelier Exit because this is all we need to see for the system. The next charts are without indicators to show the patterns at work. Note that the patterns do not always agree with the RSI system. SPY broke triangle resistance, tested this breakout and moved to new highs last week. There is clearly nothing negative to report on this chart. IJR gapped down to towards the March lows and bounced back into the gap zone last week. The blue shading shows a possible bear flag and a close below 68 would break flag support. MDY got a bigger bounce and I am marking upswing support at 311.9 for now.
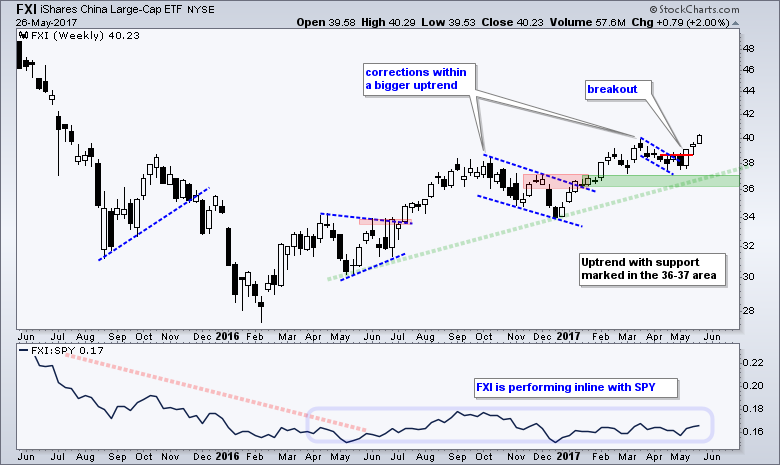
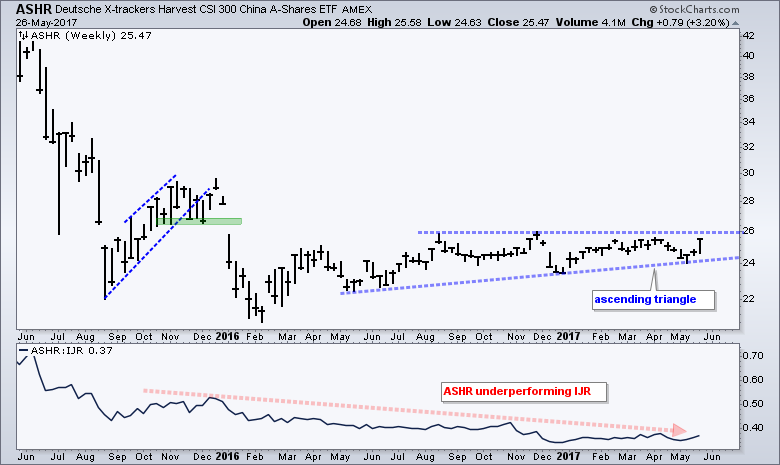
Chinese Stocks Spring to Life
The CSI 300 China A-Shares ETF (ASHR) led the global stock index ETFs last week with a 3.20% surge. In addition, the China iShares (FXI) hit a new 52-week high. In general, ASHR is a broader ETF with some 300 holdings and FXI is a large-cap ETF with just 30 stocks. The first chart shows FXI breaking flag resistance three weeks ago. The bigger trend is clearly up with the rising lows and 52-week high. The second chart shows ASHR with a large ascending triangle, which could be a base of sorts and a breakout at 26 would be bullish. Note that FXI and ASHR were featured in Art's Charts on April 25th.
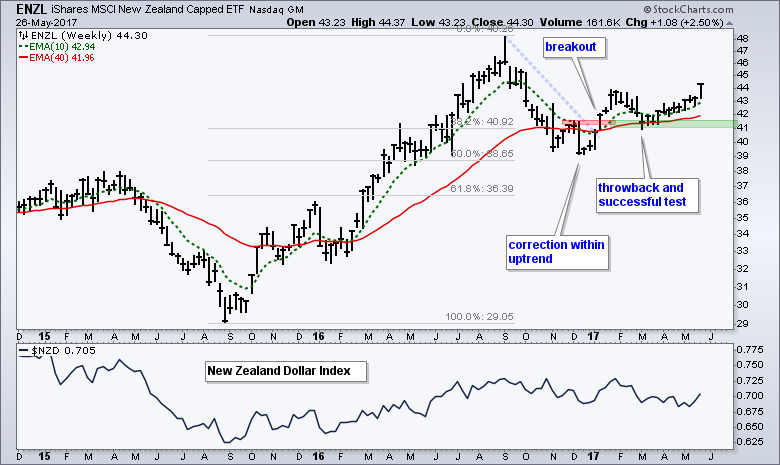
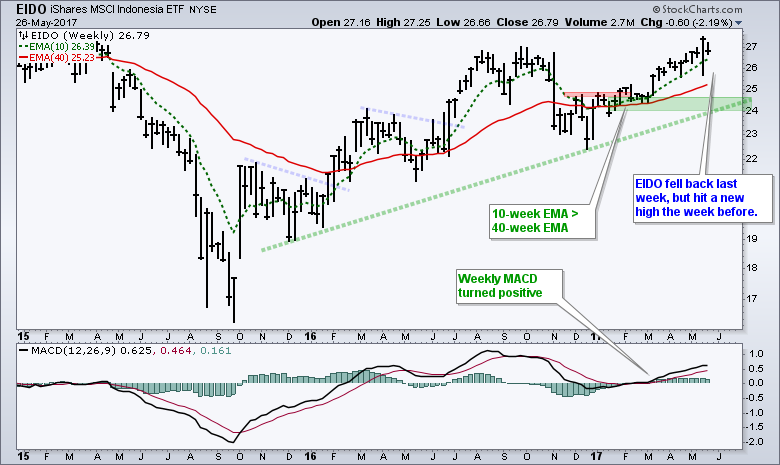
Asian Index ETFs Show Broad Strength
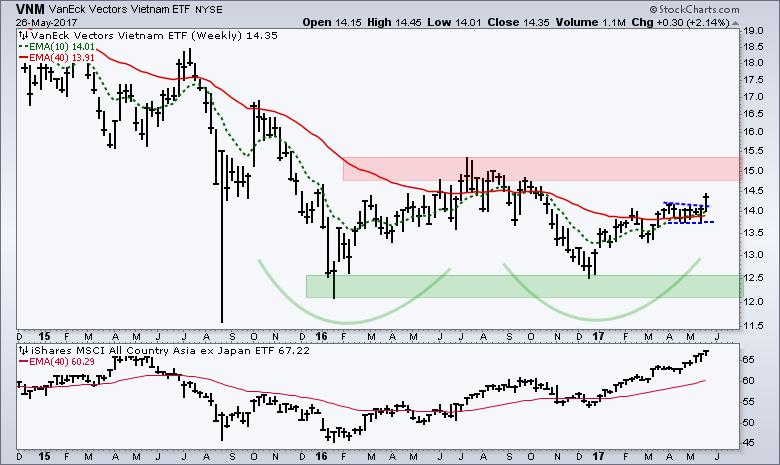
Elsewhere in Asia, the South Korea iShares (EWY) hit a new high last week and the iShares S&P India Nifty 50 ETF (INDY) hit a new high in mid May. There is clearly some strength in Asia. I also featured the New Zealand iShares (ENZL), the Indonesia iShares (EIDO) and the Vietnam ETF (VNM) on April 3rd. These three continue to work their way higher. I am just using very simple techniques for ENZL and EIDO. Identify the bigger trend, look/wait for corrections within that trend, and set levels to signal an end to the correction.
The Vietnam ETF (VNM) chart is a little different because the bigger trend has yet to turn up. Well, it could be turning up now because the 50-day EMA moved above the 200-day EMA four weeks ago. VNM advanced from late December to early April and then stalled for six weeks with a flag or pennant. The ETF broke out of this pattern with a 2.14% surge last week.
Finding Stocks within an Industry Group
I would like to think that strength in Asia would be positive for base metals and aluminum, and that rising aluminum prices would be bullish for aluminum stocks. This kind of rationalization sounds good in theory, but it is a narrative and narratives can be dangerous. I would, therefore, simply look at the price charts for the aluminum stocks and assess them on their own merits. When possible, I think it is important to group similar stocks to see how the group is performing as a whole. Perhaps there is a bigger theme at work and this theme is affecting the group. You can find industry group components using our Sector Summary tool.
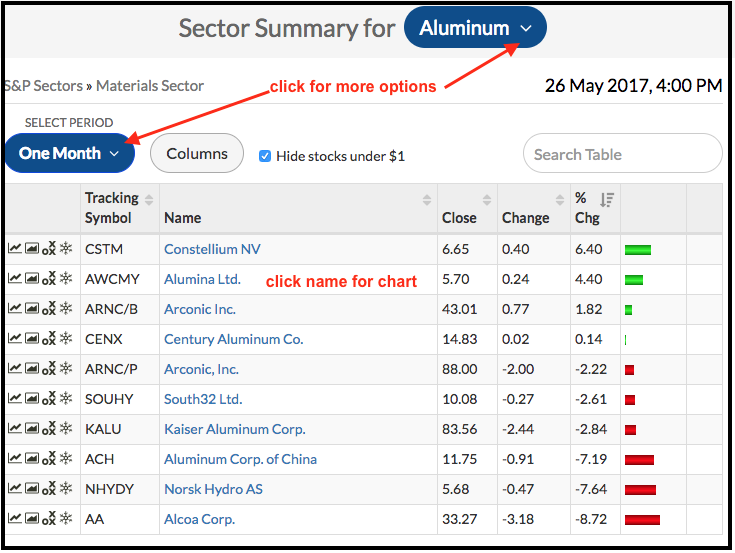
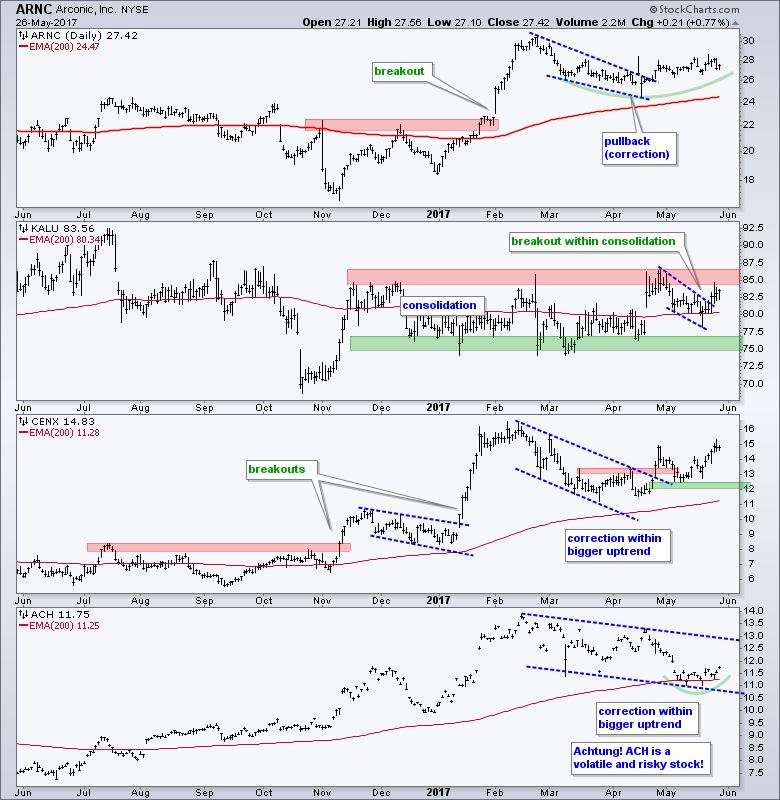
Aluminum Stocks Look Poised for Upturn
The chart below shows Arconic (ARNC), Kaiser Aluminum (KALU), Century Aluminum (CENX) and Aluminum Corp of China (ACH). KALU has been stuck in a trading range, but the other three advanced from November to February and then corrected into April. ARCN and CENX are making bids to end their corrections with upturns in May. KALU broke wedge resistance with a surge last week. ACH is firming near the rising 200-day EMA, which, by the way, I do not consider a support level. Moving averages do NOT make for robust support or resistance levels.
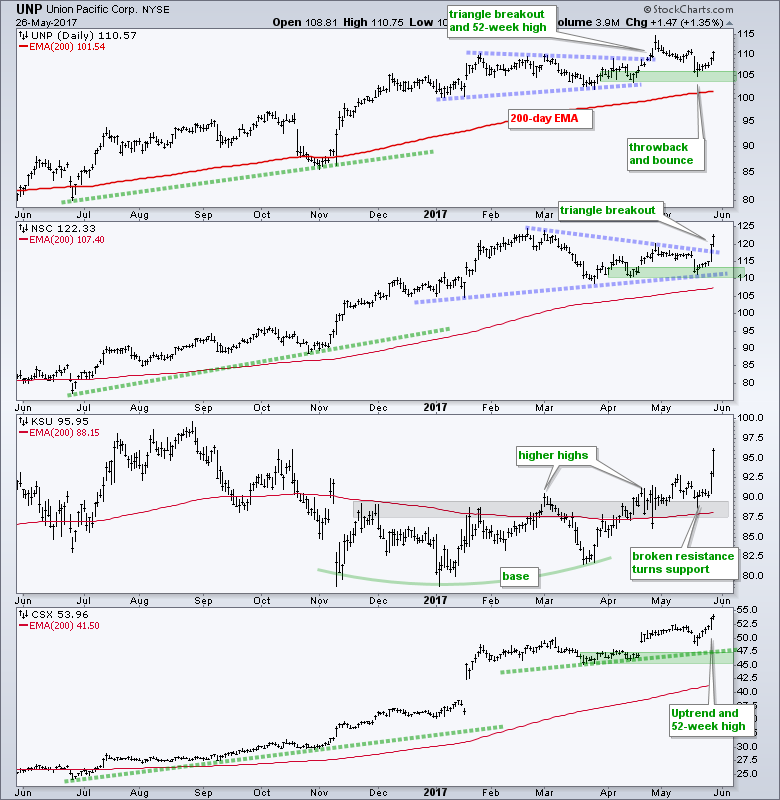
Railroad Stocks Lead with Big Gains
It was a big week for railroad stocks with Kansas City Southern (KSU) surging 6% and CSX Corp (CSX) hitting a 52-week high. I featured three railroad stocks in mid May, but got a little shortsighted when looking at the charts. I was highlighting some short-term bullish patterns that did not trigger in UNP and NSC. Both fell sharply on 17-May, but this decline was not enough to derail the bigger uptrends at work. This is probably why stop-losses do not help when the bigger trend is up. UNP fell back into the triangle consolidation and bounced. NSC broke triangle resistance to signal a continuation of the bigger uptrend. KSU held its breakout zone and surged. CSX is the clear leader with a fresh 52-week high.
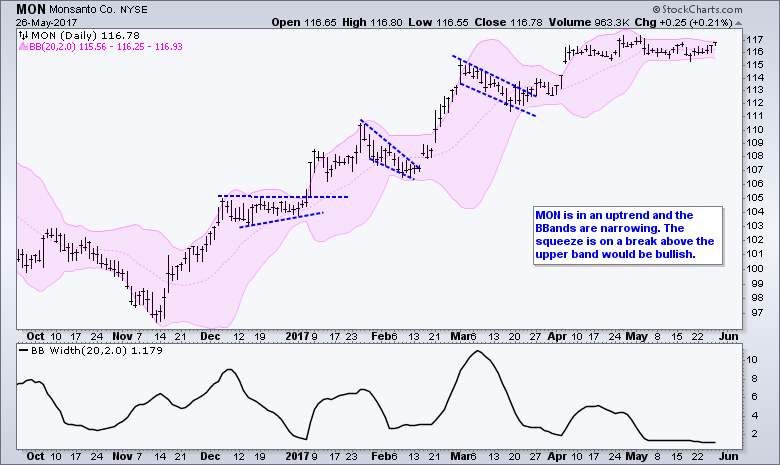
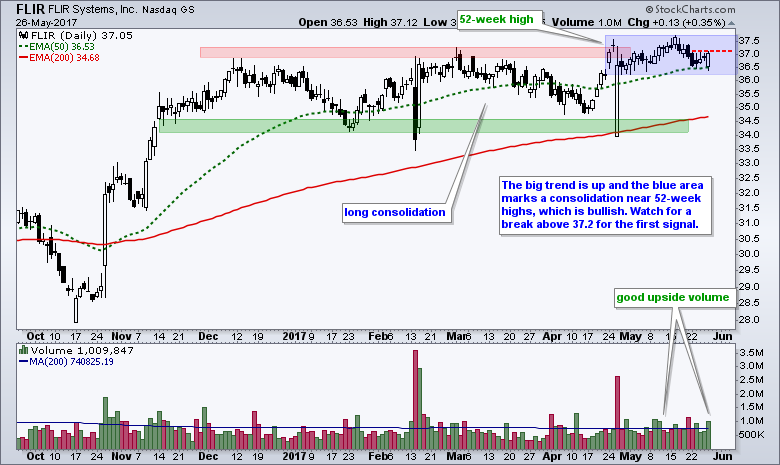
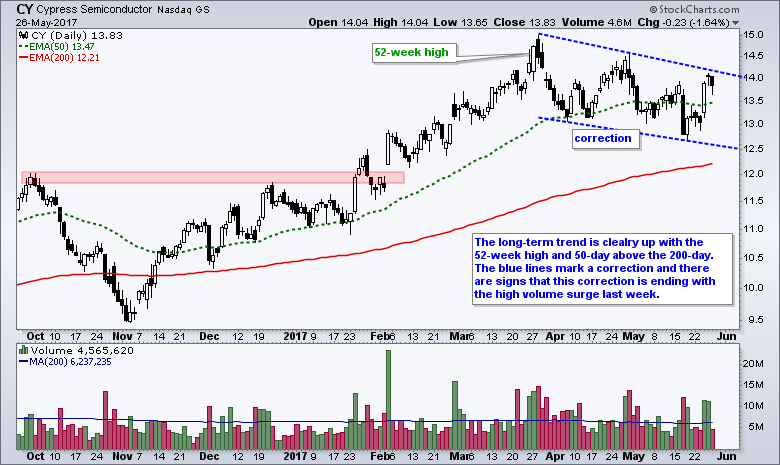
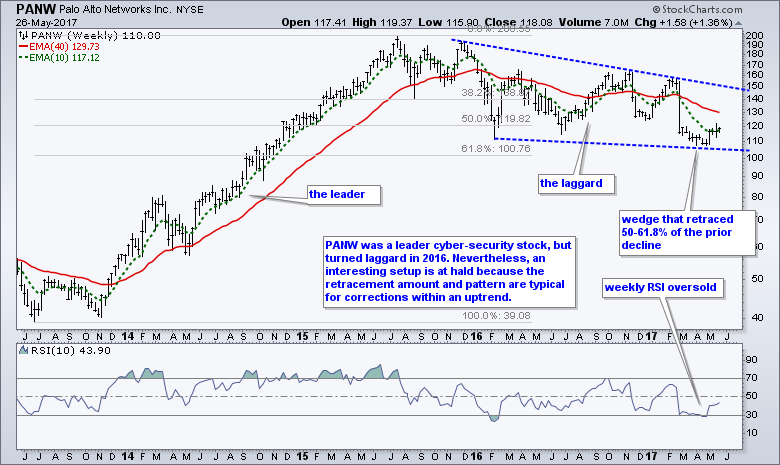
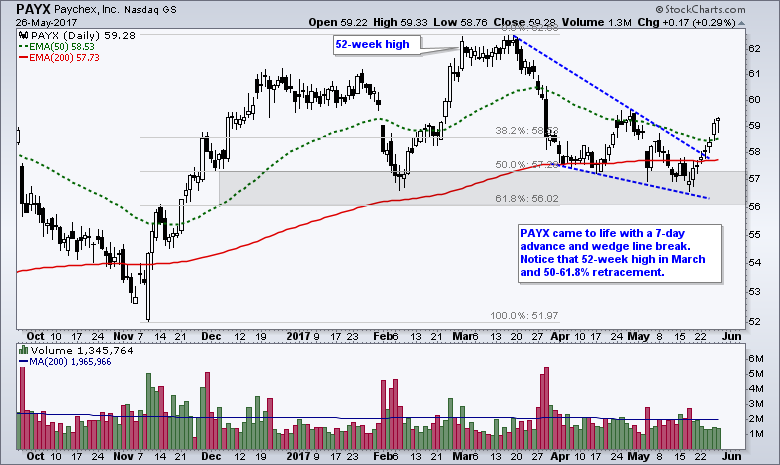
Stocks to Watch: MON, FLIR, CY, PANW, PAYX, WWW
******************************************************
ETF Master ChartPack - 300+ ETFs organized in a Master ChartList and in individual groups.
Follow me on Twitter @arthurhill - Keep up with my 140 character commentaries.
****************************************
Thanks for tuning in and have a good day!
--Arthur Hill CMT
Plan your Trade and Trade your Plan
*****************************************


