 |
.... Stocks Bounce without Biotechs |
----- Art's Charts ChartList (updated 26-May) -----
Stocks Bounce without Biotechs
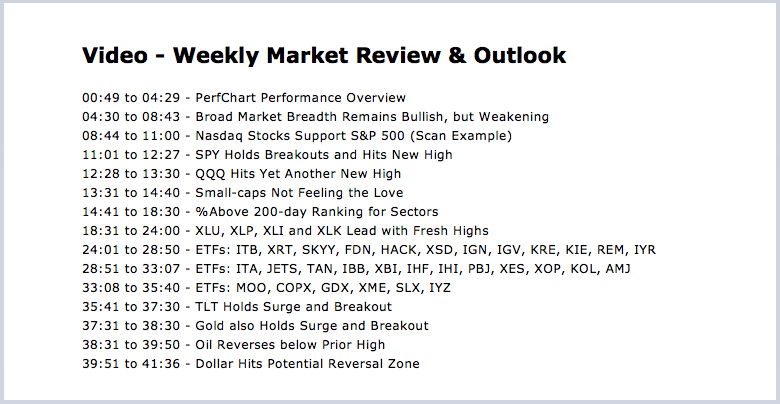
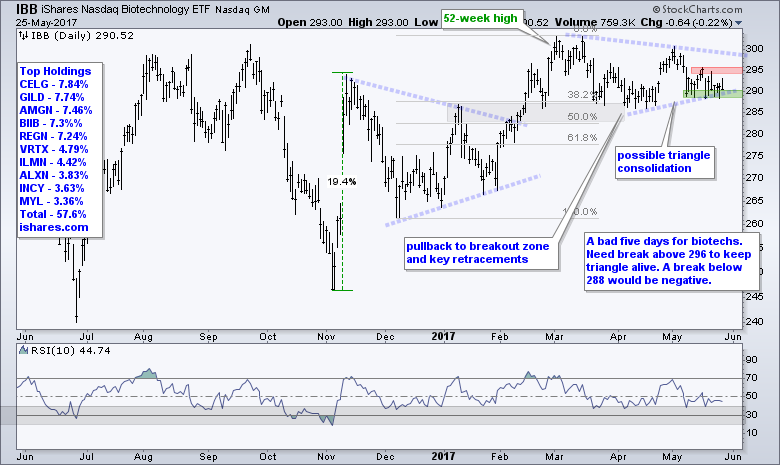
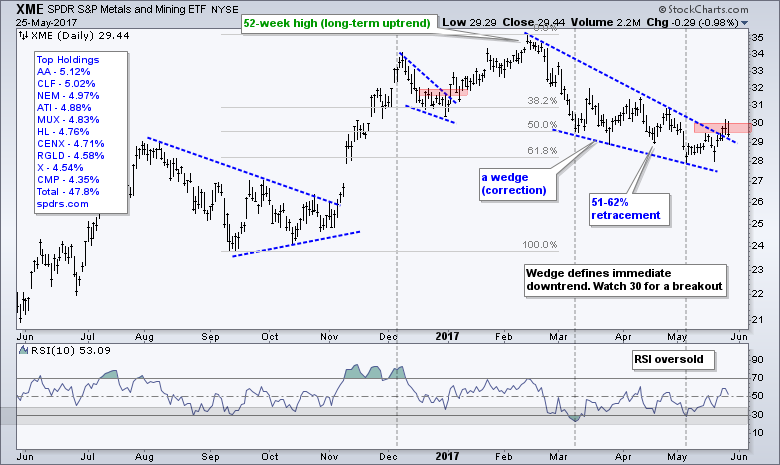
Stocks bounced again this week with large-caps leading the way and small-caps lagging. The S&P 500 SPDR and Nasdaq 100 ETF hit new highs, but the S&P SmallCap iShares and S&P MidCap SPDR remain well below their 52-week highs. Nevertheless, small-caps and mid-caps have yet to actually break down and the new highs in SPY are clearly bullish for the broader market. Today's commentary will look at broad market breadth, the sectors and the intermarket area. As the video timeline shows, I covered the industry group ETFs in the weekly video (above). For a preview, I am a bit concerned with the weak performance of the biotech Tech ETFs this week. I am also watching XME and COPX closely to see if they can follow through and trigger wedge breakouts. Have a great three-day weekend and see you again on Tuesday.
Broad Market Breadth Remains Bullish, but Weakening
I will start with the breadth indicators for the S&P 1500, which have been bullish since 31-March-2016. There are links below this chart for those needing more explanation on these indicators. The 10-day EMA of AD Percent ($SUPADP) surged above 30% in early March 2016 and again exceeded this level in July, November and December. The blue shadings mark three surges in February, April and May. The April surge looked strong, but there was no follow through and the current surge does not look very strong. Notice that the indicator only moved from -15% to +12%. Despite a seemingly weak bounce, it is still more bullish than bearish. A move below -30% is needed to show enough selling pressure to warrant a bearish signal.
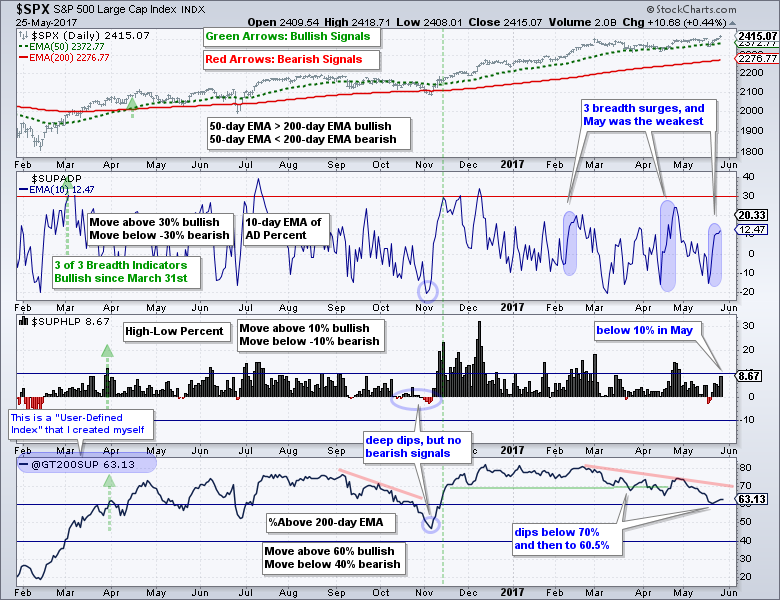
S&P 1500 High-Low Percent ($SUPHLP) continues to struggle in May because we are seeing new lows in lots of energy stocks and some stocks from the consumer discretionary sector. Despite these new lows, there are still more new highs than new lows in the broader market and this is keeping High-Low Percent in positive territory. Again, it is not that strong, but it is certainly more bullish than bearish. Sometimes we do not need to know the degree of bullishness or bearishness. We just need to weigh the balance and accept the result. The %Above 200-day EMA started weakening in March and continues weak. Again, it is still bullish overall, but note that 36.7% of stocks in the S&P 1500 are below their 200-day EMA. This weakening looks similar to what we saw in October. Look for a break back above 70% to signal a return to broad market strength.
Related Links: How to create a user-defined index (@GT200SUP).
Understanding the AD Percent Indicators, High Low Indicators and %Above 200-day EMA Indicators.
Nasdaq Stocks Support S&P 500
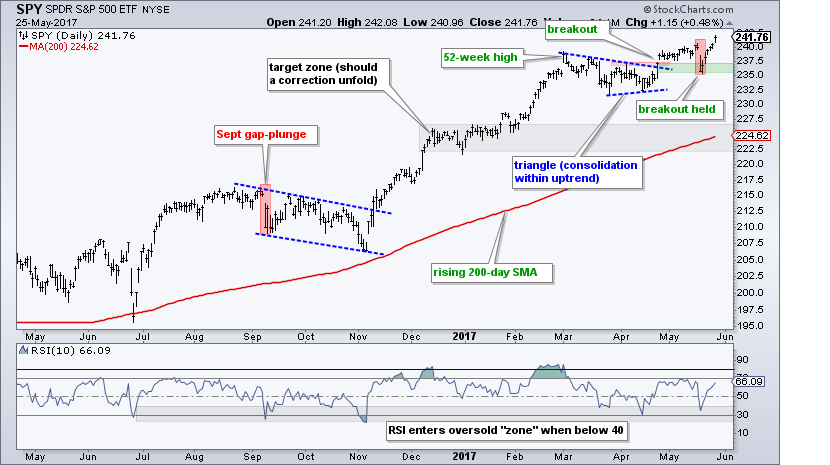
Before looking at the SPY chart, note that 85 stocks from the Nasdaq 100 are part of the S&P 500 and I count around 120 Nasdaq stocks in SPY. These Nasdaq stocks account for 30% of SPY. Clearly, the S&P 500 is getting a lot of help from the Nasdaq (aka Technology). I have long argued that a full-blown correction is impossible without participation from the S&P 500 and SPY has yet to correct. Well, we did see a short correction with the triangle consolidation and this ended with the early May breakout. SPY tested this breakout with the dip to 235 and ultimately held with a surge to new highs this week. The green zone marks the first support level to watch. A close below 235 would negate the breakout and suggest that a correction may be unfolding. Let's cross that bridge when and if it gets here.
QQQ Hits Yet Another New High
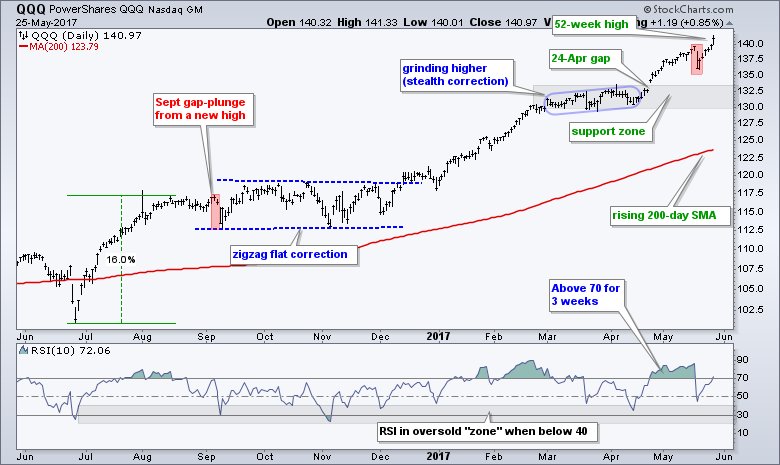
It is easy to understand strength in SPY when we look at the Nasdaq 100 ETF (QQQ) chart. QQQ gapped up on April 24th, hit new highs, fell sharply on May 17th (red zone) and immediately rebounded to new highs. Talk about buy the dip kind of strength. QQQ is now up 8% in six weeks, and yet again looking overbought. Keep in mind that overbought is simply a vague observation and there is not much we can do with this information. Stocks and ETFs in strong uptrends are supposed to become overbought. I will simply mark a support zone in the 130-133 area and wait for a short-term oversold condition, which is more actionable.
Small-caps Not Feeling the Love
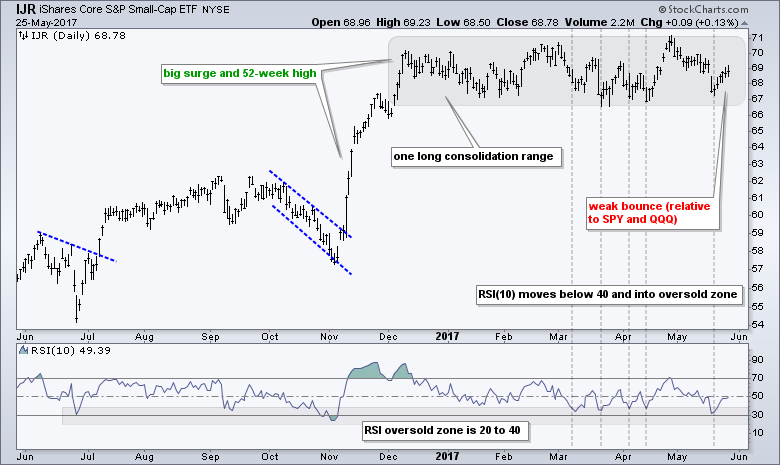
Small-caps remain the flat spot in the market. I did not say weak spot because the S&P SmallCap iShares (IJR) has been flat for five months, not down. Flat means some stocks in the ETF are down and some are up. IJR got a bounce the last six days, but this bounce is clearly not as strong as the bounces seen in SPY and QQQ, which hit new highs. Small-caps are just not the place to be right now.
Sector Balance Clearly Bullish
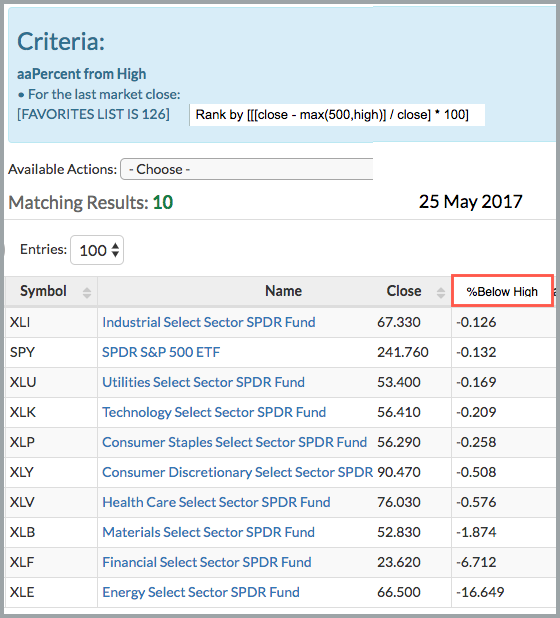
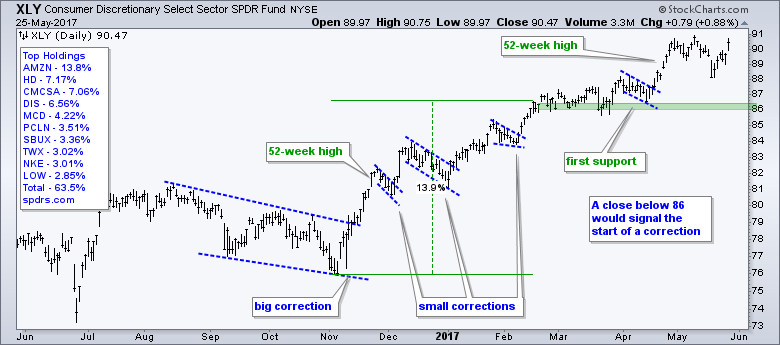
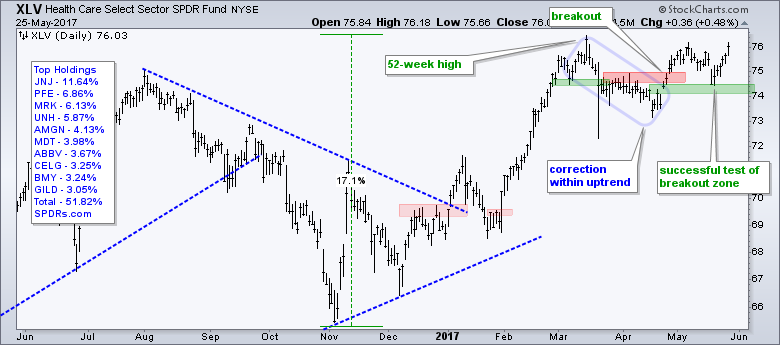
The sector balance favors the bulls with the Technology SPDR (XLK), Industrials SPDR (XLI), Consumer Staples SPDR (XLP) and Utilities SPDR (XLU) hitting new highs this week. The Consumer Discretionary SPDR (XLY) and the HealthCare SPDR (XLV) did not hit new highs this week, but both are within 1% of a 52-week high. Together, these six sectors account for over 70% of the S&P 500 and this supports the bull market.
%Above 200-day Ranking for Sectors
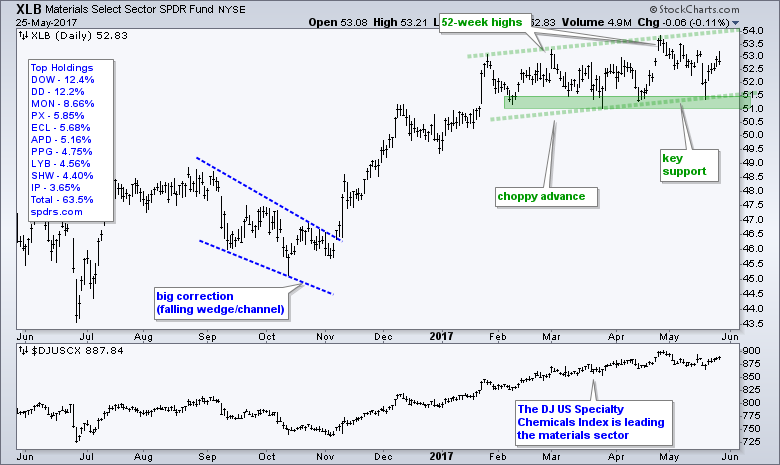
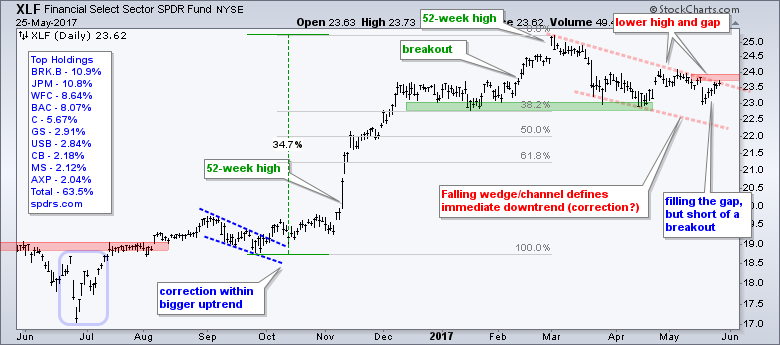
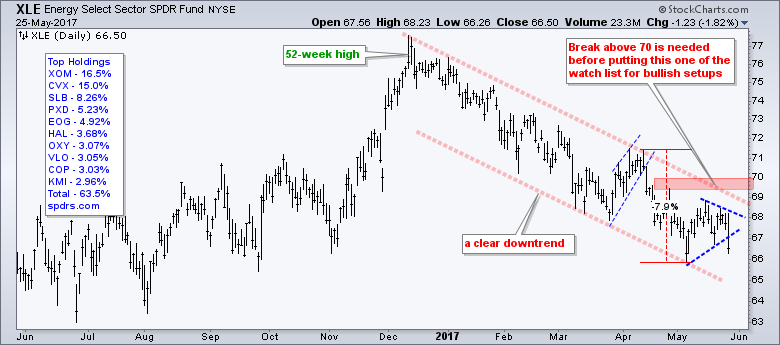
I will, however, be the first to admit that a few large-caps in XLY are driving it higher because 47% of stocks in this sector are trading below their 200-day EMA. The chart below shows the %Above 200-day EMA for the S&P 500 and the nine sectors, and the sectors are sorted by the indicator value. Notice that over 80% of stocks in the utilities, technology and finance sectors are above their 200-day EMA. Even though the finance sector weakened over the last two months, the long-term trends are up for most stocks within this sector. Further down, over 70% of stocks in the materials, healthcare and consumer staples sectors are above their 200-day EMAs. The consumer discretionary and energy sectors are clearly the weakest when sorting by this metric. In fact, Energy is the only one on a bear signal, which triggered in mid April when the indicator exceeded 40%.
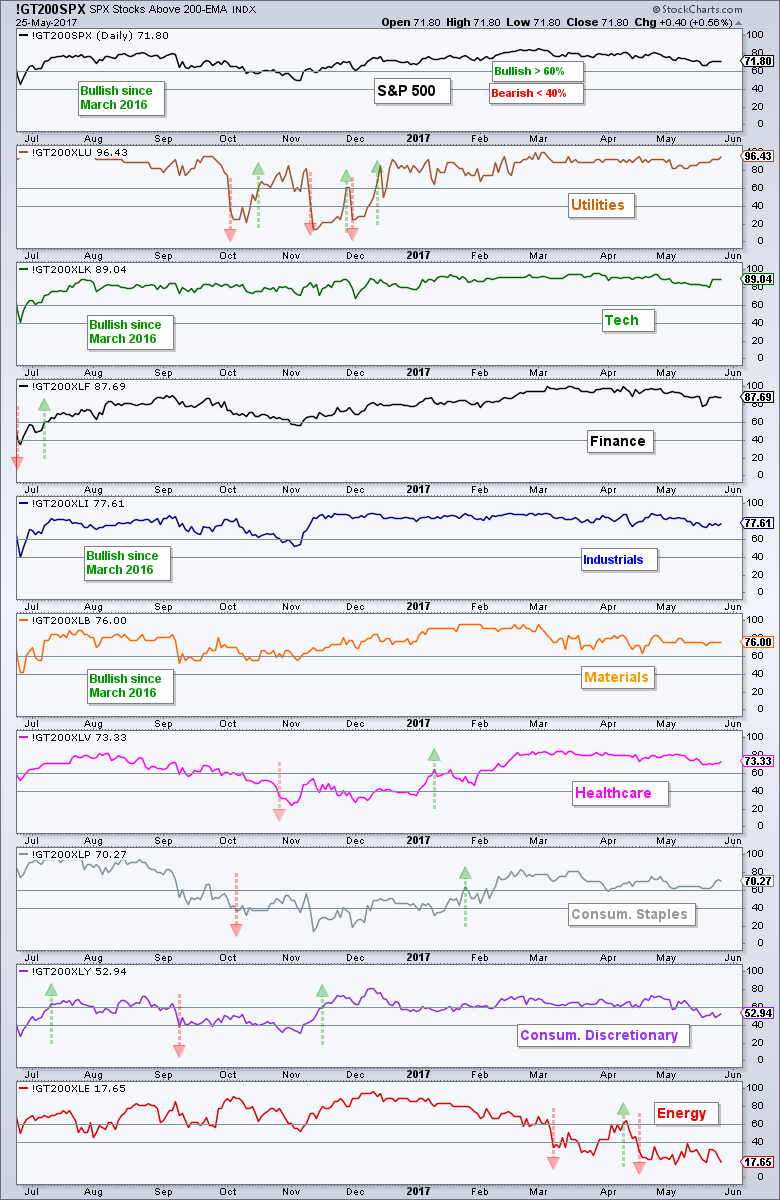
Pro Tip: You can change the number "200" in the symbols to chart the %Above 50-day EMA or %Above 20-day EMA. !GT200XLK would be !GT50XLK or !GT20XLK. The %Above 20-day EMA indicators can be used to find short-term oversold conditions (when the bigger trend is up and %Above 200-day is strong). For example, !GT200XLI got a nice oversold bounce and !GT20XLF may be getting one now.
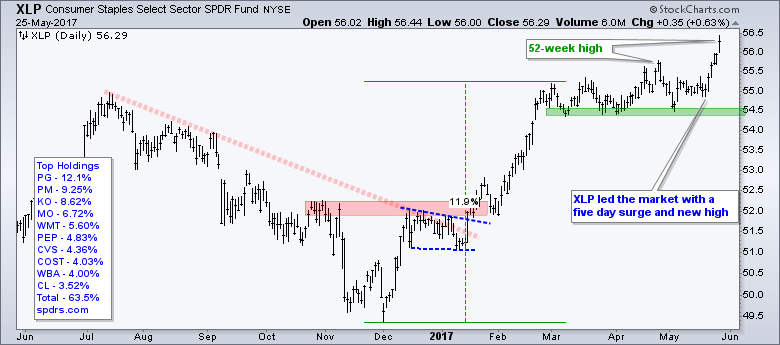
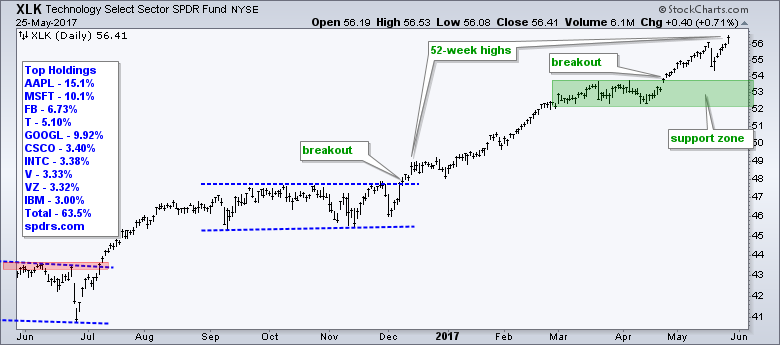
XLP, XLU, XLI and XLK Lead with New Highs
The next charts show the nine sector SPDRs with the strongest at the top and the weakest at the bottom. Utilities and staples are at the top because they were the first to hit 52-week highs this week. Even though XLK wins the percentage gain contest (moment), XLK did not hit a 52-week high until Thursday.


TLT Holds Surge and Breakout
The 20+ YR T-Bond ETF (TLT) broke out with a surge above 122 and then stalled for six days. This stall looks like a bull flag on a 30-minute chart and a breakout at 123.75 would signal a continuation higher. Overall, the trend is up since the higher high in mid April and I would re-evaluate on a close below 120.
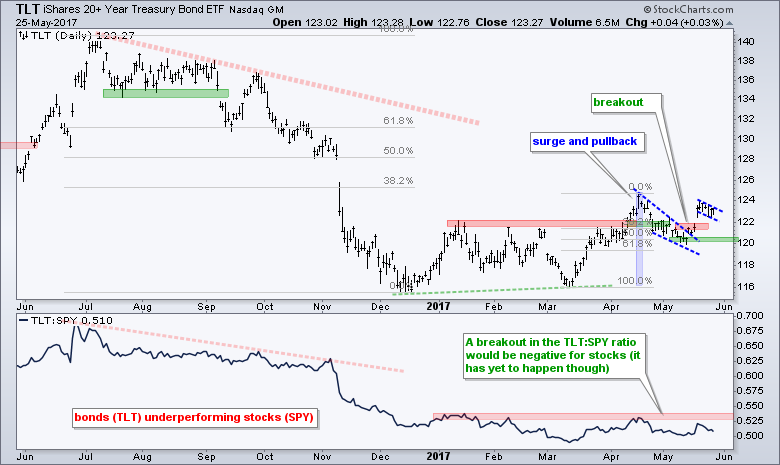
The indicator window shows the TLT:SPY ratio flattening out over the last few months. This ratio hit a new low in mid March and the overall trend is down, which favors stocks because this means bonds are underperforming. The red zone marks the fat line in the sand and a break above this zone would show relative strength in TLT, a development that would be negative for stocks.
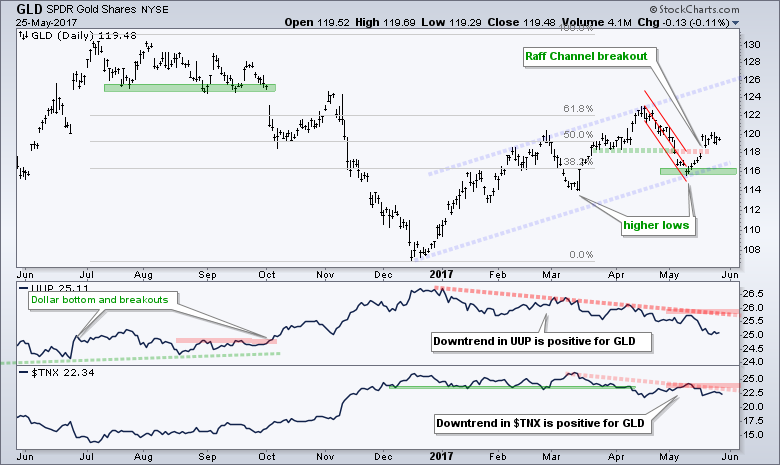
Gold also Holds Surge and Breakout
The Gold SPDR (GLD) is benefitting from weakness in the Dollar and the 10-yr T-Yield ($TNX). The Dollar has been falling all year and the 10-yr yield has been falling since mid March. Overall, I see a rising channel for GLD since mid December. The ETF reversed the downswing within this channel by breaking above the Raff Regression Channel. This breakout is holding and bullish until proven otherwise. A close below 118 is the first level to watch. A close below 116 would reverse the overall uptrend.
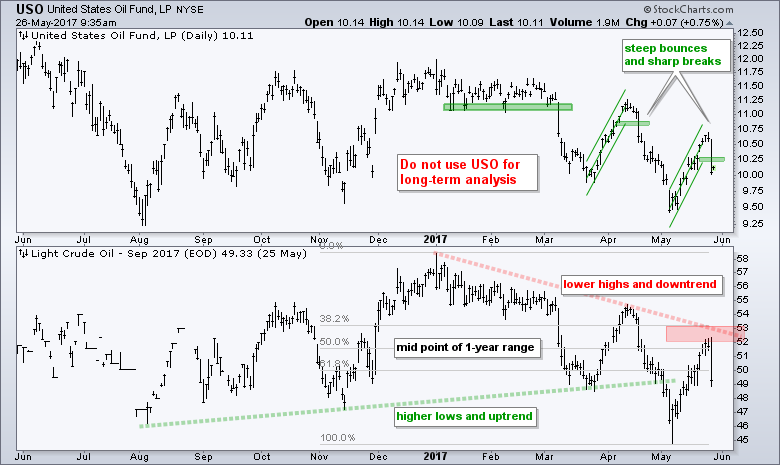
Oil Reverses below Prior High
Oil has gone nowhere for over a year, but I think there are two discernable trends at work. There was an uptrend in place at the beginning of 2017 and this gave way to a downtrend over the past month. Note that I am using September Crude Futures for long-term analysis (^CLU17). The green line marks the uptrend and the red line marks the downtrend. Oil got an oversold bounce back to the mid point of the one-year range ($52 area) and reversed with a sharp decline. The USO Oil Fund (USO) reversed sharply for the second time in as many months.
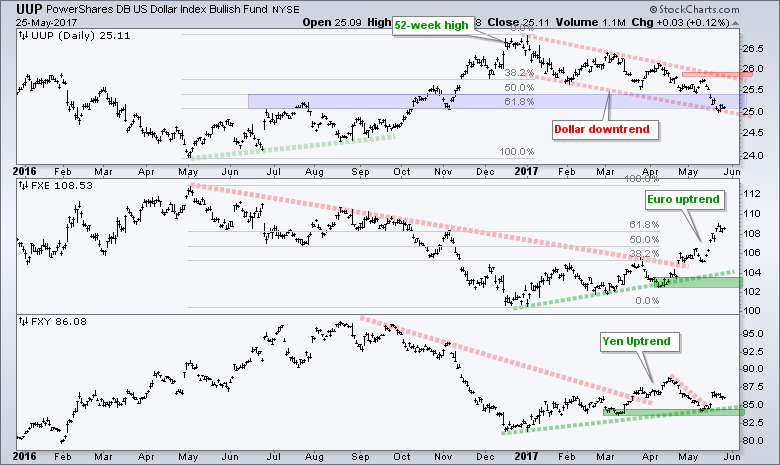
Dollar Hits Potential Reversal Zone
The US Dollar ETF (UUP) remains in a steady downtrend in 2017, but notice that this decline has retraced 62% of the prior advance and returned to the October breakout zone. Cue twilight zone music. Also note that the greenback is also quite oversold after a 4% plunge the last six weeks. We do not need a momentum oscillator to figure this out. The Euro is up around 5.7% in six weeks. There are no signs of a Dollar bounce just yet, but I will keep a close eye on this chart because UUP is in a potential reversal zone.
******************************************************
ETF Master ChartPack - 300+ ETFs organized in a Master ChartList and in individual groups.
Follow me on Twitter @arthurhill - Keep up with my 140 character commentaries.
****************************************
Thanks for tuning in and have a good day!
--Arthur Hill CMT
Plan your Trade and Trade your Plan
*****************************************


