- New Highs in Six Major index ETFs
- Index AD Lines Hit New Highs
- Mid-cap and Small-cap AD Volume Lines Lag
- SPY Forms High Flag as QQQ Tests Support
- IJR Leads for Four Weeks
- Finance and Materials Lead New High List
- Finance and Regional Bank SPDRs Hold Breakouts
- Chemicals Lead Materials SPDR to New High
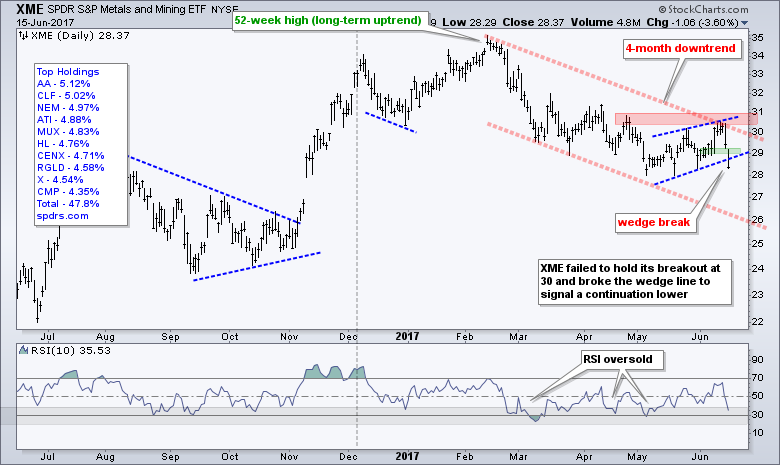
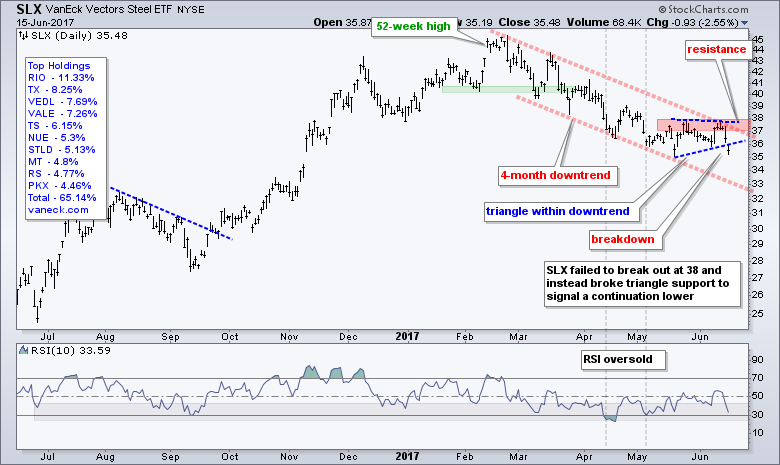
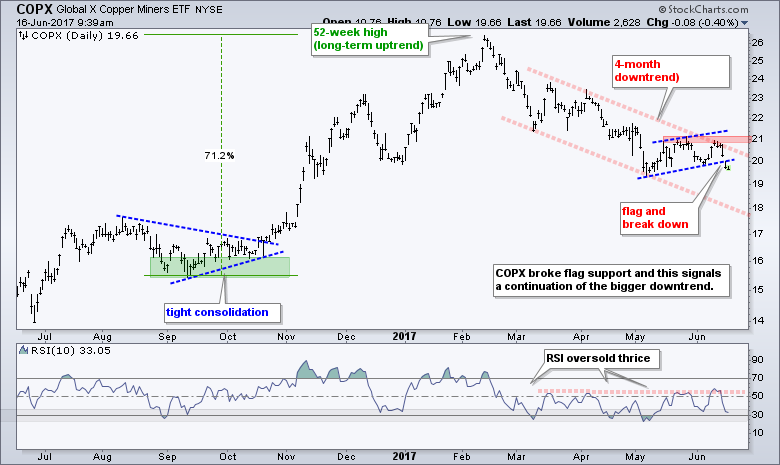
- XME, SLX and COPX Break Short-term Consolidations
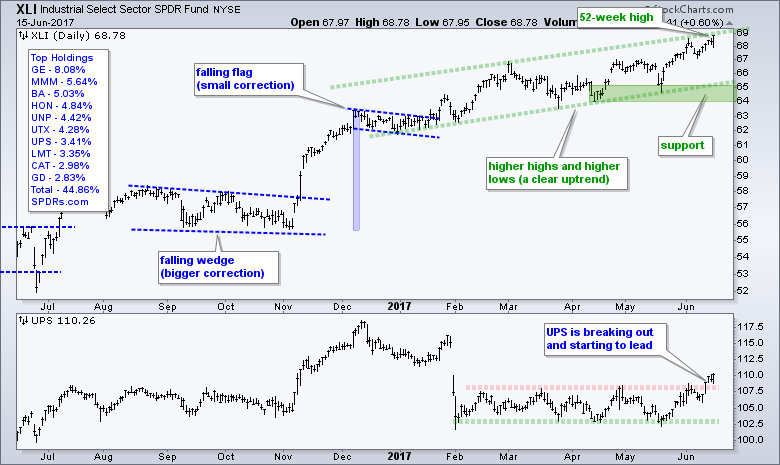
- XLI Hits New High with Help from Old Friend
- XLV Extends on Triangle Breakout (plus IBB)
- XLK and the Five Tech ETFs Hit Support Zones
- Utilities Follow Bonds Higher
- T-bond ETFs Hit New Highs (for some reason)
- GLD Nears Potential Reversal Zone
- Dollar Firms at Potential Reversal Zone
----- Art's Charts ChartList (updated 16-June) -----
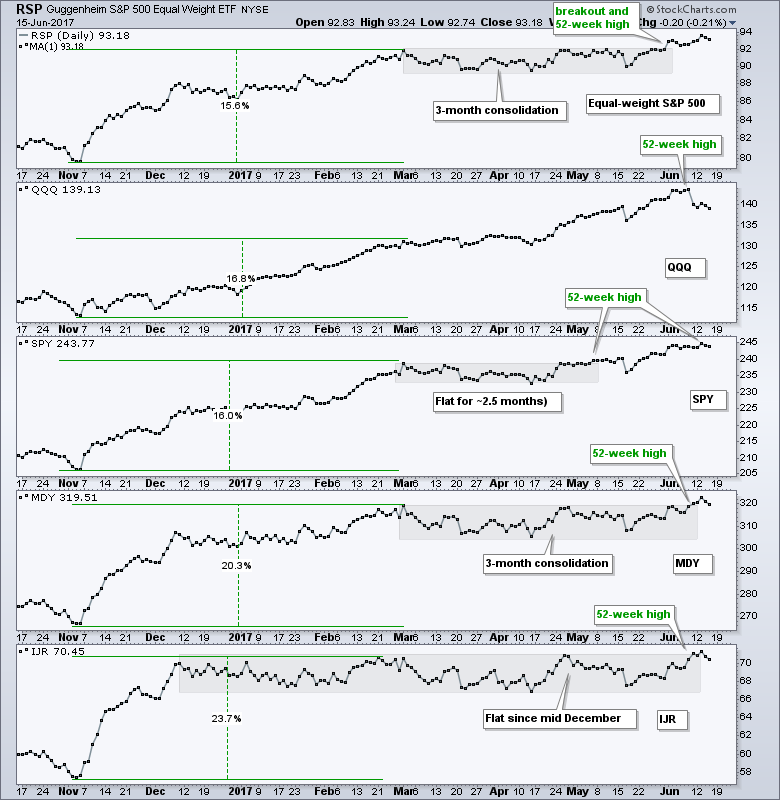
New Highs in Six Major index ETFs
Before looking at some key charts, note that the Equal-Weight S&P 500 ETF (RSP), the S&P 500 SPDR (SPY) and S&P MidCap SPDR (MDY) hit new highs on Tuesday, while the S&P SmallCap iShares (IJR), Russell 2000 iShares (IWM) and Nasdaq 100 ETF (QQQ) hit new highs last week. Thus, all six hit 52-week highs within the last two weeks. We can argue about overbought conditions, weak seasonal patterns, failed breakouts and the ripeness for a correction, but there is no denying the overall trend for the stock market. It is up and we are in a bull market. Channeling my old drinking buddy, Charles Dow, we cannot forecast the length or the duration of a bull market. It will end when we get a signal that it has ended - and not a moment sooner. This could be next month or next year. The chart below shows the EW S&P 500 ETF (top window) breaking out of a 3-month consolidation with a move in early June. This breakout is clearly bullish for the broader market. Notice that SPY was first with a breakout in mid May.
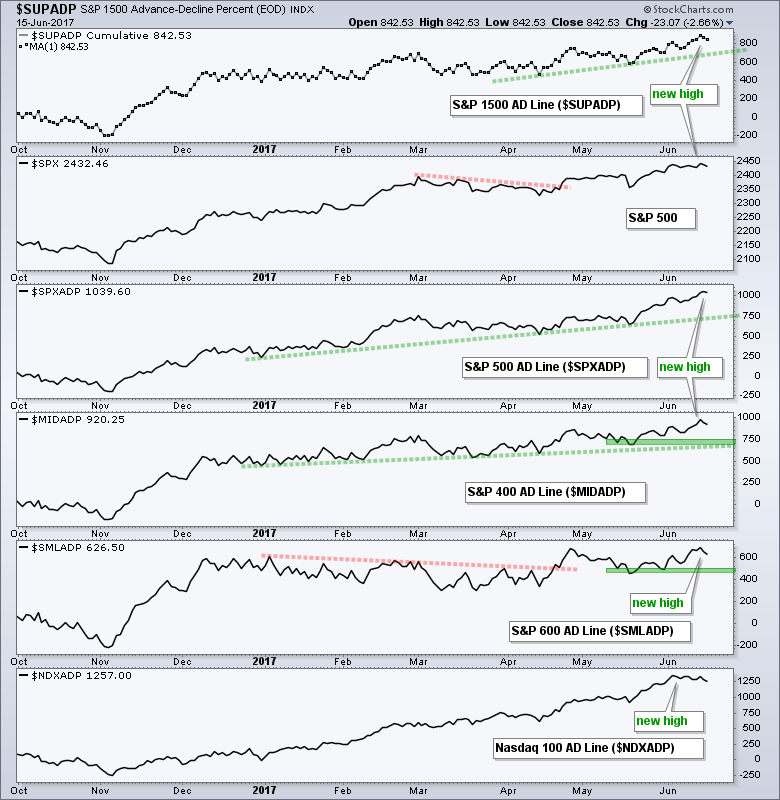
Index AD Lines Hit New Highs
Participation in the current advance is broad enough because the AD Lines for the S&P 1500, S&P 500, S&P Mid-Cap 400 and S&P Small-Cap 600 hit new highs this past week. The S&P Small-Cap 600 AD Line is the least strong of the group. Nevertheless, this AD Line is trending higher and shows no weakness yet. I marked the May lows with green zones for the S&P Small-Cap 600 and S&P Mid-Cap 400 AD Lines. Breaks below these zones would signal a downturn in small-cap and mid-cap breadth, and this would be negative for the broader market.
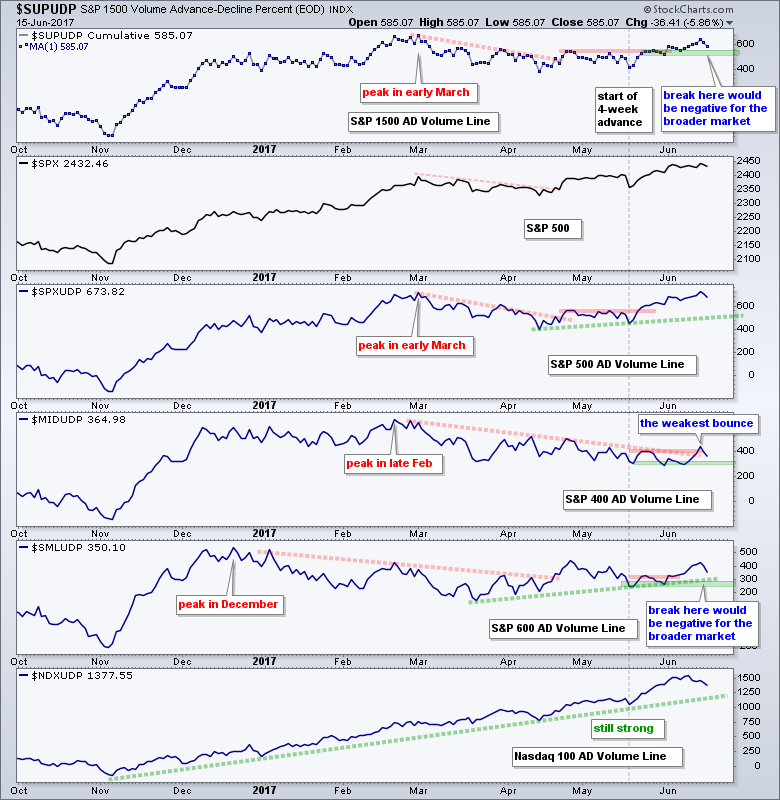
Mid-cap and Small-cap AD Volume Lines Lag
The next chart shows the AD Volume Line for the same indexes. The S&P 1500, S&P 500 and Nasdaq 100 AD Volume Lines hit new highs in June, but the S&P Small-Cap 600 and S&P Mid-Cap 400 AD Volume Lines remain below their April highs. The gray vertical line marks the start of the latest four week rally, which was led by small-caps and mid-caps. I marked key levels for the S&P 1500, S&P Mid-Cap 400 and S&P Small-Cap 600 AD Volume Lines with green zones. A break below these zones would signal an increase in selling pressure and suggest that the summer correction is here. It has not happened yet! This is just something to watch going forward.
SPY Forms High and Tight Flag
SPY surged to a new high in early June and then traded flat the last two weeks. Depending on how you draw your trend lines, this could be a flat flag or a pennant consolidation. Either way, this is a consolidation after a sharp advance and this makes it a bullish continuation pattern. Look for a breakout at 245 to continue the move. While a break below the flag lows would be a short-term issue, it would not affect the bigger uptrend because key support remains in the 235-237 area.
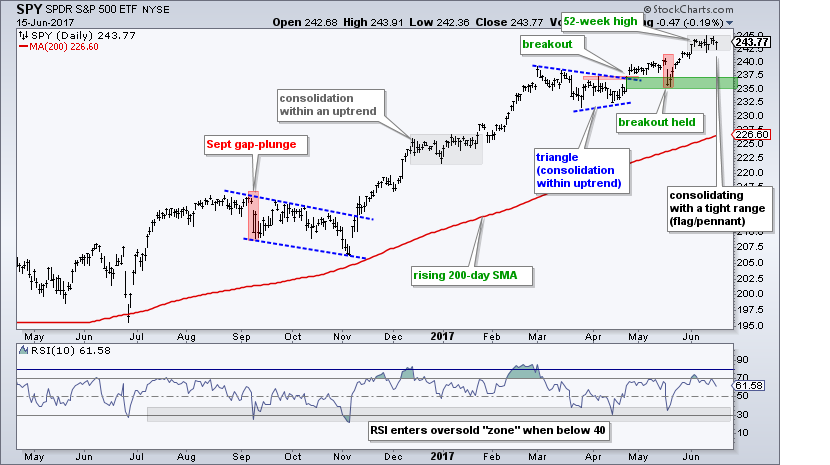
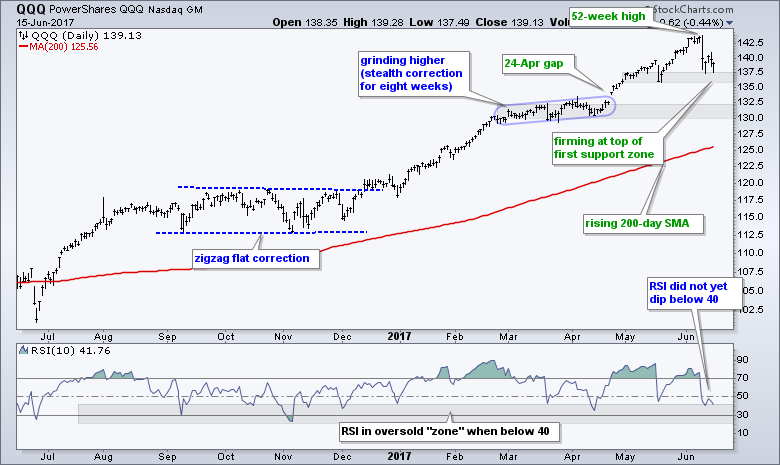
QQQ Tests First Support Zone
QQQ fell sharply last week and then firmed just above its first support zone (135-137). A break below this first zone would be negative and suggest that the second shoe is falling. I would then target a move to the 130-132 area.
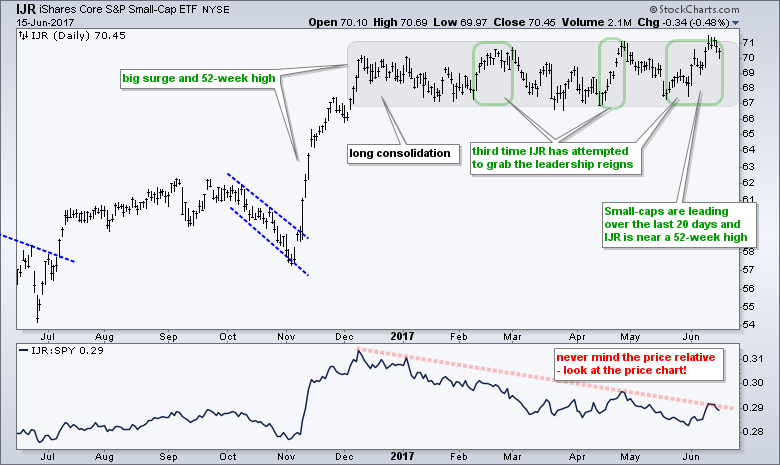
IJR Leads for Four Weeks
The S&P SmallCap iShares (IJR) led the major index ETFs higher the last four weeks and hit a new high last Friday. Technically, the ETF is still in the large consolidation zone, but there is a clear upward bias with 52-week highs in February, late April and June.
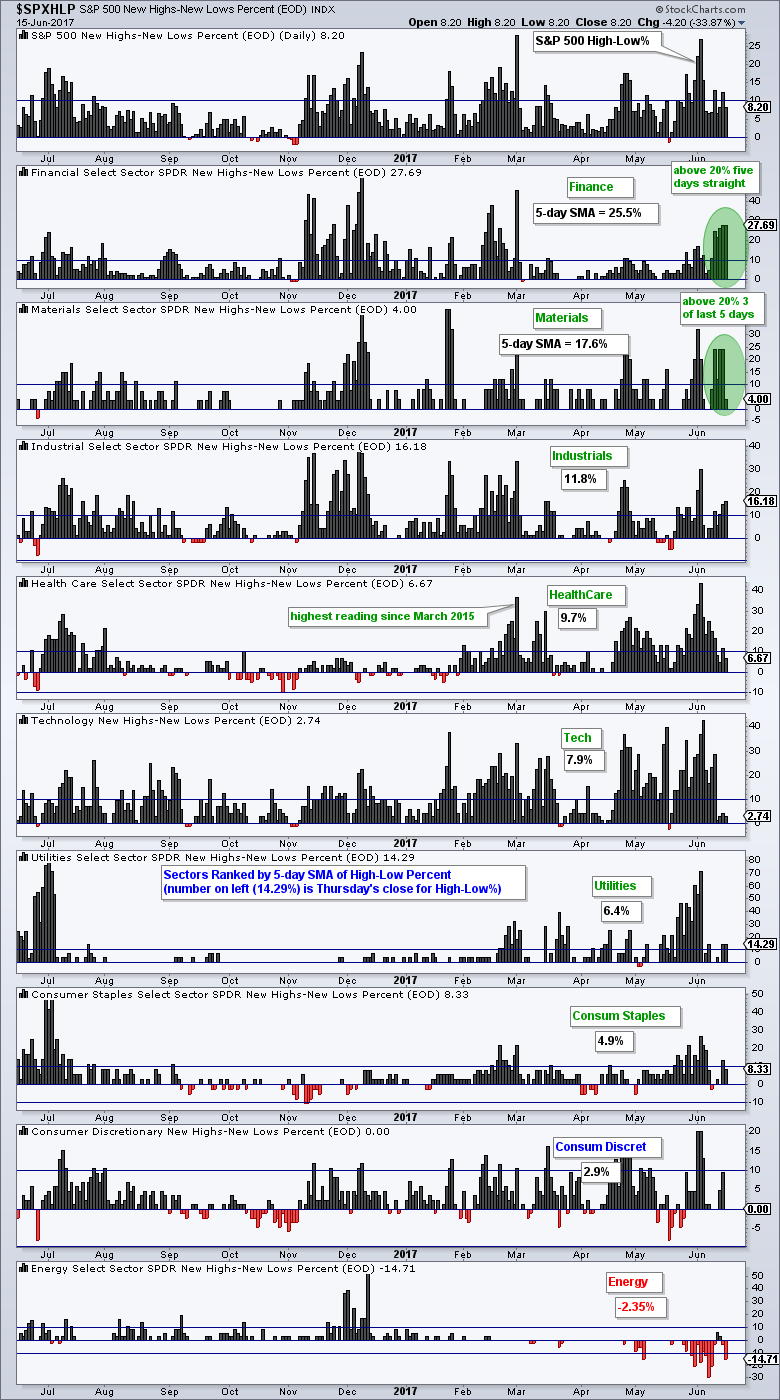
Finance and Materials Lead New High List
There was a changing of the guard over the last few weeks and we can see that by dissecting High-Low Percent for the sectors. Technology and utilities were leading the new high list on June 2nd, but this changed recently as finance and materials surged to the forefront. The table below comes from a scan. I scanned the High-Low Percent symbols and ranked this indicator by the 5-day SMA. Notice that over 25% of stocks in the finance sector hit new highs this past week. Materials, industrials and healthcare are the other three leaders this week.
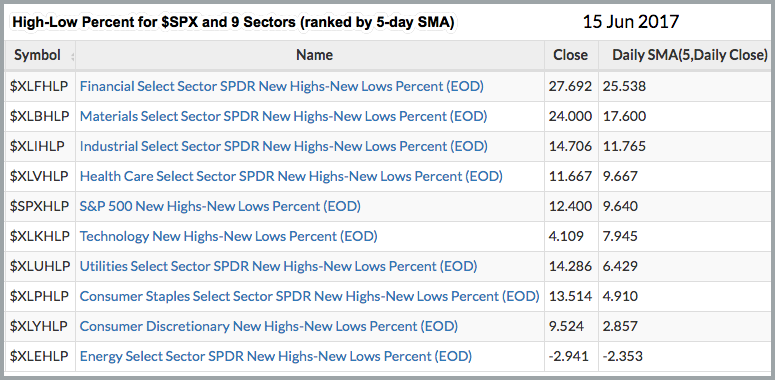
The next chart shows High-Low Percent for the S&P 500 and the nine sectors. The sectors are sorted by the 5-day SMA of High-Low Percent, which is shown under the sector name. Finance and materials surpassed the 20% level several times over the last five days. Industrials were also strong this week as High-Low Percent exceeded 15% twice. High-Low Percent for the next five sectors dipped this past week. Notice how elevated High-Low Percent was in early June. This shows less strength in the indicator, but I would not turn bearish unless we start to see an expansion of new lows. Note that XLE High-Low% ($XLEHLP) is the only one in negative territory and XLY High-Low% ($XLYHLP) is the least strong of the other eight.
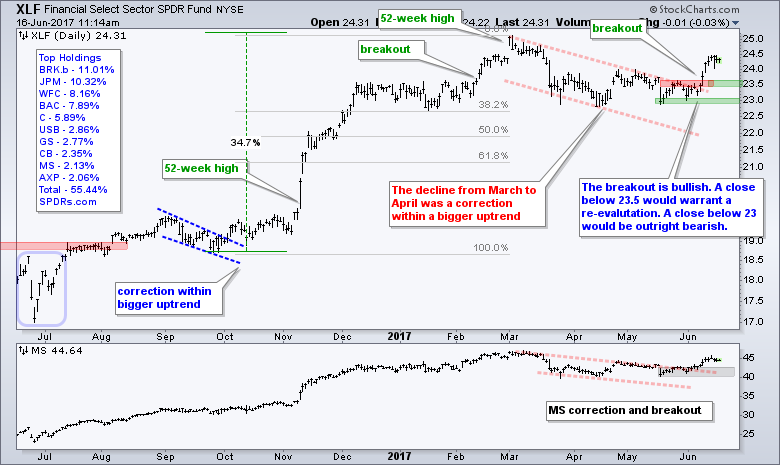
Finance and Regional Bank SPDRs Hold Breakouts
The Finance SPDR (XLF) turned up last week and reversed its correction with a strong move above 24. The breakout zone around 23.5-23.7 is the first area to watch for a failed breakout. I am setting key support at 23 and a break below this level would be outright bearish. The indicator window shows Morgan Stanley (MS) breaking out as well. The gray zone marks the support zone to watch and a close below 40 would be bearish.
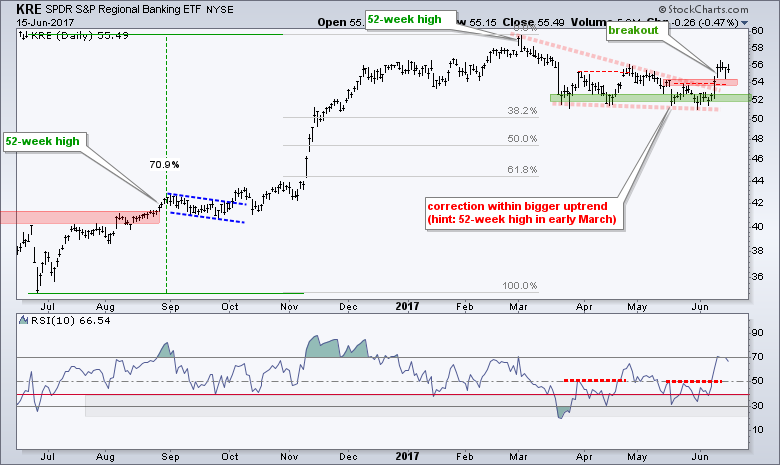
 The Regional Bank SPDR (KRE) also broke out with a surge above 54. The three month decline from early March to early June was viewed as a correction because of the 52 week high and the need to retrace a portion of the massive advance from late June to early March. The wedge breakout ends this correction. While a close back below 54 would be a concern, I would not dismiss this breakout unless KRE closes below 52.
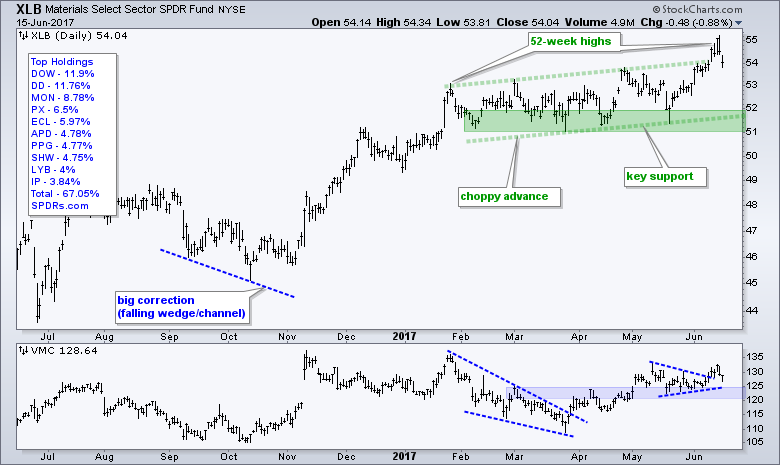
Chemicals Lead Materials SPDR to New High
Even though the Metals & Mining SPDR (XME), Steel ETF (SLX) and Copper Miners ETF (COPX) are performing poorly, the Materials SPDR (XLB) remains strong and hit a 52-week high this week. The big chemical stocks are driving this sector SPDR higher (DOW, DD, MON).
XME, SLX and COPX Break Short-term Consolidations
As with XLF and KRE above, the XME, SLX and COPX were on my list for possible breakouts that would end their corrections, which started in mid February. All three bounced from late May to early June and then broke short-term supports with sharp declines the two days. These breaks signal continuations of the immediate downtrends. XME broke the rising wedge line, SLX broke triangle support and COPX broke rising flag support. In short, it was a most ugly weak for these three. The red zones mark the key resistance levels to watch for correction-ending breakouts.
XLI Hits New High with Help from Old Friend
The Industrials SPDR (XLI) got some help from an unlikely component this past week and surged to a new high on Thursday. GE, which hit a 52-week low in May, gapped higher after Jeff Immelt announced he was stepping down. How's that for a message?! On the price chart, XLI sports a clear uptrend this year with support marked in the 64-65 area. The lower window shows UPS finally breaking out and leading the last four weeks.
XLV Extends on Triangle Breakout
New highs in JNJ, ABBV, UNH, the Biotech SPDR (XBI) and HealthCare Providers ETF (IHF) powered the HealthCare SPDR (XLV) to a new high this week. As with most sectors and groups these days, there are pockets of weakness to be found. However, the pockets of strength are stronger than the pockets of weakness and that is all that matters. After hitting a 52-week high in March, XLV consolidated with a triangle and broke out in late May. The May low and a buffer mark support in the 74-75 area.
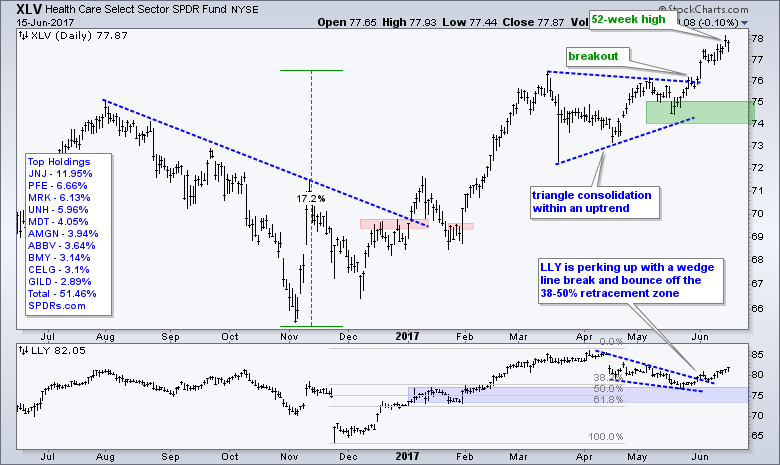
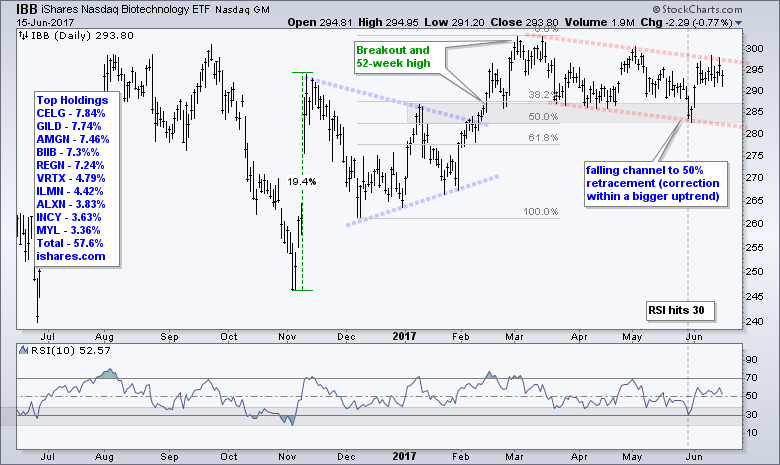
IBB Stalls below Resistance
The Biotech iShares (IBB) is one to watch because its big biotech components dominate and these large-caps also influence XLV (CELG, GILD, AMGN, BIIB, REGN...). IBB remains in corrective mode because it peaked in March and fell the last three months. The decline retraced 38-50% of the prior advance and IBB surged off the breakout zone in early June. Now we need to see follow through with a break above the June highs.
XLK and the Five Tech ETFs Hit Support Zones
The Technology SPDR (XLK) and its industry group ETFs are at interesting junctures: short-term oversold and near first support. The first windows show XLK, the Internet ETF (FDN), the Software iShares (IGV) and the Cloud Computing ETF (SKYY) hitting new highs in early June and falling to their mid May lows on Friday-Monday. These green zones mark support and pave the way for an oversold bounce. Small pennants could be forming so chartists should watch Thursday's low for signs of weakness. Closes below these lows would break pennant supports and signal a continuation of the Friday-Monday declines.
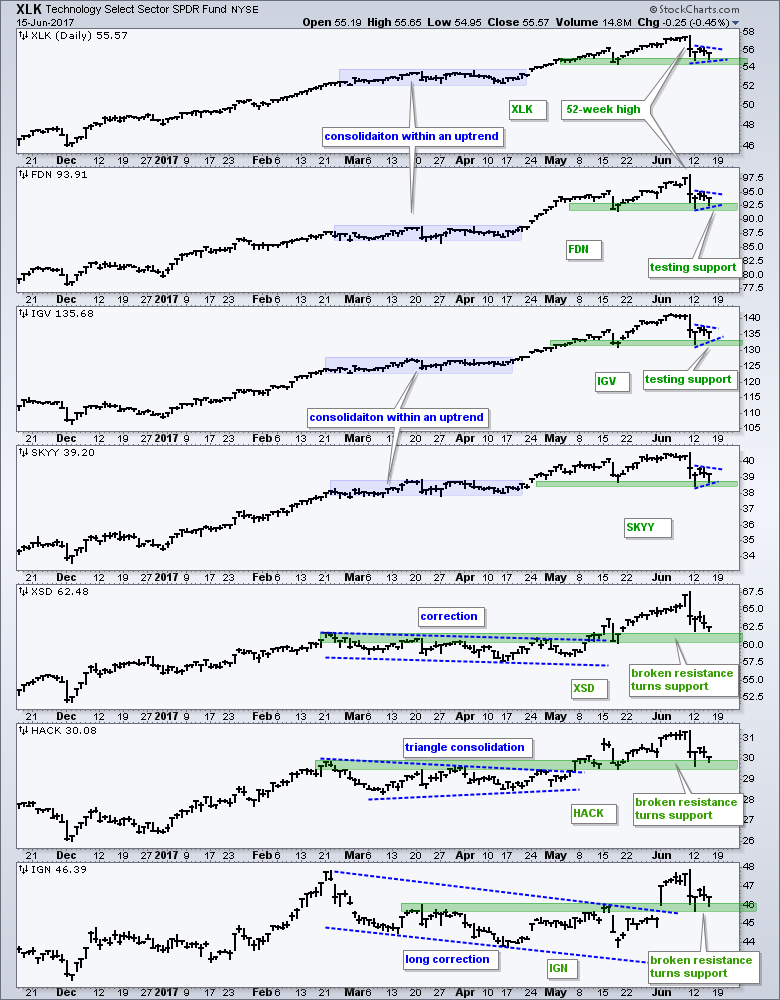
The lower three windows show the Semiconductor SPDR (XSD), Cyber Security ETF (HACK) and Networking iShares (IGN) breaking out and falling back to their breakout zones. These breakouts zones turn into the first support levels to watch for a bounce.
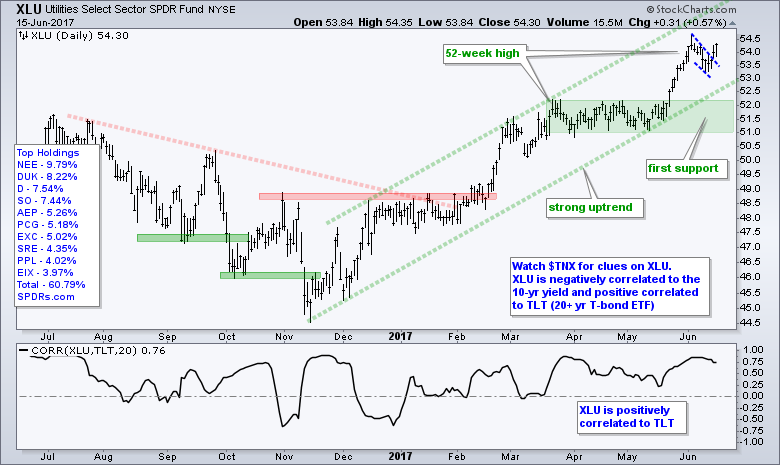
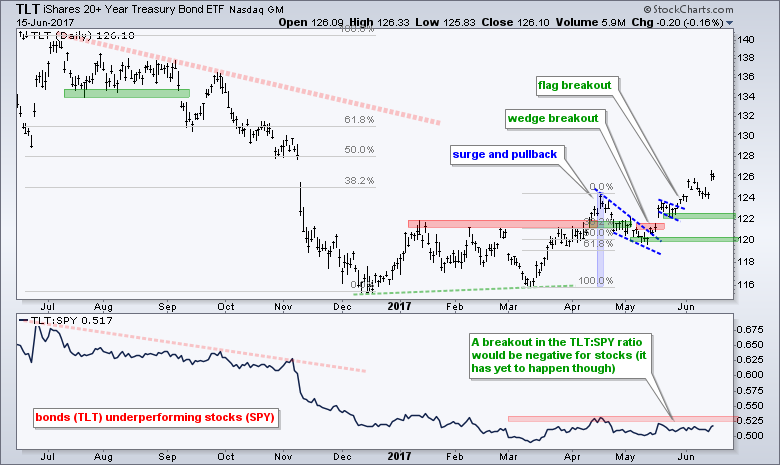
Utilities Follow Bonds Higher
The Utilities SPDR (XLU) is still one of the stronger sectors because it hit a 52-week high in early June and reversed its small pullback this week. XLU continues to attract money as a bond-proxy. The indicator window shows the Correlation Coefficient (TLT,XLU) in positive territory for most of the past year. This means XLU moves in the same direction as TLT (or counter to the 10-yr T-Yield ($TNX)). I remain bullish on TLT and this reinforces the bullish stance on XLU.
T-bond ETFs Hit New Highs (for some reason)
The 7-10 YR T-Bond ETF (IEF) and the 20+ YR T-Bond ETF (TLT) hit new highs for 2017 and remain in uptrends. This means the 10-yr T-Yield ($TNX) remains in a downtrend because yields move opposite bonds. The flag breakouts in late May held and the flag lows mark first support, which is still a ways away.
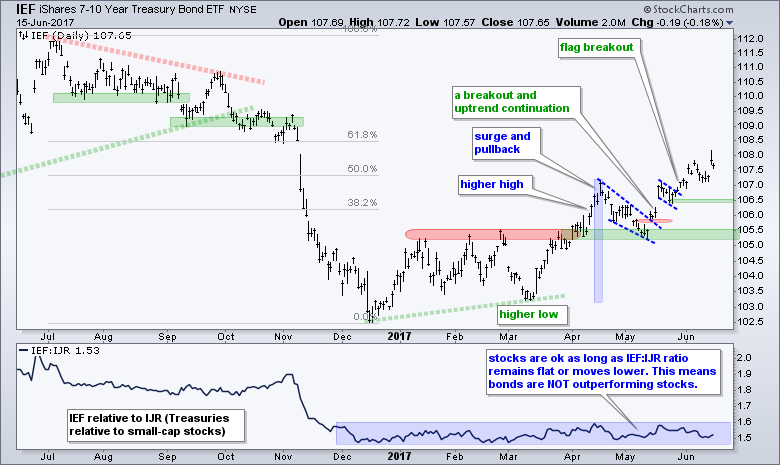
As noted before, I am a bit concerned because the bond market is sending a message of disinflation, weak economic growth or both. We can certainly see signs of disinflation in oil and the economic data has been quite soft lately. The concern, however, would not become a negative for stocks unless the IEF:IJR ratio turns up and bonds start outperforming stocks.
GLD Nears Potential Reversal Zone
The Gold SPDR (GLD) fell back this week as the Dollar edged higher. Overall, GLD remains in an uptrend since mid December. This advance could be one big counter-trend bounce because it retraced 61.8% of the July-December decline. Nevertheless, the bigger trend is up and the May low marks key support at 116.
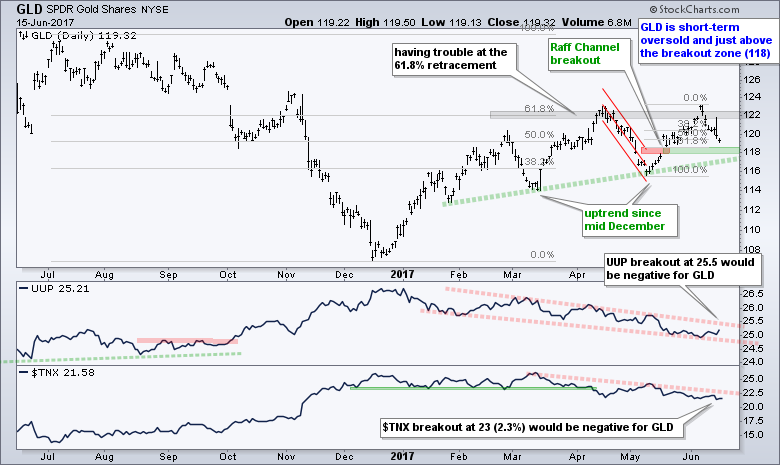
GLD is at an interesting juncture within this uptrend. Notice that the ETF retraced 61.8% of the May-June surge with the decline back to the 119-120 area. In addition, the breakout zone around 118 turns into a potential support zone. Thus, the 118-119 area could pave the way for a bounce after this pullback. Again, watch the Dollar and 10-yr T-Yield ($TNX) for clues.
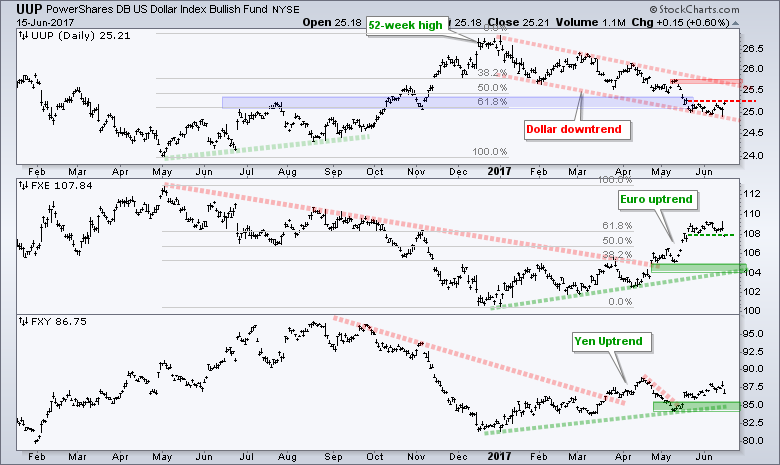
Dollar Firms at Potential Reversal Zone
The US Dollar ETF (UUP) is in a clear downtrend this year, while the Euro ETF (FXE) and the Yen ETF (FXY) are in clear uptrends. However, as noted over the last few weeks, UUP hit a potential reversal zone in late May and stalled around 25. The reversal zone stems from broken resistance and the 61.8% retracement. If the big trend is up and this is a correction, then I would expect a reversal in the 25 area. Look for a surge off this level and a short-term resistance breakout for the first sign. A follow through breakout at resistance (25.8) would reverse the overall downtrend.
******************************************************
ETF Master ChartPack - 300+ ETFs organized in a Master ChartList and in individual groups.
Follow me on Twitter @arthurhill - Keep up with my 140 character commentaries.
****************************************
Thanks for tuning in and have a good day!
--Arthur Hill CMT
Plan your Trade and Trade your Plan
*****************************************


