 |
.... Does the VIX Add Any Value? |
Does the VIX Add Any Value?
The S&P 500 Volatility Index ($VIX) is quite popular as an "indicator", but I am not sure if it offers any real value to the analysis process or to trading. First, the VIX is a coincident indicator that moves counter to the S&P 500. It rises when the S&P 500 falls and falls when the S&P 500 rises. Second, its range varies over time, as does the general level of volatility in the market. As with the S&P 500, the VIX is a moving target and it is hard to identify true extremes.
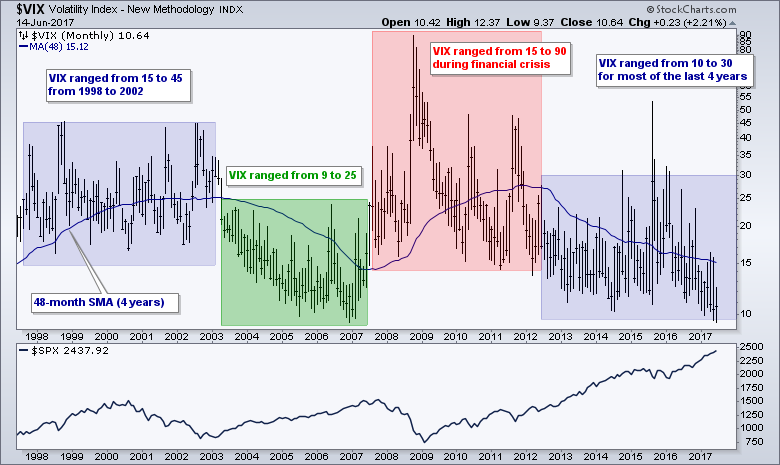
The chart above shows the VIX ranging from 10 to 90 over the last twenty years. I added a 48-month moving average to get an idea of a smoothed range, which is 15 to 30. Notice that the VIX traded in a high range from 1998 to 2002 and then a lower range during the bull run from 2003 to the middle of 2007. The VIX then surged with the financial crisis and remained elevated until 2012. There were some spikes over the last four years, but the indicator has ranged from 10 to 30 for the most part, which is a relatively low range.
Despite my misgivings, I put the VIX through the backtesting wringer to see if there were any decent signals. There are some systems with positive expectancy and these can help with short-term market timing, but the VIX systems do not perform as good as the golden cross or a basic RSI mean-reversion system. Thus, the added value is questionable.
Setting the Benchmark
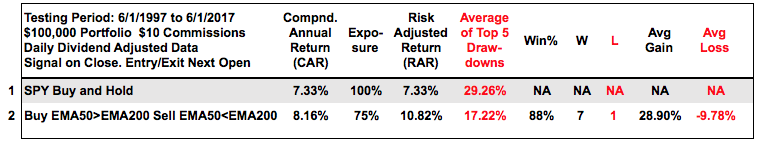
The VIX systems below will trade the S&P 500 SPDR (SPY) so SPY will be the benchmark using buy-and-hold and the golden cross. The table below shows buy-and-hold returning 7.33% per year with an average drawdown of 30% over the last 20 years. Note that I am using the average of the top five drawdowns. Buying when the 50-day EMA crosses above the 200-day EMA and selling when the 50-day EMA crosses below the 200-day EMA beat buy-and-hold and reduced the drawdown. The SPY golden-cross system returned 8.16% per year with an average drawdown of 17.22%. Good luck beating those numbers!
System Ground Rules
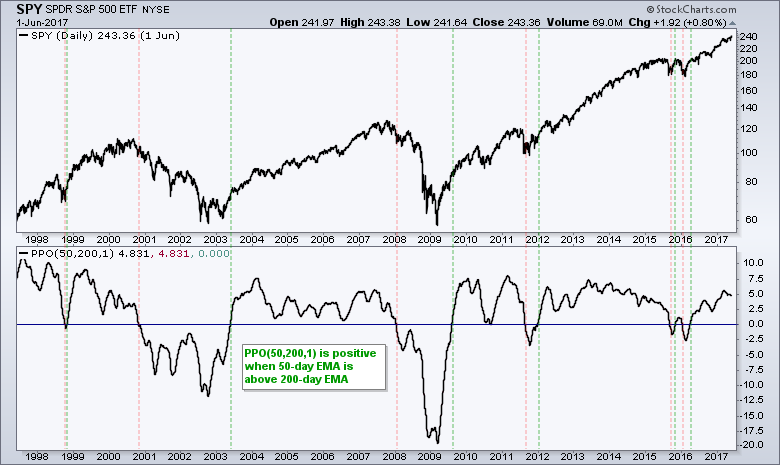
- Bull market: Only long positions are considered and positions are only considered when SPY is in a long-term uptrend (50-day EMA above the 200-day EMA).
- Timeframe: The testing period runs from 1-June-1997 to 1-June-2017, which is twenty years. The system starts in the middle of a bull run (1997), and there were two bear markets and two bull markets afterwards.
- Portfolio Size: The portfolio begins at $100,000 and commissions were set at $10 per trade.
- EOD System: Buy-Sell signals were based on closing prices, while the entry and exit prices were based on the next open. Thus, this is an end-of-day (EOD) system.
- Profit Target: The last system included a profit target that resulted in an immediate exit when hit, which was usually during the trading day.
Consulting, Software and Data
Cesar Alvarez of AlvarezQuantTrading.com provided feedback for the code and system development. Cesar has a great blog and provides consulting services for system development (click here). I used Amibroker to test the code and Premium Data from Norgate. Just like StockCharts, the data is adjusted for dividends to reflect the total return.
Normalizing the VIX with the PPO
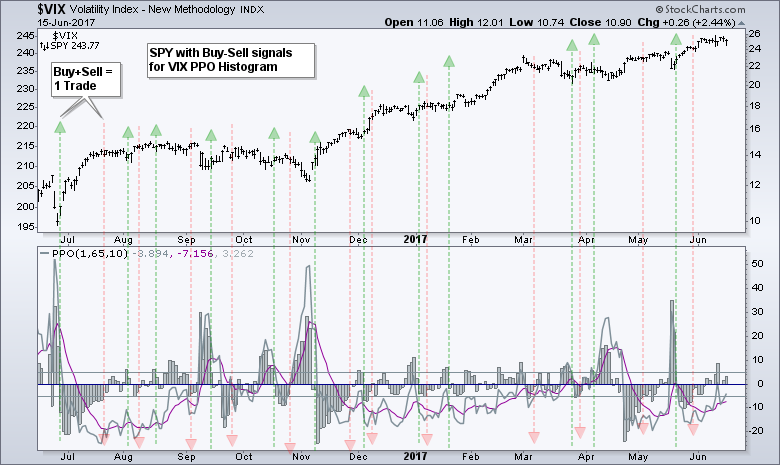
I tested several VIX levels to look for the "best" extremes, but did not find anything worthwhile. This is probably due to the big range over the last twenty years. I also normalized the VIX to look for extremes relative to an exponential moving average. Namely, how far above or below is the VIX from its 65-day EMA (3 month EMA). This can be done by charting the PPO(1,65,1) of the VIX. The chart below shows the VIX with the PPO(1,65,1) and SPY.
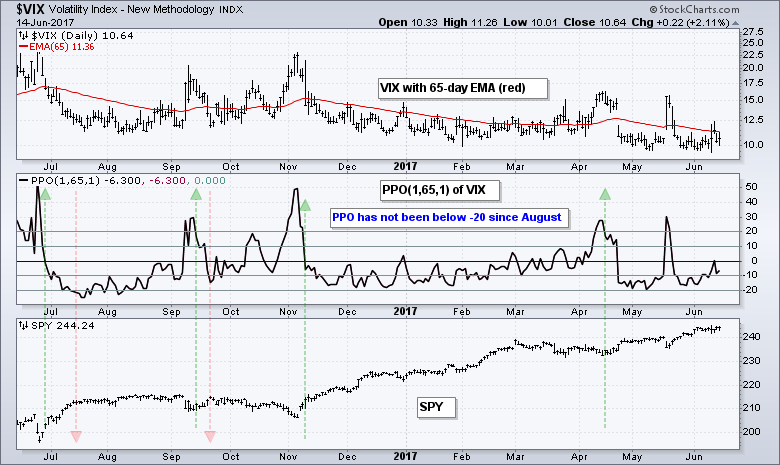
A visual inspection suggests that the VIX hits an upside extreme when the PPO exceeds +20 and a downside extreme when it exceeds -20. The green arrows show when the PPO moves back below 20 and the red arrows show when it moves above -20. There were four buy signals over the past year and two sell signals. Note that the PPO has not been below -20 since August 2016, almost a year ago.
Testing Different PPO Extremes
Let's now look at some different PPO extremes using a 20-yr backtest. Note that a buy signal triggers when the VIX PPO crosses below the upper extreme. This ensures that the VIX hit an extreme and is turning back down. A sell signal triggers when the VIX PPO moves above the lower extreme. This ensures that the VIX hit an extreme and is turning back up. The first two results use 20/-20, and 10/-10 for extremes. Notice that the number of trades increased as I tighten the extremes from 20/-20 to 10/-10 and the average gain/loss decreased. This is expected because the latter is a more active system with more signals.
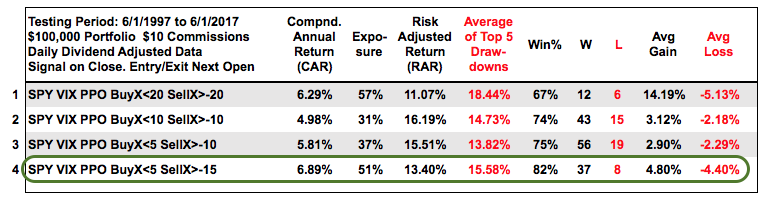
I experimented with many different combinations and even optimized the EMA periods for the PPO as well as the buy-sell levels. One of the best results came from buying a VIX PPO cross below 5 and selling a VIX PPO cross above -15. Be careful with optimization because the future does not always turn out like the past. In any case, the high win% for each system makes it clear that traders are better off buying when the VIX is moving down after hitting an upside extreme and selling when the VIX is moving up after hitting a downside extreme.
Testing with the VIX PPO Histogram
The PPO is a momentum indicator and the PPO Histogram measures the momentum of momentum, which can be called velocity. This next test will use the PPO-Histogram (1,65,10) for signals. This PPO-Histogram measures the difference between the PPO and its signal line, which is the 10-period EMA of the PPO. A buy signal triggers with a move below 5 and a sell signal triggers with a move above -5. The chart below shows the trades over the past year. It is clearly an active system designed for short-term traders.
 The table below shows the results for 167 trades over a 20 year period. The system was exposed (in a trade) 41% of the time so this means there were 167 trades in 8.2 years (41% of 21 years). The Compound Annual Return (CAR) was 7.07% and the Risk-adjusted Return (RAR) was 17.43%. The RAR is higher because the system was not always exposed to the market (risk). Notice that the Win% is around 70% and the average drawdown was around 12%. This is pretty good overall.
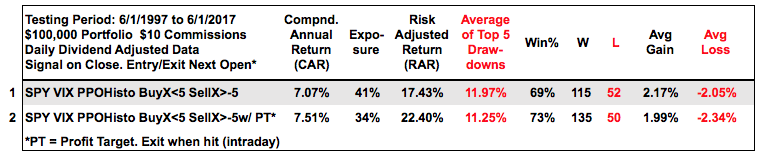
I tested these systems with a variety of trailing stops and stops hurt system performance. Stop-losses can work wonders on a few trades, but they generally do not help when looking at 100+ trades. The second test above includes a profit target of 3% and this improved overall performance. Notice that the CAR was higher and the average Drawdown was lower. In an interesting twist, however, the average gain fell and the average loss increased.
Conclusions and Caveat Emptor
The VIX appears to work best as a mean-reversion type indicator and can help for short-term market timing. The VIX surges when SPY plunges and this creates a short-term buying opportunity. The VIX plunges when SPY advances and this creates a short-term selling opportunity. Keep in mind that these are long-only systems that only trade when the 50-day EMA of SPY is above the 200-day EMA. Thus, chartists should consider bullish stock setups when VIX is near upside extremes and, perhaps, exit strategies when the VIX is near downside extremes. I would not consider shorting the market when the long-term trend is up. Note that it is important to wait for the VIX to turn from an extreme because the VIX can hit an extreme and remain at extremes during strong market moves.
Past performance does not guarantee future performance!!
******************************************************
Thanks for tuning in and have a good day!
--Arthur Hill CMT
Plan your Trade and Trade your Plan
******************************************************
Other Articles in the SystemTrader Series:
- Introduction to Key Performance Metrics - Quantifying the Golden Cross for the S&P 500
- Golden Cross and 5 Major Indexes - EMAs versus SMAs - Do Short Positions Add Value?
- Setting up Momentum Scans, Creating ChartLists and Exporting Lists. - Differences in Major Indexes - Do Trend Filters Work?
- MACD Crosses - Rules to Reduce Drawdowns and Increase Gains - Testing PPO Strategy âÂÂÂÂÂÂÂÂÂÂÂÂÂÂÂÂÂÂÂÂÂÂÂÂ
- Follow me on Twitter @arthurhill - Keep up with my 140 character commentaries.


