 |
.... New Highs Expand in Large-caps and Mid-caps .... EW S&P 500 Reflects Broad Strength .... SPY Hits another New High .... QQQ Extends its "Overbought" Streak .... Small-caps and Mid-caps Perk Up .... New highs in XLY, XLK, XLI, XLV, XLU and XLP .... Good Weekend Stocks Lead XLY to New High .... XLI Hits New High without GE .... Utilities and Staples Lead Two Week Surge .... Strong Downtrend for Energy ETFs (plus oil) .... XLF Lags, but is Not that Weak .... First Republic Bank Goes for Breakout .... Industry Focus: Biotechs, Metals & Mining and Coal .... TLT Extends Advance with Flag Breakout .... Gold Follows TLT Higher .... UUP Stalls Near Key Fibonacci Level |
----- Art's Charts ChartList - 30 Industry Group ETFs (updated 2-June) -----
New Highs Expand in Large-caps and Mid-caps
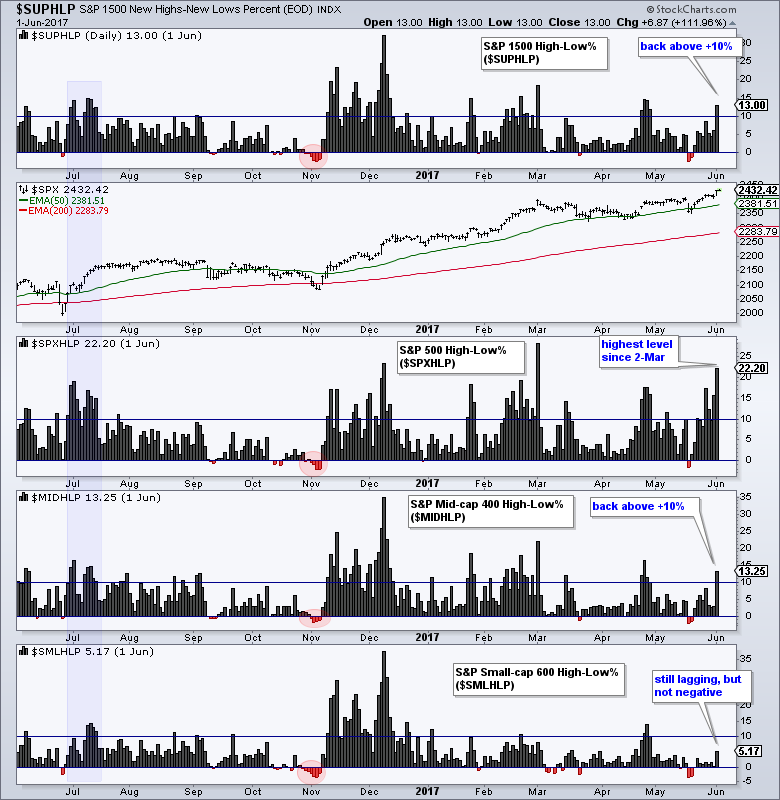
A lot of stocks were obviously close to new highs because the High-Low Percent indicators surged on Thursday. It is fair to say that a stock hitting a new 52-week high is in a long-term uptrend. The chart below shows High-Low Percent for the S&P 1500, S&P 500, S&P Mid-Cap 400 and S&P Small-Cap 600. Notice that S&P 1500 High-Low Percent ($SUPHLP) moved above 10% for the first time since late April and S&P 500 High-Low% ($SPXHLP) hit its highest level (22.2%) since March 2nd. Over 20% of stocks in the S&P 500 hit new highs this week and this affirms the overall uptrend for the market benchmark. S&P 400 High-Low% ($MIDHLP) also managed to exceed +10%, but S&P 600 High-Low% ($SMLHLP) continues to drag its feet and remain below +10%.
EW S&P 500 Reflects Broad Strength
The S&P 500 SPDR (SPY) and Nasdaq 100 ETF (QQQ) hit new highs again this week and continue to lead the market. Despite large-cap leadership, note that the EW S&P 500 ETF (RSP) also hit a 52-week high and remains in a long-term uptrend. Thus, the current stock market advance is NOT that narrow and participation is clearly broad enough.
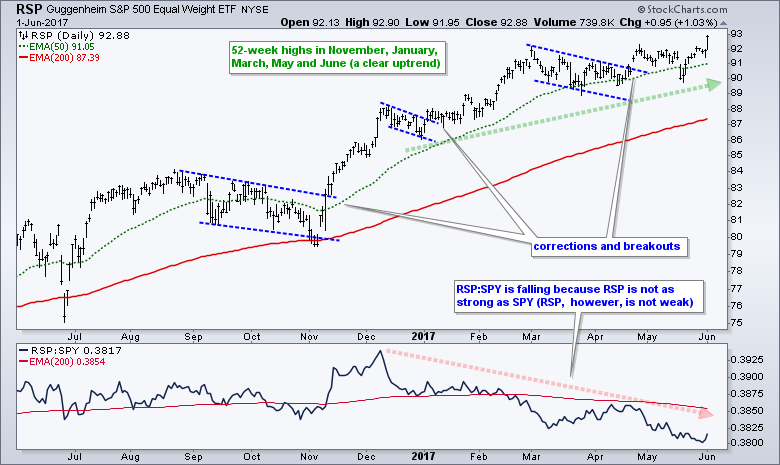
The RSP:SPY ratio chart highlights a pet peeve I have with ratio charts. Ratio charts are good when picking between two assets, but they do not tell the entire story and they do not always reflect the trend of the underlying asset. RSP advanced from December to early June and the price relative (RSP:SPY ratio) fell. RSP, however, is by no means weak. It is just "less" strong than SPY. The fact that RSP hit a new high reinforces broad market strength and I do not think the falling price relative detracts from this new high. Price overrules all!
SPY Hits another New High
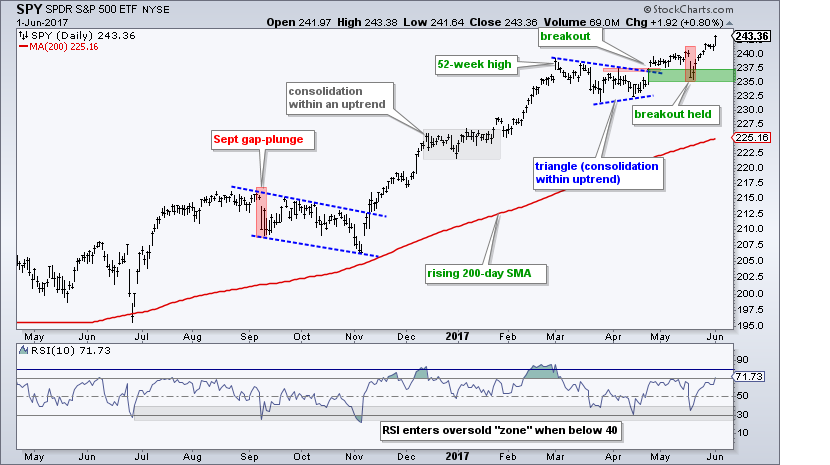
The S&P 500 SPDR (SPY) gapped down on May 17th and fell 1.8%, and then surged to a new high over the last two weeks. Such is life in a strong uptrend. The triangle breakout zone turned into a support zone and held. With this successful test, I will keep first support in the 235-237 area. A close below 237 would break support and provide the first sign that a long awaited correction is unfolding. Until such a break, the bears do not have a leg to stand on. At the risk of getting into a narrative (excuse), I suspect that Thursday's surge is new money coming into the market at the beginning of the month. This does not detract from the surge, but it does suggest that the market could soften or pullback next week.
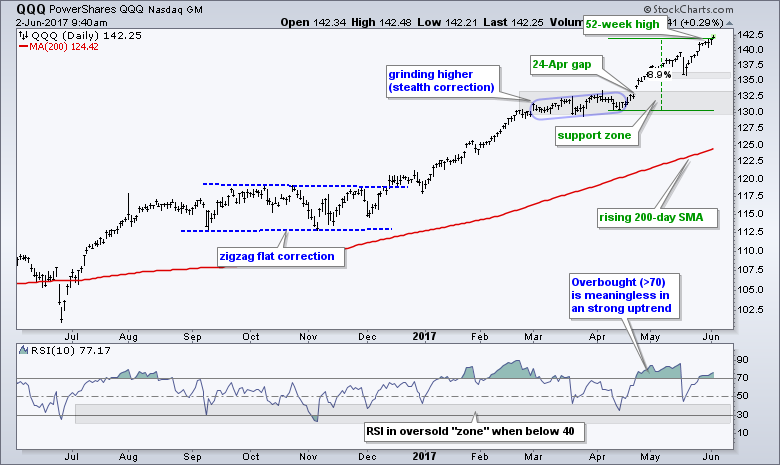
QQQ Extends its "Overbought" Streak
QQQ is now up around 9% from mid April to early June (33 trading days). Notice that RSI(10) spent more time above 70 than below 70 during this timeframe. Once again, we are seeing just how worthless an overbought reading is in an uptrend. Sure, you can find overbought readings that mark tops, but the majority of overbought readings in an uptrend are not tradable. In contrast, oversold readings within an uptrend are not worthless. An oversold reading within an uptrend alerts traders to a correction within the uptrend and represents a potential opportunity.
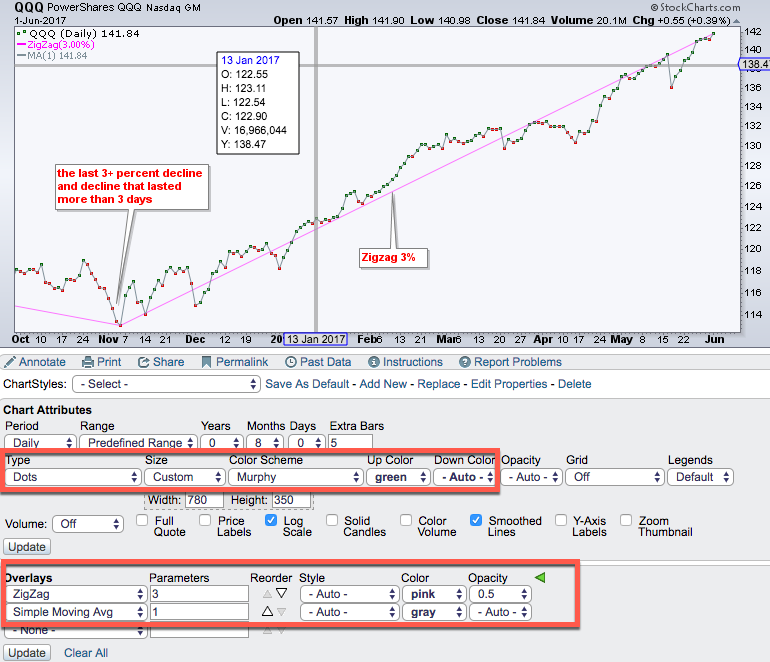
 Just how strong is this uptrend in QQQ? The chart below shows red dots for down days, green dots for up days and the Zigzag (3%) in pink. QQQ has not declined more than 3% and has not been down more than 3 days in a row since early November, 142 trading days and counting. The image below shows the SharpChart settings I used to create this chart.
Small-caps and Mid-caps Perk Up
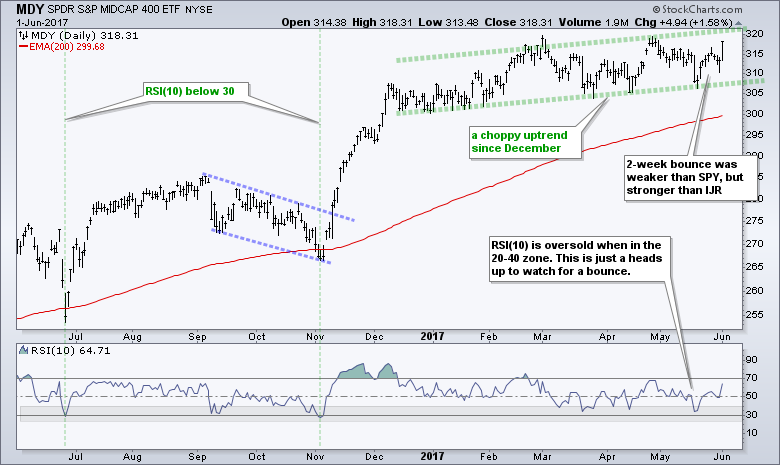
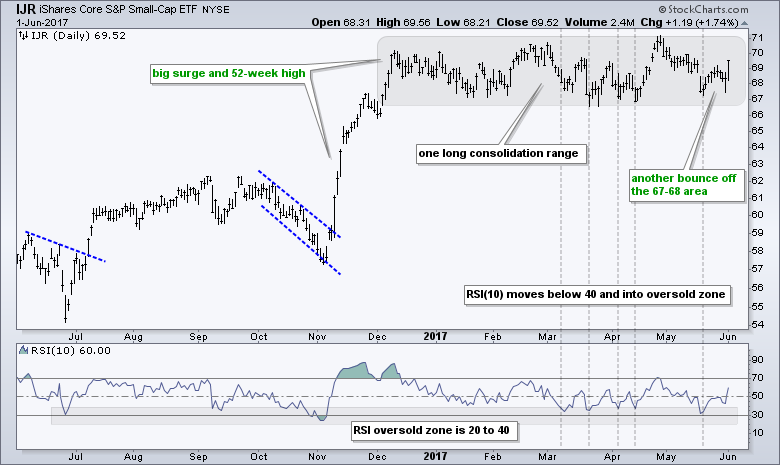
The S&P MidCap SPDR (MDY) and S&P SmallCap iShares (IJR) led the market with Thursday's bounce, but this bounce does not change the overall picture. IJR remains within a large trading range and is now around 2.5% from a new high. MDY has been in a choppy uptrend since mid December and the ETF is around .5% from a new high. Even though these two are lagging SPY and QQQ, they cannot be considered weak when they are so close to new highs.
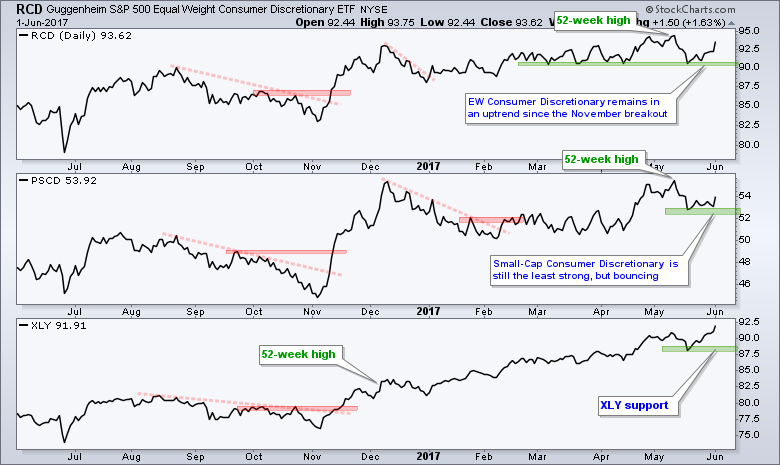
New highs in Six of Nine Sector SPDRs
The sector picture remains unequivocally bullish with six of the nine sector SPDRs hitting new highs this week (XLY, XLK, XLI, XLV, XLU, XLP). Together, these six sectors account for over 70% of the S&P 500. Six of the nine equal-weight sector ETFs also hit new highs, but not the same six. The Consumer Discretionary SPDR (XLY) hit a new high, but the EW Consumer Discretionary ETF (RCD) fell short. The Materials SPDR (XLB) did not record a new high, but the EW Materials ETF (RTM) did (on a closing basis). No matter how you slice it, there are more pockets of strength than weakness and this supports the bullish case for the broader market. Despite all the woes in retail, the chart below shows the EW Consumer Discretionary ETF and the SmallCap Consumer Discretionary ETF hitting new highs in mid May. The green zones mark first support and the levels to watch for a trend-reversing break down.
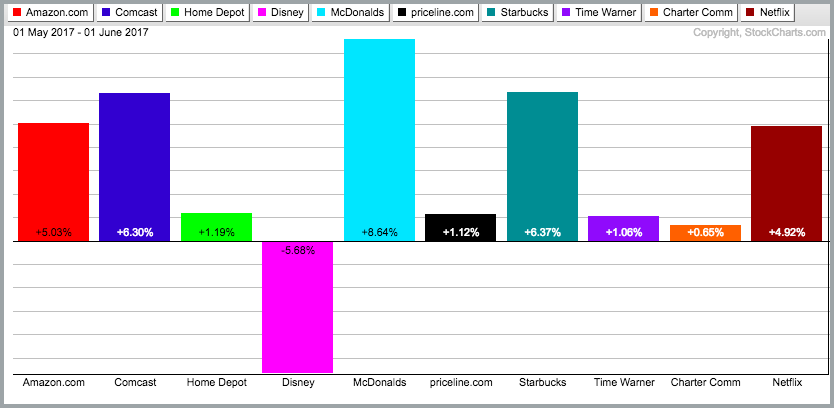
Weekend Stocks Lead XLY to New High
Led by AMZN, CMCSA, MCD, SBUX and NFLX, the Consumer Discretionary SPDR (XLY) surged to another new high this week. These five represent shopping, cable-internet, burgers, coffee and movies. Sounds like a good weekend to me! The PerfChart below shows these five with the biggest gains over the past month.
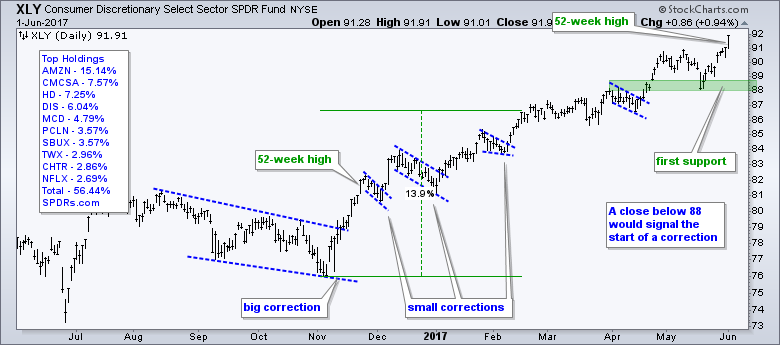
 XLY continues to stair-step higher since the November surge. Each high is higher than the other and each dip holds above the prior low. It is a classic uptrend with the mid May low marking first support.
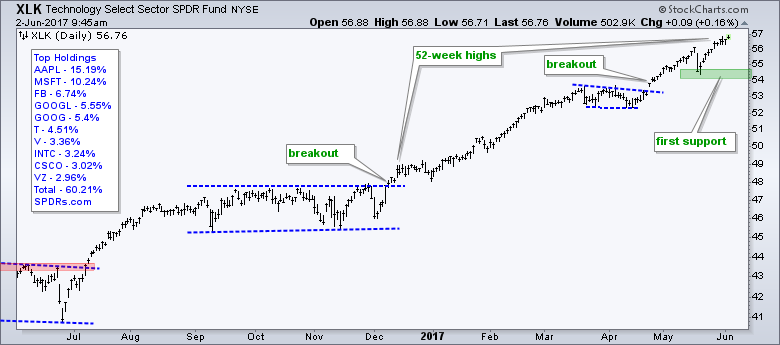
 The Technology SPDR (XLK) hit a new high and the mid May low marks the first support zone around 54-55. Note that the top four stocks account for must over 40% of the ETF (AAPL, MSFT, FB, GOOGL). With AWS, Amazon may have to change sectors in the future.
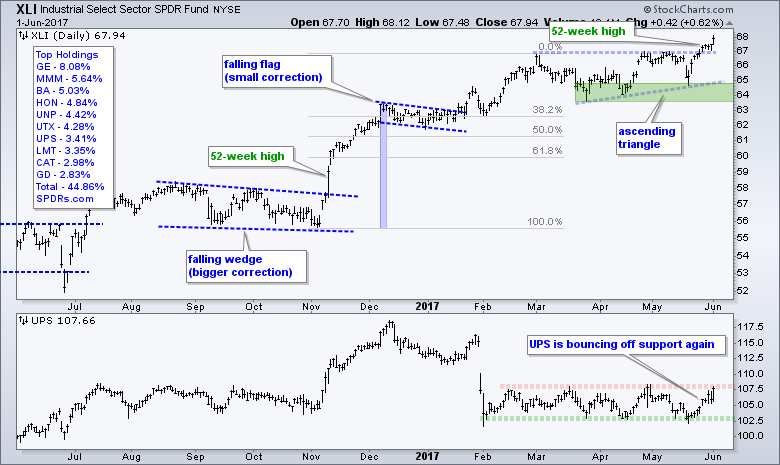
XLI Hits New High without GE
The Industrials SPDR (XLI) broke out last week and extended its breakout with a new high on Thursday. I would not consider a move back below 67 has a failure. Instead, it would just be a pullback after a 4% surge in two weeks. UPS also bounced off support and is again challenging range resistance. Also note that XLI is breaking out without the help of its largest component, GE, which is down around 4% since early May.
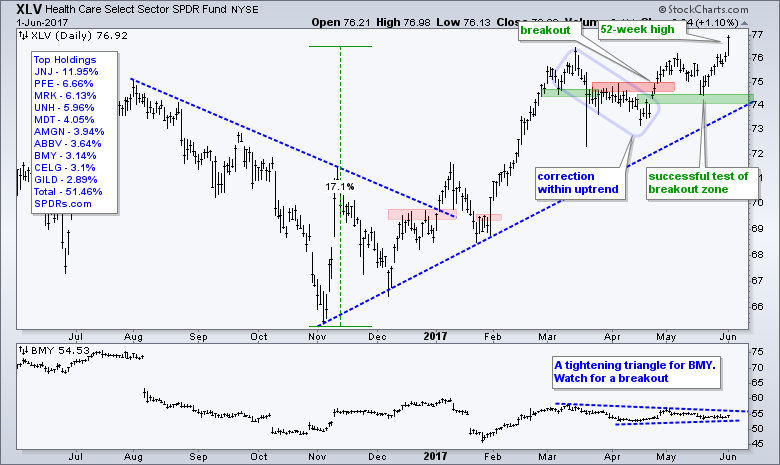
 The HealthCare SPDR (XLV) surged to a new high with a big move the last two weeks. This advance is simply building on the bigger uptrend since January and the correction-ending breakout in mid April. Key support remains at 74. MRK, PFE, LLY and ABT led the way this week and I am also watching BMY as it consolidates with a triangle (lower window).
Utilities and Staples Lead Two Week Surge
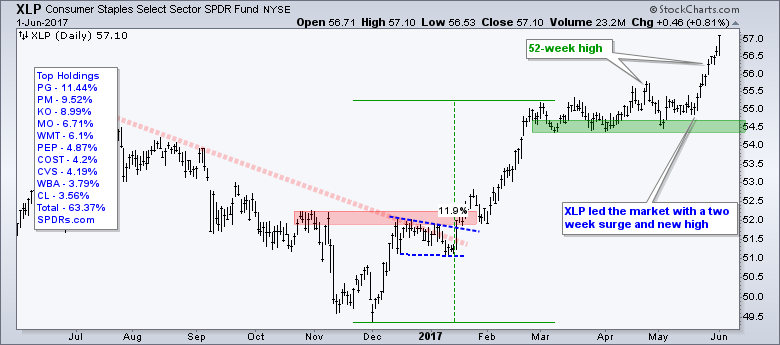
The Consumer Staples SPDR (XLP) surged off support the last two weeks with a 3+ percent gain. Note that six of the nine sector SPDRs were up more than 3% over the last ten trading days. It is not just XLU and XLP. The surge in XLP simply affirms the overall uptrend and support in the 54.50 area.
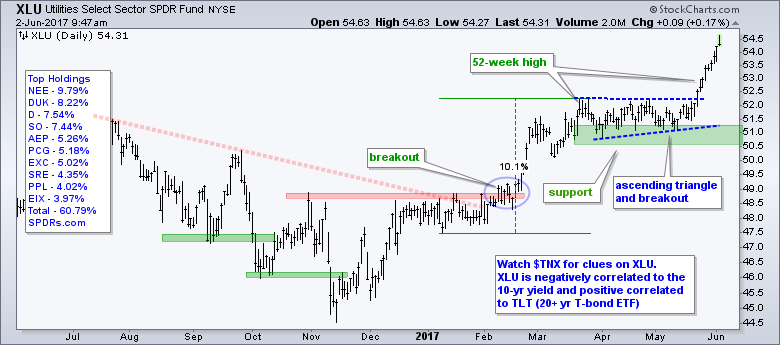
 XLU is the biggest winner over the last two weeks with a 4.5% surge in ten days. Again, this surge simply affirms the overall uptrend and support in the 50.5-51 area. XLU has been helped by strength in TLT so chartists should keep a close eye on T-bonds.
 The Materials SPDR (XLB) did not hit a new high, but it sure is close and the trend is up. XLB has been zigzagging higher since late January with a series of higher highs and higher lows. Key support remains in the 51-51.5 area. The indicator window shows Vulcan Materials (VMC) with a triangle forming and support in the 120-125 area.
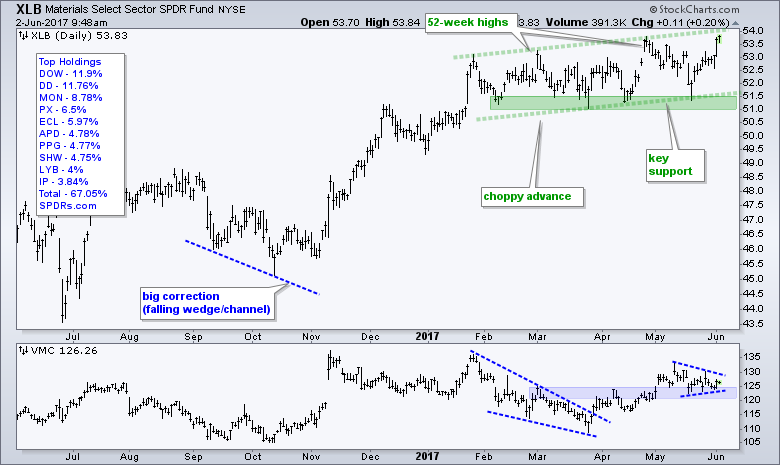
Strong Downtrends for Energy ETFs
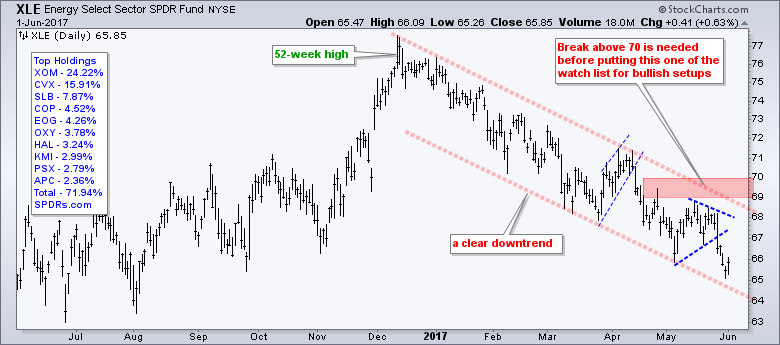
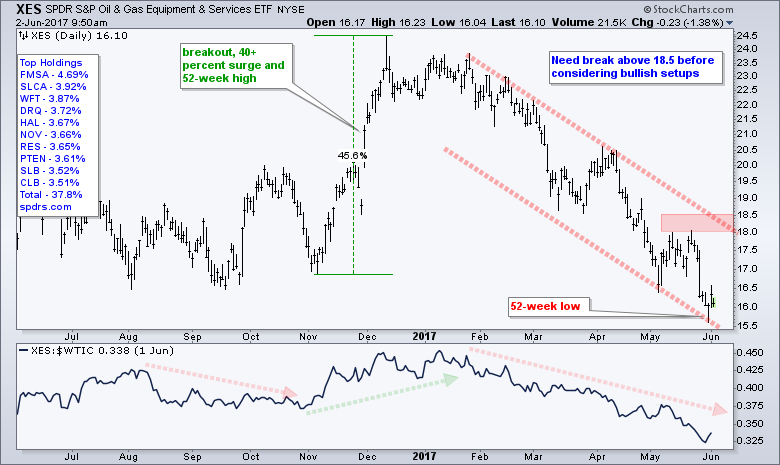
The Energy SPDR (XLE) is clearly the weakest of the sectors with a new low for 2017 this week. A falling channel emerged with resistance marked in the 69-70 area. The Oil & Gas Equip & Services SPDR (XES) hit 52-week lows this week and is also in a clear downtrend. It is tempting to call it oversold and a value play, but oversold is a worthless observation in a strong downtrend. A break above the red resistance zone (36-37) is needed to turn this downtrend around. Overall, there is no sense looking at energy-related stocks until XLE and XES break their resistance zones. Move along folks, there is nothing to see here.
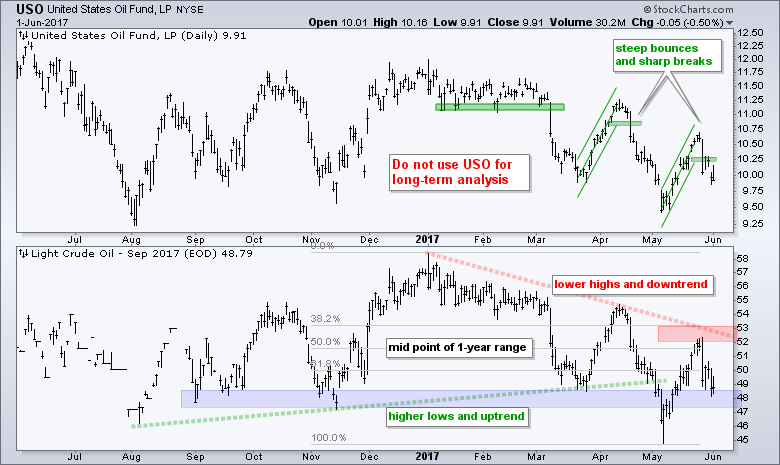
Oil in Clear Downtrend This Year
Oil is also in a downtrend this year and this is not helping energy-related shares. Chartists could make an argument for support in the 48 area, but there is no uptrend to speak of. The 2017 trend line and May high mark resistance in the 52-53 area.
XLF Lags, but is Not that Weak
The Finance SPDR (XLF) is the second weakest of the nine sector SPDRs this year, but I still view the three month decline as a correction within a bigger uptrend. Is three months a long time? Not for a correction after a 30+ percent advance. Notice that the ETF traded flat from early August to early November and that consolidation also represented a corrective period. XLF first pierced 23 in late March and bounced off the 23 area a few time since. There are signs of firmness (less selling pressure), but no breakout yet (increase in buying pressure). Look for a close above 24 to signal an end to the correction.
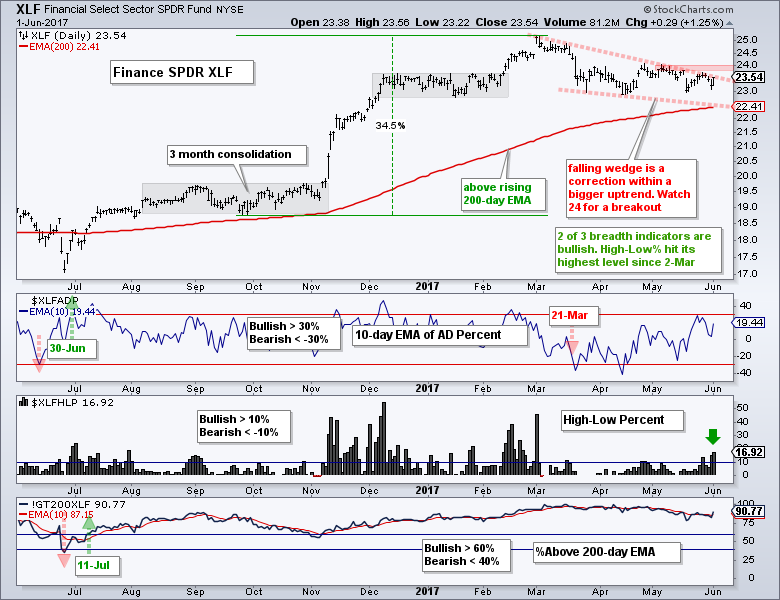 This chart also shows three breadth indicators: the 10-day EMA of AD Percent, High-Low Percent and %Above 200-day EMA. Two of the three remain on bullish signals. AD Percent triggered bearish with the move below -30% in mid March. The indicator has since rebounded with a pretty good move the last three weeks. Look for a move above +30% to show broad participation and trigger a bullish signal. I also noticed that High-Low Percent exceeded +15% and hit the highest level since March 2nd and the %Above 200-day EMA is above 90%. Thus, the finance sector is not all that weak.
Related Links: How to create a user-defined index (@GT200SUP).
Understanding the AD Percent Indicators, High Low Indicators and %Above 200-day EMA Indicators.
First Republic Bank Goes for Breakout
I do not watch CNBC or Bloomberg live, but I do scroll through their video list periodically and choose certain recorded segments. I usually tune into to Ari Wald CMT, Craig Johnson CMT, Craig Moffett, Tony Dwyer, Jonathan Krinsky CMT, Chris Verrone CMT, Jurrien Timmer, Jason Trennert, Tom Lee and Dick Bove. I recently watched Dick Bove shoot down the concept that bank earnings are dependent on interest rate levels and the yield curve. Bove's bottom line: Banks sell a product and loans are that product. The more loans they make (sell), the higher the earnings. Bove thinks that most banks are doing a bad job at selling loans. Video One (link) and Video Two (link).
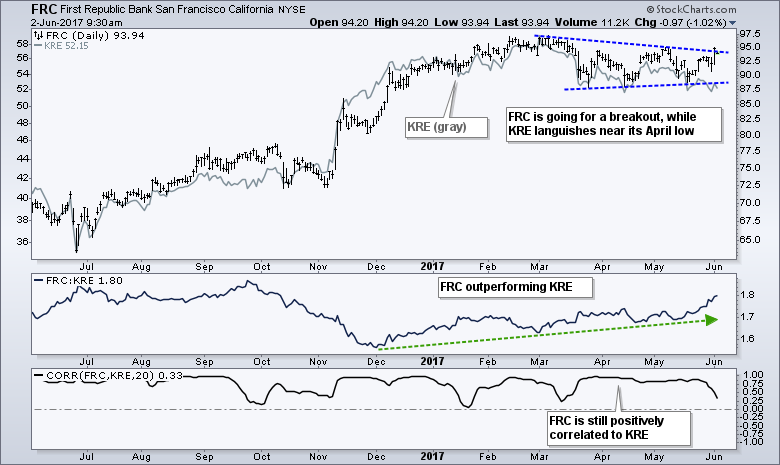
Bove noted that First Republic Bank of San Fran (FRC) shows innovation because they are lending to growth businesses. The chart is also interesting because FRC is breaking above the triangle line and leading KRE. The triangle looks like a consolidation within a bigger uptrend (52-week high in March). The FRC:KRE ratio turned up in December and moved higher the last six months, which shows relative strength. Even though FRC looks better than KRE, note that it is still highly correlated to the Regional Bank SPDR. The Correlation Coefficient (FRC,KRE) never dipped into negative territory and spent most of the past year above .50. Banks are highly correlated so it is unlikely any bank will escape the pull of its industry group or sector.
Industry Focus: Biotechs, Metals & Mining and Coal
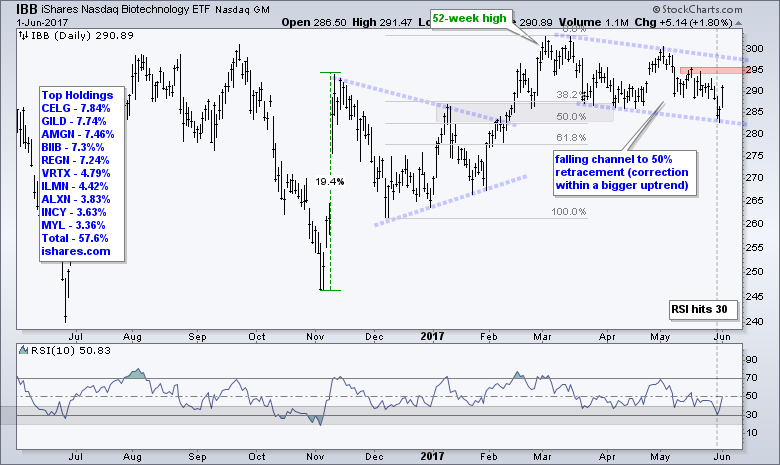
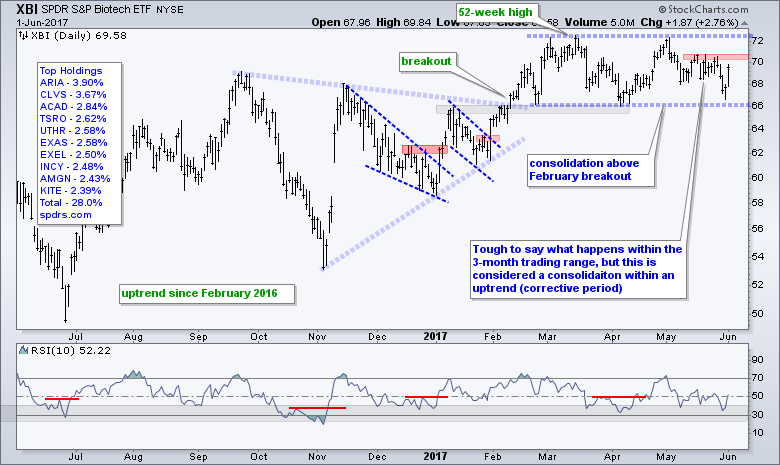
The Biotech iShares (IBB) and the Biotech SPDR (XBI) look kind of like the Regional Bank SPDR (KRE) with a correction (decline) over the last three months. IBB sports a falling channel and IBB is range bound. Both plunged on Monday-Tuesday and rebounded sharply on Wednesday-Thursday. I still expect an upside resolution to these corrections because the bigger trends are up. A break below 66 in XBI would call for a re-evaluation.
 The Metals & Mining SPDR (XME) remains at an interesting juncture (correction within an uptrend). Note that the three month correction retraced around 62% of the prior advance and formed a falling wedge. Look for a close above 30 to reverse the wedge and signal a continuation of the bigger uptrend. The Copper Miners ETF (COPX) and Steel ETF (SLX) sport similar patterns.
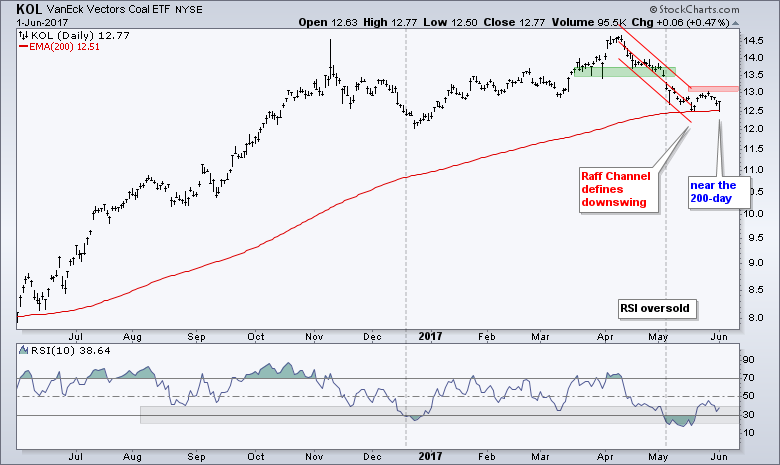
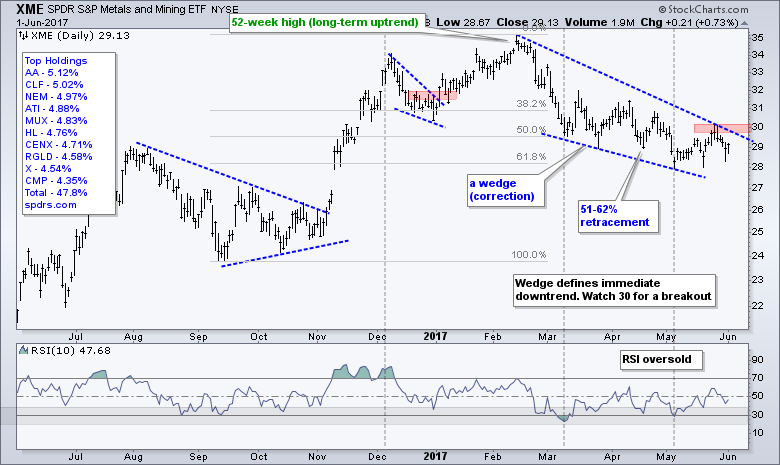 The Coal ETF (KOL) corrected from mid April to late May and firmed just above the 200-day EMA. The Raff Regression Channel defines the immediate downtrend with resistance at 13.20, a break of which would signal an end to the correction.
TLT Extends Advance with Flag Breakout
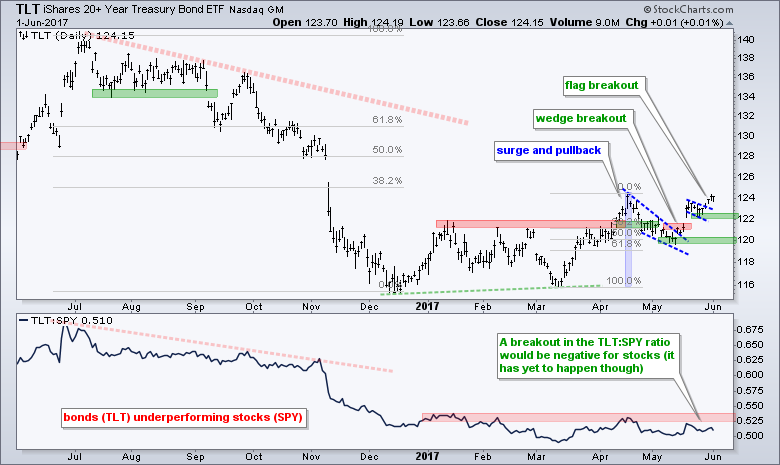
The 20+ YR T-Bond ETF (TLT) remains in an uptrend overall and extended this uptrend with a flag breakout on Monday. The flag low now becomes the first support level to watch at 122. Key support remains in the 120 area. I am concerned that bonds are saying one thing (economic weakness and/or inflation) and stocks are saying another (economic strength), but TLT has yet to start outperforming SPY. Put another way, SPY has yet to start underperforming TLT. The indicator window shows the TLT:SPY ratio remaining near its lows. A break above the red zone would signal relative weakness in SPY and this would be negative for stocks.
Gold Follows TLT Higher
The Gold SPDR (GLD) also moved higher this week and maintained its positive correlation with TLT. Overall, GLD broke out with the move above 118 two weeks ago and this breakout is holding. The breakout zone around 118 becomes the first level to watch and a close below 118 would call for a re-evaluation. Overall, note that GLD is trending higher this year, while UUP and $TNX are trending lower. The relationship is clear!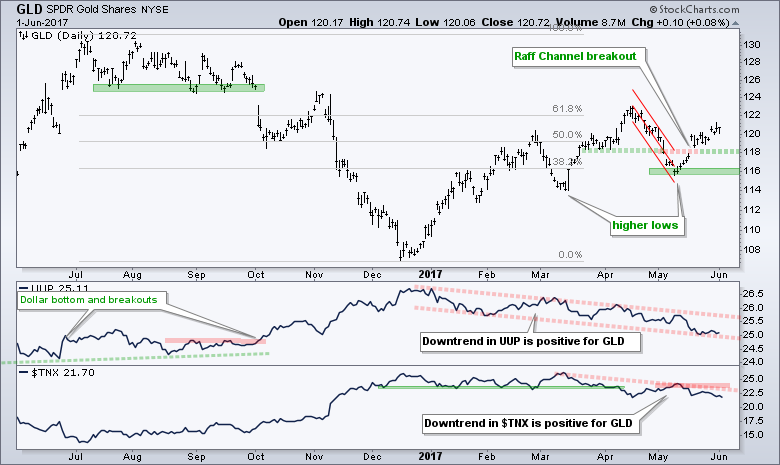
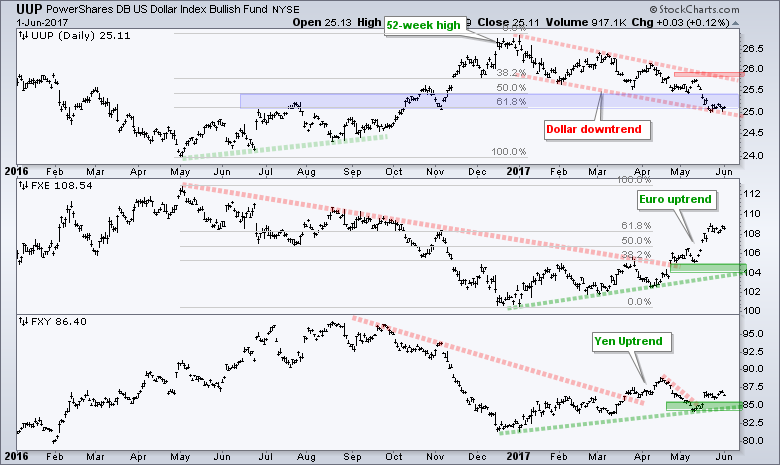
UUP Stalls Near Key Fibonacci Level
There is nothing magical about Fibonacci levels. Well, I take that back. There is something magical about these numbers and their occurrence in nature (Google it). There is, however, nothing really magical from a technical analysis standpoint. I would just assume have 33%, 50% and 67% on my retracement tool. In essence, I am looking for a correction to retrace 1/3 to 2/3 of the prior move. The Fibonacci 38.2% and 61.8% are fairly close. Keep in mind that we are dealing with stocks, fear, greed overshoots, undershoots and such. In any case, the US Dollar ETF (UUP) has retraced 61.8% of its May-January advance and returned to broken resistance. The ETF firmed just above 25 and this is a potential reversal zone. Look for a surge off this level for the first sign. A follow through breakout at 26 would fully reverse the 2017 downtrend.
 ******************************************************
ETF Master ChartPack - 300+ ETFs organized in a Master ChartList and in individual groups.
Follow me on Twitter @arthurhill - Keep up with my 140 character commentaries.
****************************************
Thanks for tuning in and have a good day!
--Arthur Hill CMT
Plan your Trade and Trade your Plan
*****************************************


