.... IJR Mean-Reversion Trade Exit
.... Gold Rises without the Gold Miners
.... Regional Banks Continue to Struggle
.... Using an EMA Ribbon to Define the Trend (MA)
.... Three Failed Setups (NTAP, STX, BMY)
.... Hawaiian Holdings Bounces off Breakout
.... Bullish Setups for MLM and CSRA
.... A Bearish Setup for IRM ....
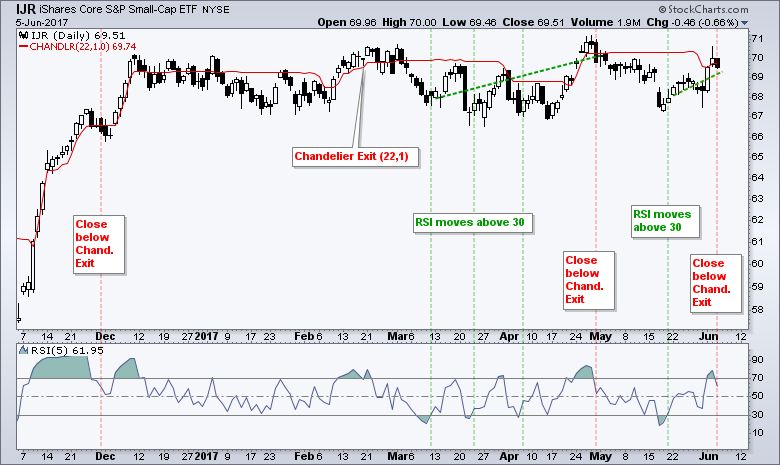
IJR Mean-Reversion Trade Exit
Mean-reversion trading can seem counter-intuitive because buy signals trigger after a decline of some sort. Buying after weakness seems the antithesis of trend following, but mean-reversion systems do not ignore the bigger trend. In fact, mean-reversion systems bet on the bigger uptrend continuing, which is the most important assumption in trading. In other words, assume that the trend is in force until proven otherwise. The length and duration of the trend are indeterminable. We simply accept the trend until there is evidence to the contrary.
The RSI-Chandelier strategy continues to work well for the five major index ETFs. This strategy was first put forth in mid December and updated in mid March. Basically, the system goes long when RSI(5) moves above 30 and exits when the ETF closes below the Chandelier Exit (22,1). QQQ and SPY triggered bullish on May 18th. IJR, MDY and DIA triggered bullish on May 19th, a day later. Note that this system does not consider gaps, patterns, sentiment, seasonality, politics or the economy. It is just trend, mean-reversion, entry and exit. IJR closed below the Chandelier Exit on Monday to trigger an exit on today's open. The other four remain above their Chandelier Exits.
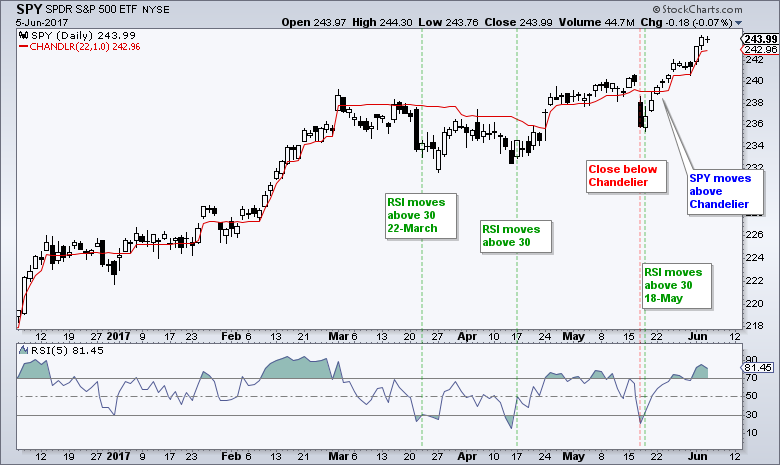
There are three things I have learned by writing these System Trader articles and back-testing systems. First, mean-reversion systems typically perform better than breakout systems. Second, there is nothing wrong with setting a profit target and taking a profit. Three, stop-losses don't help that much. Notice that the latter two points contradict the "let your profits run and cut your losses" mantra.
Gold Rises without the Gold Miners
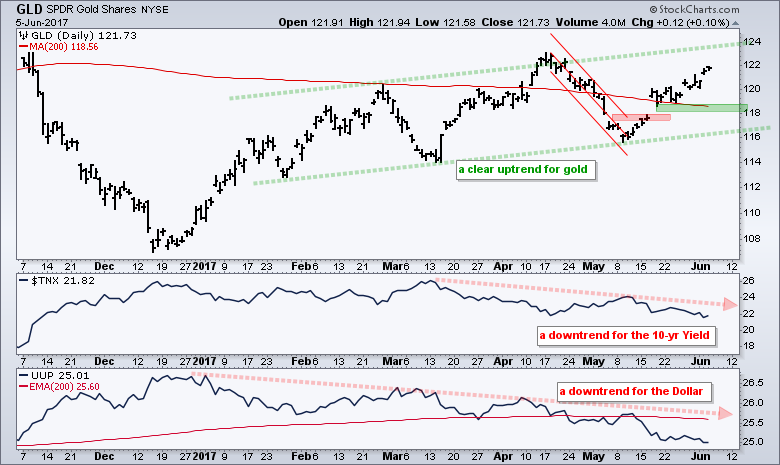
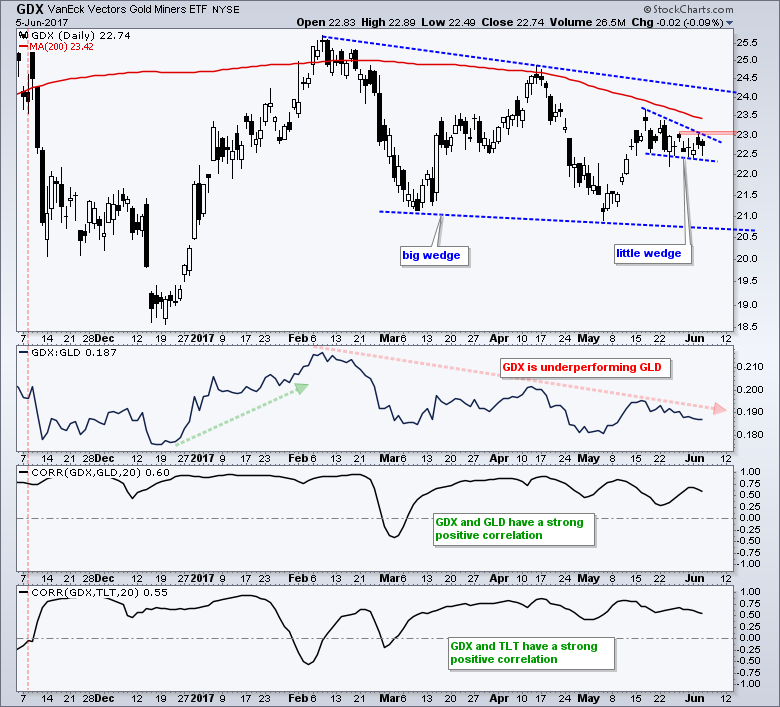
The Gold SPDR (GLD) is up around 4% the last three weeks and the Gold Miners ETF (GDX) is flat. This is a bit strange and something may need to give. The first chart shows GLD in a clear uptrend this year with a series of higher highs and higher lows. The ETF recently broke out with a surge above the Raff Regression Channel and 200-day moving average. I am marking support at 118 (the breakout zone). GLD continues to benefit from downtrends in the Dollar and 10-yr T-Yield (uptrend in TLT).
The next chart shows GDX with a large falling wedge since February and a small falling wedge the last three weeks. Look for a breakout at 23.10 to reverse the short-term downtrend and provide the first bullish clue.
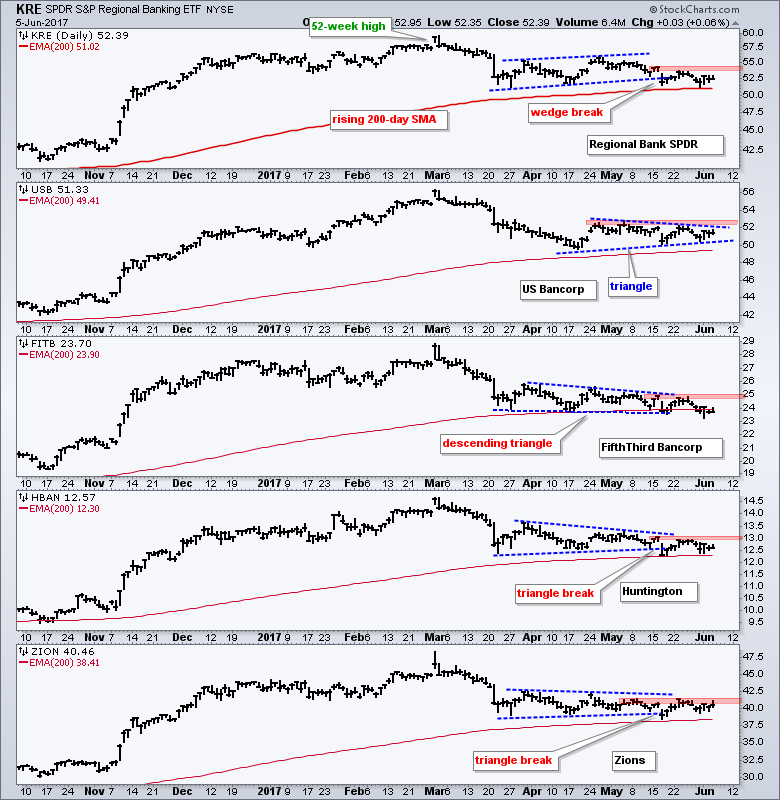
Regional Banks Continue to Struggle
The Regional Bank SPDR (KRE) continues to drag is feet and remain weak. The top window shows KRE breaking the wedge trend line in the latter part of May and remaining near this break the last two weeks. Even though the ETF hit a new high in early March and is above the 200-day EMA, a break above the red resistance zone is needed to reverse the three month downtrend. The other four windows show four regional banks and their resistance levels.
Using an EMA Ribbon to Define the Trend
There are numerous ways to determine the trend with the humble moving average providing the simplest means. The length of the moving average depends on the trend you wish to capture. The chart below shows Mastercard (MA) with four EMAs that become progressively longer (20, 40, 80 and 160 days). This moving average ribbon provides a great example of a strong uptrend from August 2016 until now. Notice that the shorter EMA has been above the next longer EMA since August (20-day above 40-day, 40-day above 80-day etc...).
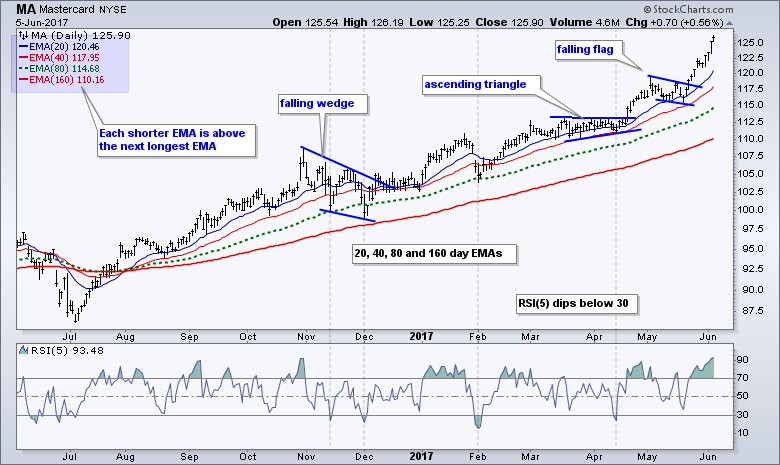
The corrective patterns and RSI dips below 30 provided opportunities to partake in this uptrend. Several readers have asked if the RSI-Chandelier system above can be applied to stocks. The RSI(5) dips below 30 worked well for Mastercard above, but I have not had much luck with it in the system testing. Nevertheless, I will continue to work on a solution and perhaps incorporate the moving average ribbon in the testing. Note that there are dozens of uninspiring tests for every inspiring test.
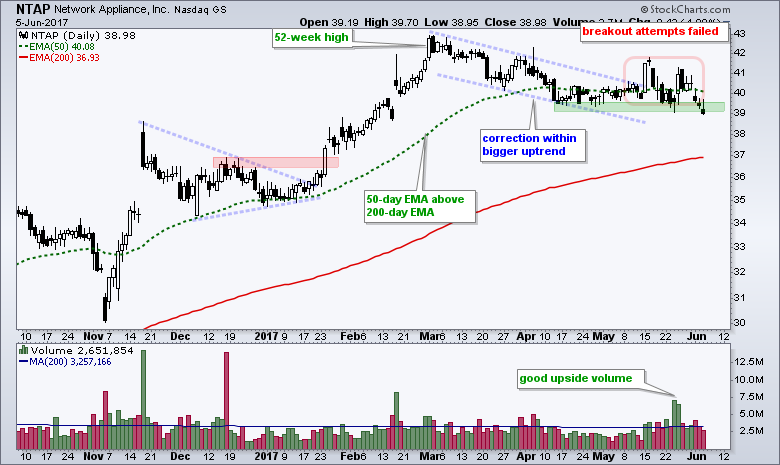
Three Failed Setups
It is a stock pickers market right now and the picking remains difficult. There are plenty of winners out there, but also plenty of losers, even within some of the strong groups. I will start with three setups I posted last week that failed. In general, I try to pick stocks that are correcting within a long-term uptrend or after a sharp advance. Sometimes these corrections take on a life of their down and extend further than expected. Despite a long-term uptrend and good volume in May, the breakout attempts in Network Appliance (NTAP) failed as the stock broke below the April-May lows. This shows some serious relative weakness because QQQ is near an all time high right now.
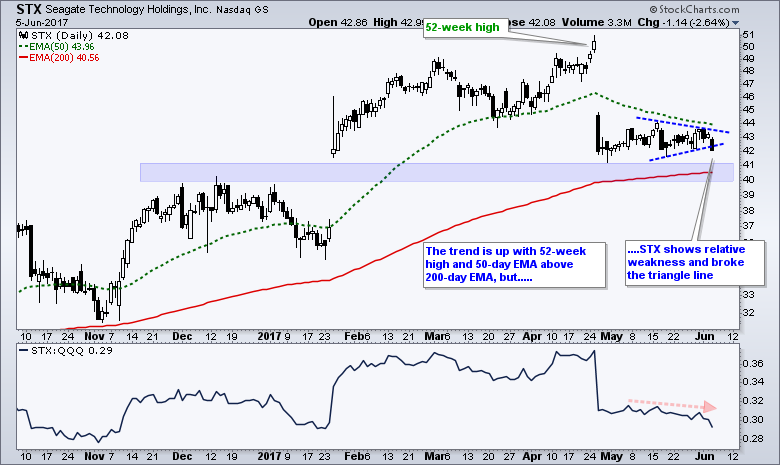
I also featured Seagate Technologies last week as the stock firmed just above a support zone. Instead of breaking above resistance, STX is breaking the triangle line and this could signal a continuation of the April plunge (second shoe dropping). Despite a bearish pattern, I am not interested in shorting stocks when the broad market environment is bullish and techs are leading overall. This just looks like a potential bullish setup gone bad (like NTAP above).
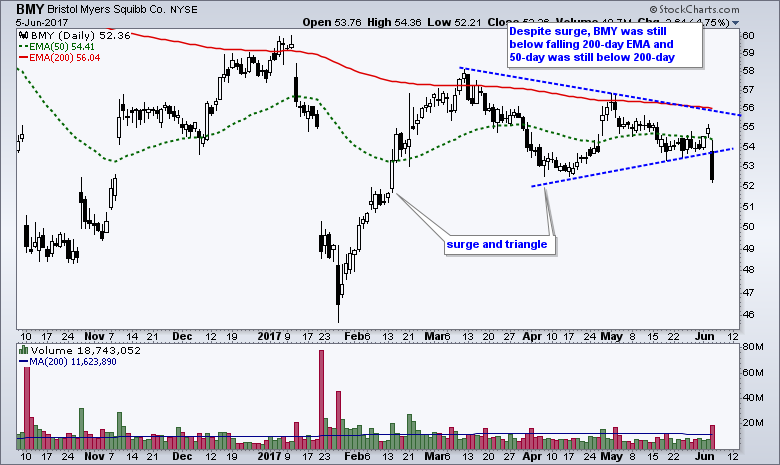
I also featured Bristol Meyers Squibb (BMY) as it consolidated after the January-March surge. While a consolidation after a surge is typically a bullish continuation pattern, the stock never fully reversed the long-term downtrend. The nascent bounce off the lower line of the triangle failed miserably as the stock plunged on Monday.
Hawaiian Holdings Bounces off Breakout
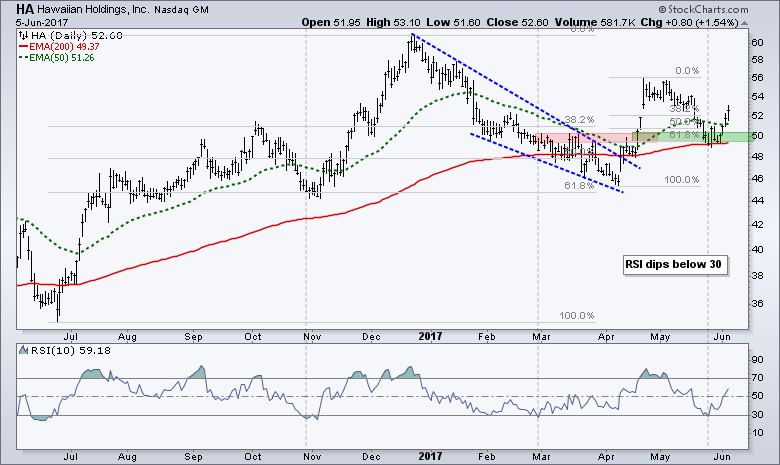
HA is part of the airline group and this is one of the strongest groups in the market right now. The stock broke out with a big surge in April and then fell back to the breakout zone in late May. The breakout zone and the 50-61.8% retracement zone mark a potential reversal zone. Notice that RSI(10) dipped below 30 in late May as well. The stock appears to be resuming its bigger uptrend with a bounce the last four days.
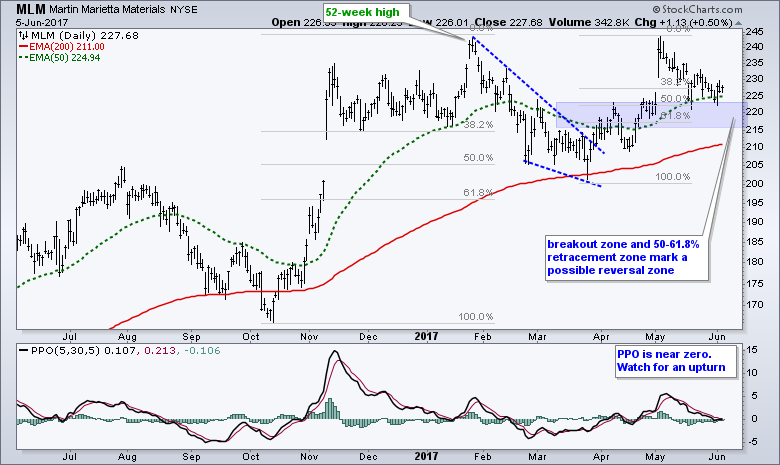
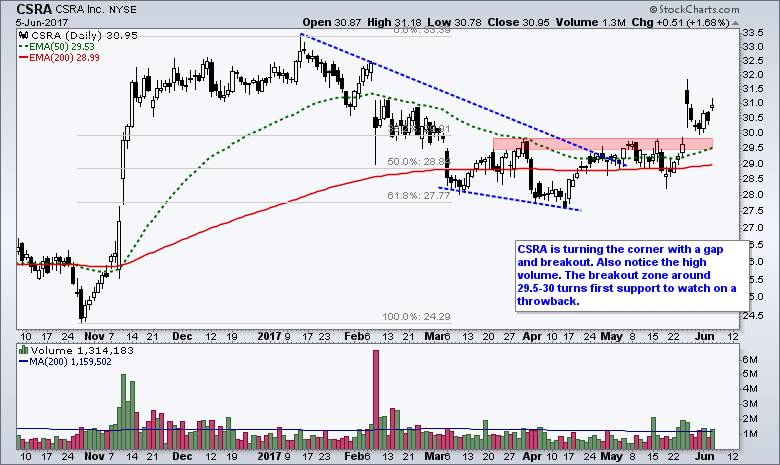
Bullish Setups for MLM and CSRA
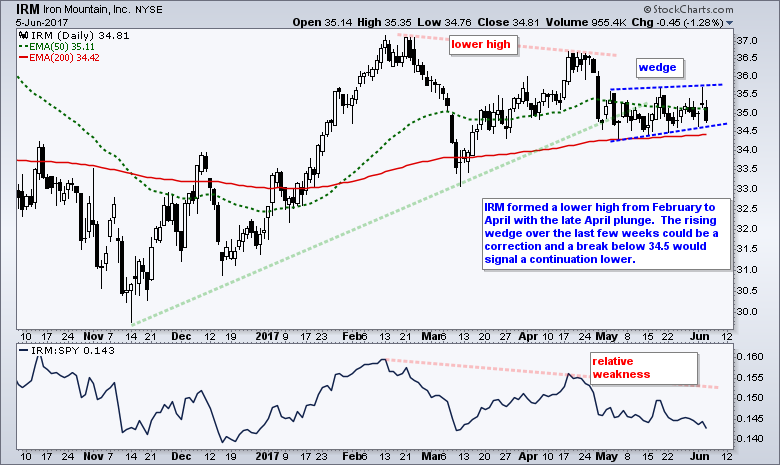
A Bearish Setup for IRM
******************************************************
ETF Master ChartPack - 300+ ETFs organized in a Master ChartList and in individual groups.
Follow me on Twitter @arthurhill - Keep up with my 140 character commentaries.
****************************************
Thanks for tuning in and have a good day!
--Arthur Hill CMT
Plan your Trade and Trade your Plan
*****************************************


