 |
.... Evidence for Market Correction Builds .... Seasonality for Stocks versus Bonds .... High-Low Percent Turns Negative .... Selling Pressure Ticks Up .... Correction Could be Starting for SPY .... QQQ Extends Correction .... Small-caps Continue to Struggle .... Five of Nine Sectors in Corrective Mode .... XLY and XLK Lead Correction .... Staples and Utilities Fall Hard .... Finance and Industrials Continue to Lead .... TLT Hits Moment-of-truth .... Gold SPDR Tests May Low .... Dollar Extends Downtrend as Euro Surges |
----- Art's Charts ChartList (updated 7-July) -----
Evidence for Market Correction Builds
Short-term bullish setups are appearing for mean-reversion traders because many stocks and ETFs pulled back over the last five weeks. Mean-reversion traders buy pullbacks and short-term oversold conditions when the bigger trend is up. Some stocks and ETFs pulled back with declines while others traded flat and consolidated prior gains. These corrections have created some short-term bullish setups on the price charts, but chartists should also consider the broad market environment before acting on said setups.
The S&P 500 remains in a long-term uptrend and we are in a bull market. Despite a long-term bullish bias, the shorter term (1-3 months) is looking more and more shaky. QQQ, large tech stocks and the consumer discretionary sector have been correcting the last five weeks. Thus, two very important parts of the broader market are in corrective mode right now and leading lower the last five weeks. As noted in detail below, seasonality does not favor stocks the next two months, the AD Volume Lines are weakening and new lows are on the rise. The evidence for a broad market correction is building and most stocks follow the broader market.
Programming Note: The family vacation starts next Monday and I will be out for two weeks (July 10 to July 24). The commentaries will resume on Tuesday, July 25th. Happy July!
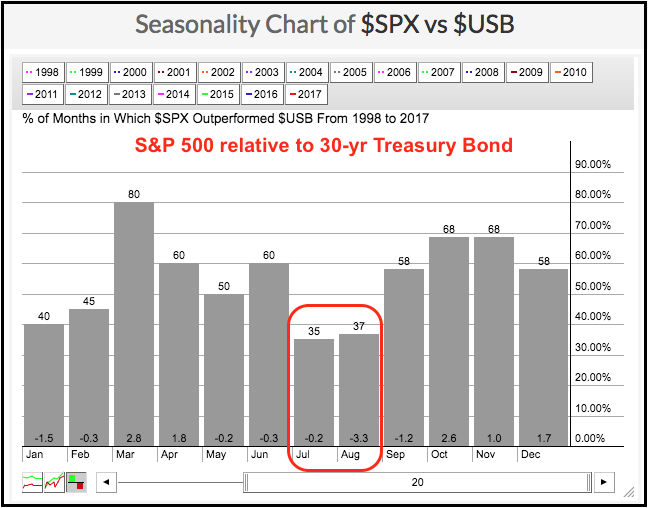
Seasonality for Stocks vs Bonds
As noted in last week's commentary, the S&P 500 is entering its weakest three month period of the last twenty years and the 30-yr US Bond ($USB) is entering a relatively strong period. Chartists can also plot the seasonal patterns for relative performance to see how stocks performed relative to bonds over the last 20 years. The seasonal chart below shows that stocks outperformed bonds in July and August less than 40% of the time, which means the S&P 500 underperformed more than 60% of the time. While I still think that the overall trend and price chart are more important than seasonal patterns, we should keep this in mind as stocks soften and the 20+ YR T-Bond ETF (TLT) nears support.
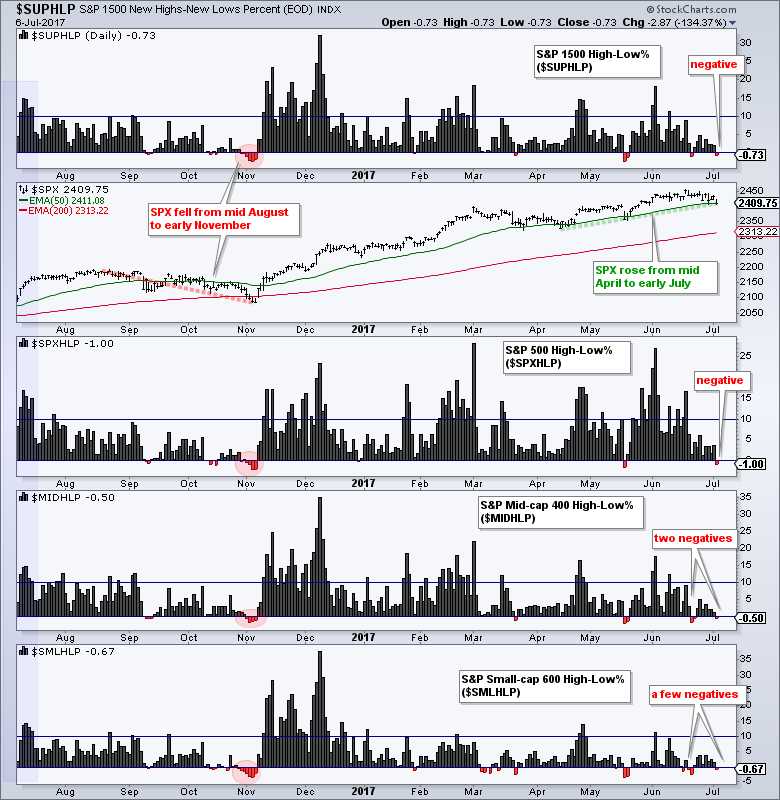
High-Low Percent Turns Negative
Even though the S&P 500 is less than 2% from an all time high, the High-Low Percent indicators for the S&P 500, S&P Mid-Cap 400 and S&P Small-Cap 600 turned negative on Thursday, . Looking back, notice that High-Low Percent turned negative in early November - after a two and a half month decline (mid August to early November). This is normal after a such a decline. In contrast, the S&P 500 is up over the last two and a half months, but High-Low Percent is already poking its head into negative territory. This is not a bearish signal per se, but it shows pockets of weakness within the major indexes and this could limit gains for the broader market. Note that XLP High-Low% ($XLPHLP) dipped below -11% this week, XLK High-Low% ($XLKHLP) turned negative and XLY High-Low% ($XLYHLP) dipped below zero several times over the last two weeks.
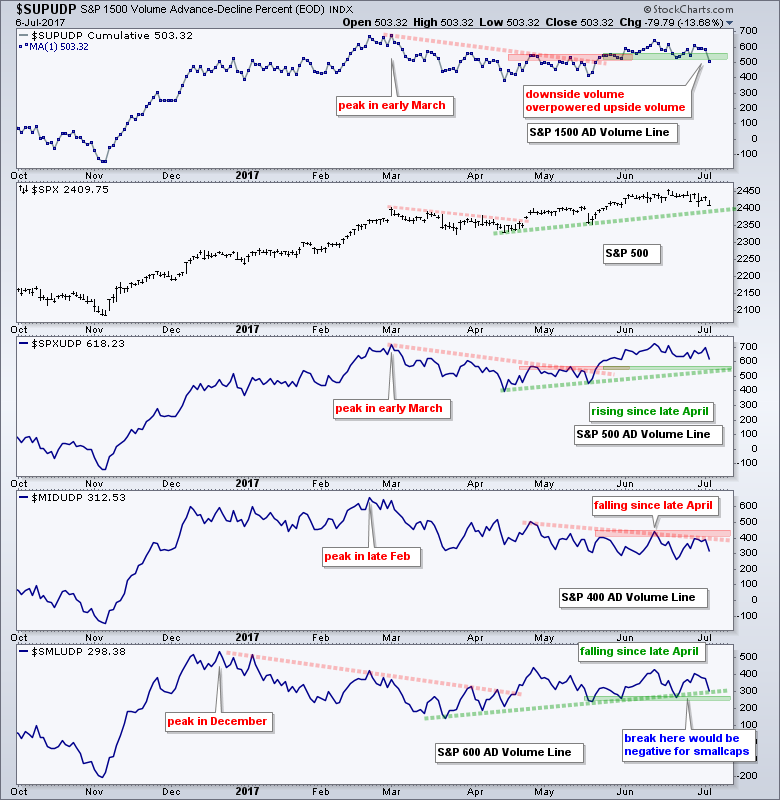
Selling Pressure Ticks Up
The next chart shows the AD Volume Lines for the S&P 1500, S&P 500, S&P Mid-Cap 400 and S&P Small-Cap 600. I use Advance-Decline Volume to measure buying pressure and selling pressure. Advancing volume is the volume behind advancing stocks and represents buying pressure. Declining volume is the volume behind declining stocks and represents selling pressure. AD Volume is net advancing volume (advancing volume less declining volume). The AD Volume Line is a running total of net advancing volume. The chart below shows the S&P 1500 AD Volume Line breaking below the June lows with a sharp move lower on Thursday. This is negative because it reflects an increase in selling pressure. The S&P 500 AD Volume Line is still on the rise, but the S&P Mid-Cap 400 and S&P Small-Cap 600 AD Volume Lines have been falling since late April. No wonder mid-caps and small-caps are struggling.
Correction May Be Starting for SPY
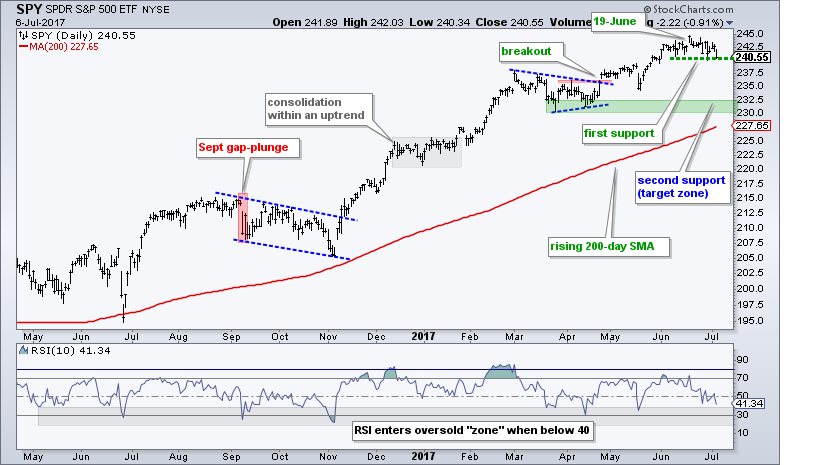
The S&P 500 SPDR (SPY) is still less than 2% from an all time high and still in a long-term uptrend, but the short-term trend appears to be turning down. Notice that SPY gapped up and hit a new high on 19-June. The ETF then started working its way lower with a choppy decline the last 11 trading days. I marked short-term support at 240 and the ETF is right at this level. A break would argue for a deeper pullback and this would target a move into the low 230s (second support zone).
QQQ Extends Correction
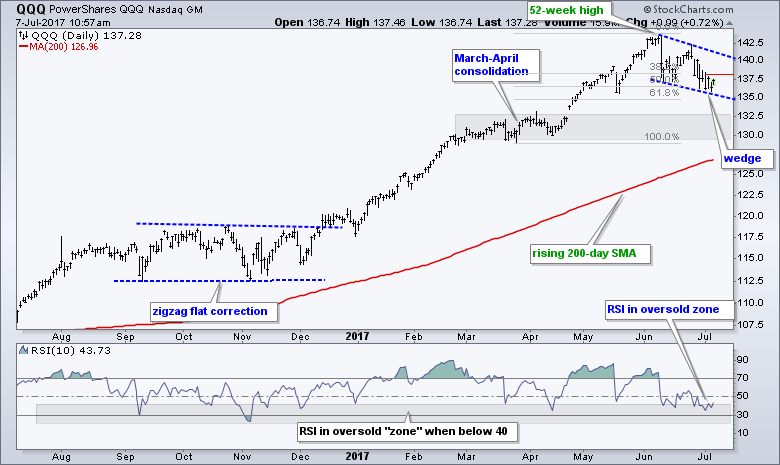
QQQ was leading the broader market a month ago, but fell on hard times and fell back the last four weeks. Technically, this is a correction within a long-term uptrend, which means we should consider it an opportunity, not a threat. Notice that the decline retraced 50-61.8% of the prior advance and RSI moved into the oversold zone (20-40). In addition, a falling wedge could be taking shape and these patterns are typical for corrections within a bigger uptrend. The thin red line marks the first level to watch within the wedge. A close above 138 would signal an upturn and the start of an oversold bounce. Failure to bounce could lead to further weakness and target a move to the low 130s.
Small-caps Continue to Struggle
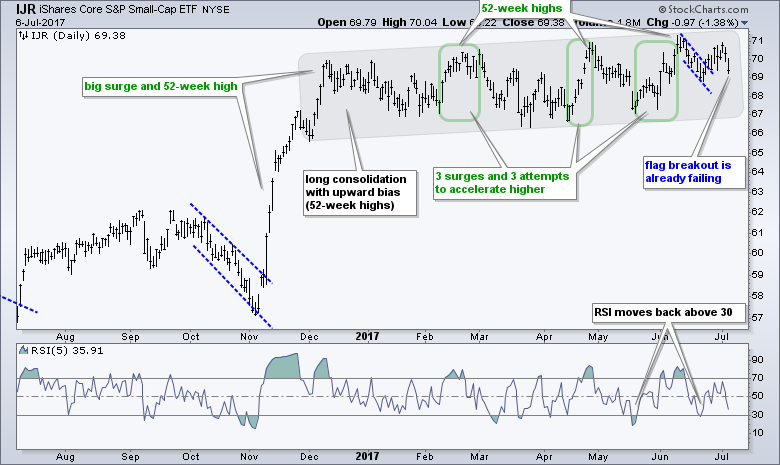
The S&P SmallCap iShares (IJR) has been grinding higher since December and remains in an uptrend overall. With this grind higher (gray area), the ETF broke flag resistance and looked ready to continue higher. This short-term breakout, however, failed as the ETF fell back the last two days. This is enough to negate the flag breakout, but not enough to affect the long-term trend, which is still a drift higher.
Five of Nine Sectors in Corrective Mode
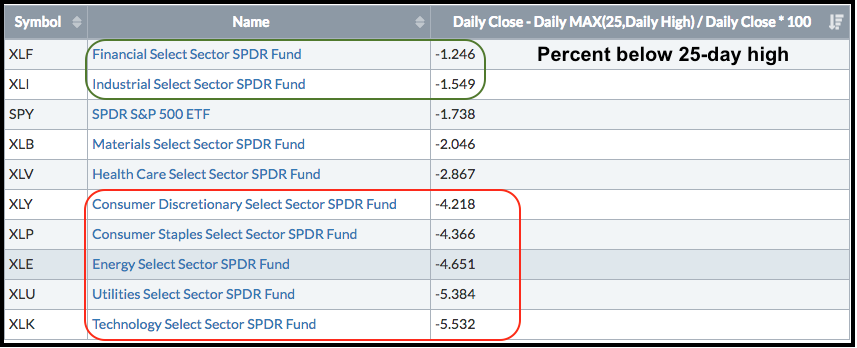
The image below shows the percentage each sector is below its 25-day high. Using this metric, we can see which sectors are leading the correction and which sectors are holding up the best. Utilities and technology are leading with declines greater than 5%. Finance and industrials are holding up the best with declines that are less than the S&P 500 SPDR. Overall, we can see that five sectors could be considered in corrective mode because they are down more than 4% from their recent highs. Together, these five sectors account for around 52% of the S&P 500. Thus, by sector weighting, the majority of sectors are in correction mode and this suggests that the S&P 500 is in corrective mode right now.
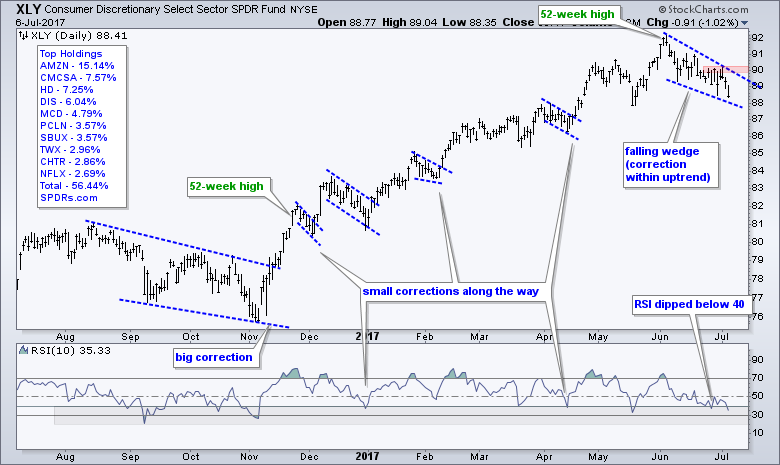
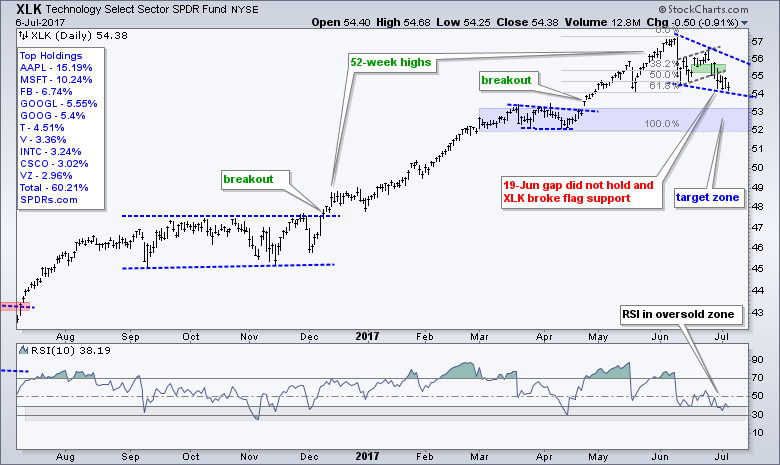
XLY and XLK Lead Correction
Corrections are funny (not) because we never know how far they will extend in price and time. Some are short and sweet (flags, pennants, small wedges). Others are long and drawn out (falling channels, flat consolidations, big triangles and big wedges). The charts below show XLY and XLK with falling wedge corrections. As with QQQ above, these wedges are clearly falling and we have yet to see any signs of a reversal. RSI entered the oversold zone, but prices are near multi-week lows and there is no sign of a reversal within the wedges. A close above this week's high would provide the first sign.
Staples and Utilities Fall Hard
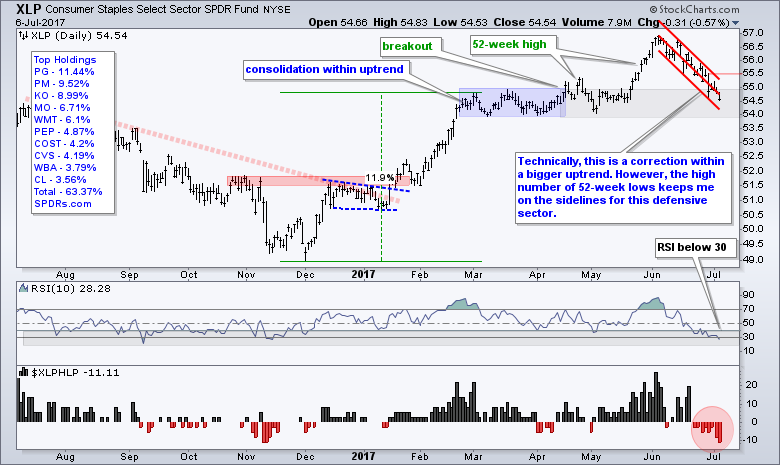
XLP and XLU were hit hard over the last few weeks. This could be because the 20+ YR T-Bond ETF (TLT) fell rather sharply. XLP fell back into the prior consolidation as RSI(10) moved below 30 for the first time since November. I would normally consider this a potentially bullish setup, but noticed that XLP High-Low% ($XLPHLP) moved below -11%. There are lots of stocks making new lows in this sector and I would avoid it for the moment.
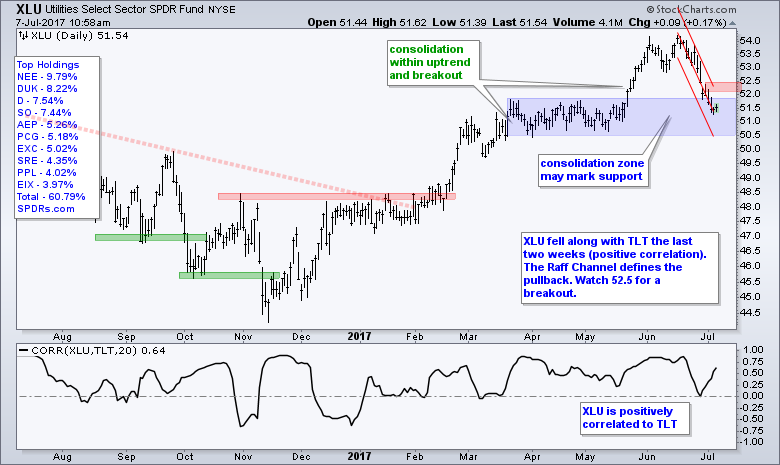
XLU also fell back into its prior consolidation and could find support here. The Raff Regression Channel is used to define the short-term downswing because it is too steep for a trend line. Look for a break above 52.5 to reverse this pullback and signal a continuation of the bigger uptrend. Chartists should watch the 20+ YR T-Bond ETF (TLT) quite closely because utilities are bond proxies and take their cue from the bond market.
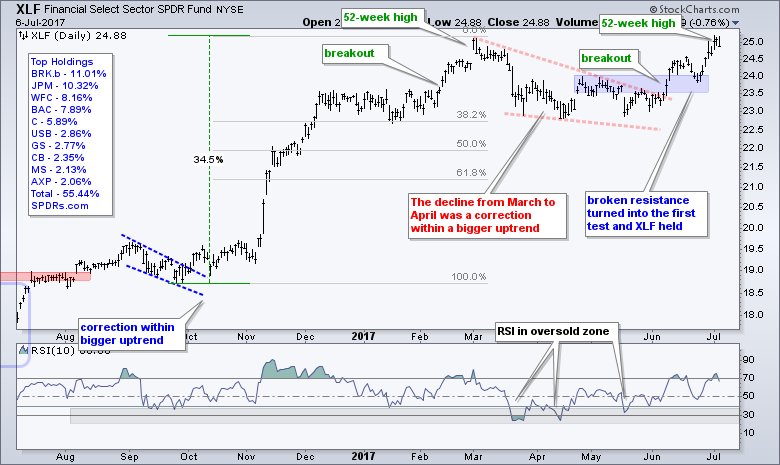
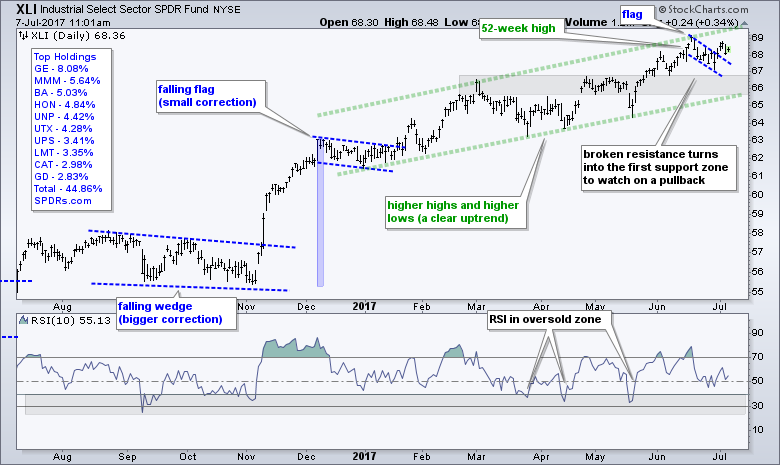
Finance and Industrials Continue to Lead
XLF was the only sector SPDR to hit a new high this week and XLI is around 1.5% from its high. The chart shows XLF breaking out in early June and hitting a new high on Monday. XLF may be getting extended and ripe for a rest, but the big trend is up and it is leading the market right now.
XLI broke the flag line and then fell back on Thursday. The flag breakout is still holding, but under threat. The long-term trend is clearly up with a rising channel since December and support marked around 66.
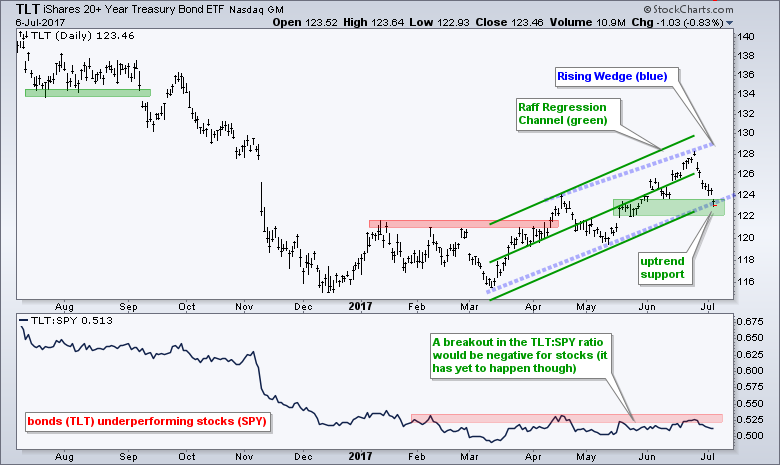
TLT Hits Moment-of-truth
The 20+ YR T-Bond ETF (TLT) was hit quite hard over the last seven days with a decline back to its support zone. Last week I used a rising wedge, a Raff Regression Channel and a buffer to mark support in the 122-124 area. TLT is at its moment-of-truth with the decline back to this zone. A breakdown in TLT would be positive for banks, but negative for utilities and gold.
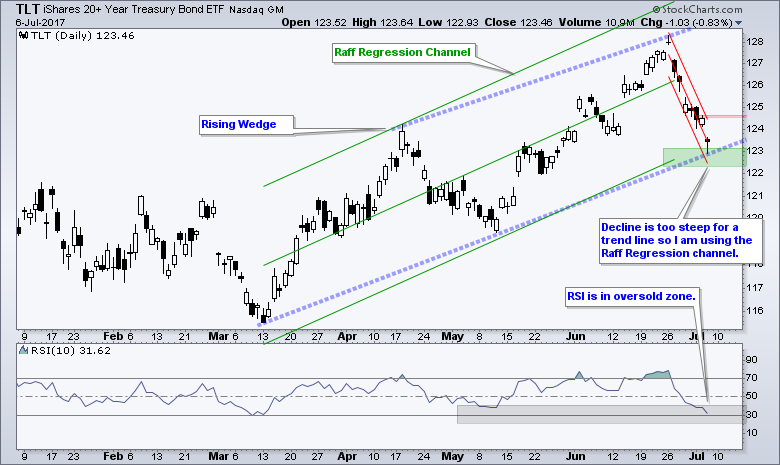
The second chart focuses on the seven day decline. It is too steep to draw a trend line so I am using the Raff Regression Channel to define the downswing. The upper line ends around 124.5 and the Wednesday close is at 124.65. Thus, a close above 124.65 would reverse this downswing and signal a reversal off the support zone. A bounce in TLT would be bullish for utilities and gold, but possibly negative for banks.
Gold SPDR Tests May Low
The Gold SPDR (GLD) was hit hard the last four weeks with a 5% decline. This decline broke the trend line extending up from the late January low, but GLD found some support near the May low around 116. A Raff Regression Channel defines the downswing with resistance marked at 119. A break above this level is needed to reverse the downswing and revive the uptrend. Watch TLT and the Dollar for clues.
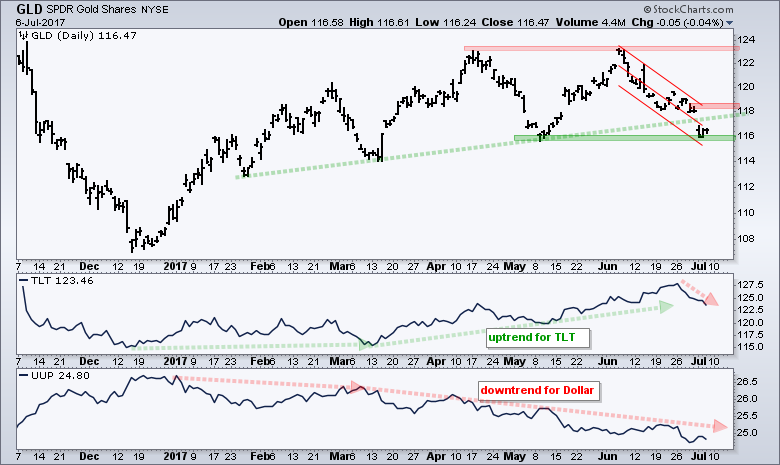
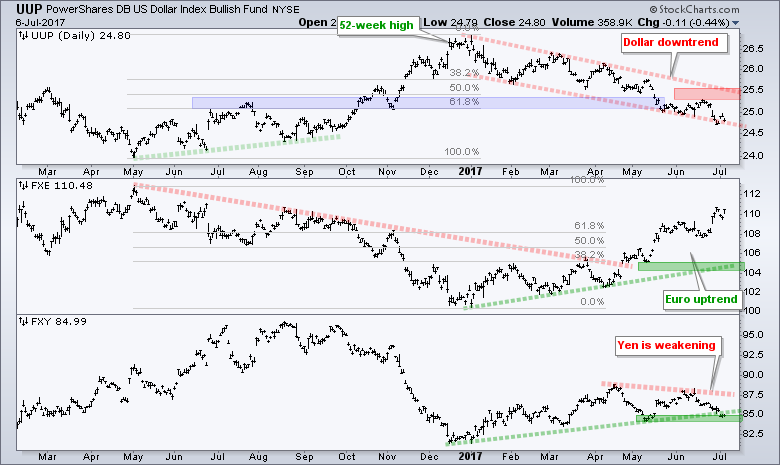
Dollar Extends Downtrend as Euro Surges
There is not much change for the Dollar or Euro, but the Yen has started to weaken. The US Dollar ETF (UUP) hit a new low for the move in late June and remains in a clear downtrend since January. Resistance is set at 25.50 (channel line). The Euro ETF (FXE) surged in late June and hit a new high for the year. The Yen ETF (FXY) shows weakness because it formed a lower high from April to June and fell back to its May lows (just like gold).
******************************************************
ETF Master ChartPack - 300+ ETFs organized in a Master ChartList and in individual groups.
Follow me on Twitter @arthurhill - Keep up with my 140 character commentaries.
****************************************
Thanks for tuning in and have a good day!
--Arthur Hill CMT
Plan your Trade and Trade your Plan
*****************************************


