.... Home Builders Continue to March Higher
.... Customize your CandleGlance Charts
.... Caesarstone and USG May Play Catchup
.... High and Tight Flags for Two Biotechs (AMGN, GILD)
.... 3 Cyber Security Stocks (PANW, FTNT, PFPT)
.... Three Charts for the Road (DOX, WEN, VLKAY)
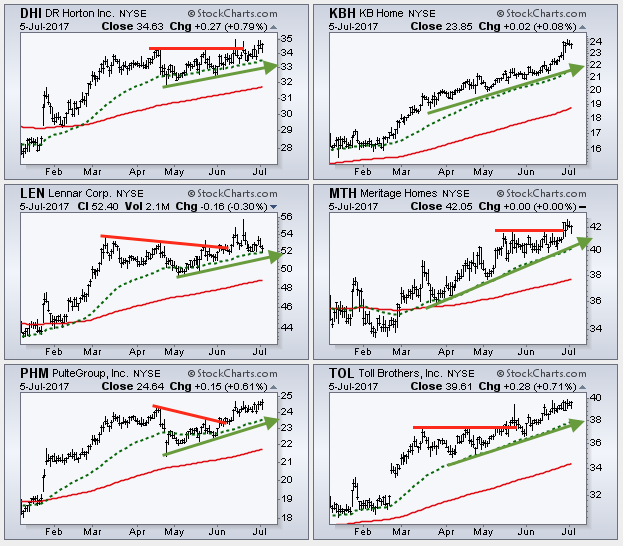
The Home Construction iShares (ITB) is one of the strongest industry group ETFs this year with a 52-week high earlier this month. The ETF is up over 20% year-to-date and easily outperforming the S&P 500 SPDR (SPY), which is up around 9.5%. I will cover ITB in the video for the Weekly Review & Outlook tomorrow. Today I will focus on some strong stocks within the group and some laggards that may play catch up. The CandleGlance chart below shows six homebuilders in clear uptrends with 52-week highs this month. All six are above their rising 200-day EMAs (red) and the 50-day EMAs (green) are above the 200-day EMAs. This shows broad strength throughout the group and could provide a tailwind for related industries.
Programming Note: I was going to update the ChartCon momentum rotation strategy today, but did not complete the testing for the adjusted strategy. I will post this update in early August and also present a new trend-momentum strategy for trading stocks in the S&P 500. In the meantime, I start my family vacation next Monday and will be out for two weeks (July 10 to July 24). The ChartCon momentum strategy was last updated in this System Trader article in April.
Customize your CandleGlance Charts
The CandleGlance charts above were customized by adding a new ChartStyle called CandleGlance (caps are not important). Chartists first create the SharpChart they want to see as a CandleGlance chart and then click "Add New" in the ChartStyles section below the chart. If you already have a ChartStyle named CandleGlance, then you can just click "Replace" to change it.
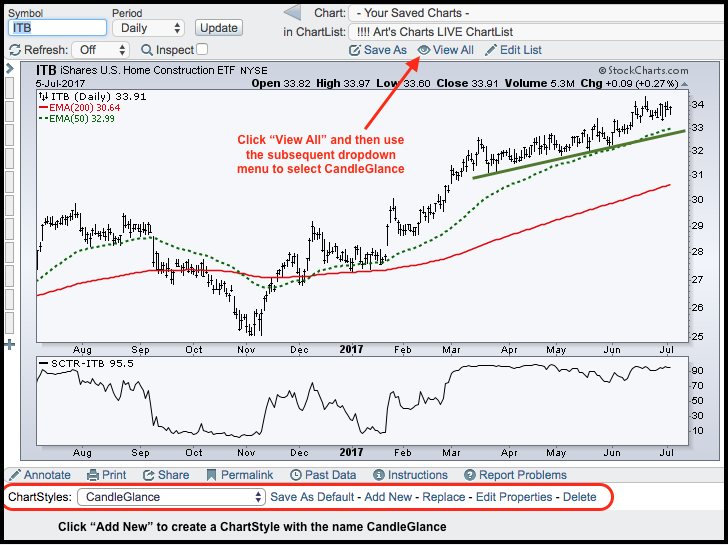 Once you have created a ChartStyle named CandleGlance, you can click the "View All" link just above the chart and then select CandleGlance from the dropdown menu that appears after clicking "View All". This is the menu with "10 Per Page" as the heading. You will now see 30 CandleGlance charts per page and these charts will be in the ChartStyle that you named CandleGlance.
Caesarstone and USG May Play Catchup
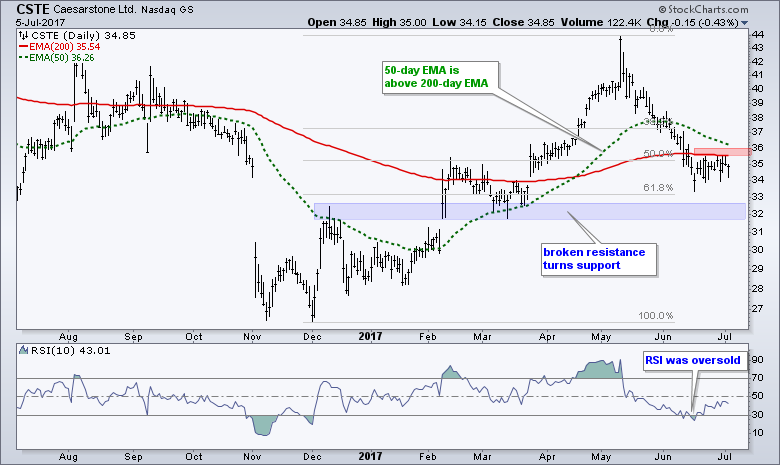
The housing group is strong overall so I am on the lookout for stocks that may play a little catch-up. The first chart shows Ceasarstone (CSTE) with a big advance from December to May and a decline that retraced 50-61.8%. This is a normal retracement amount for a correction within an uptrend. We can assume that the bigger trend is up because the stock hit a 52-week high in May and the 50-day EMA is above the 200-day EMA. The stock is below the 200-day EMA, but it is just above the 200-day SMA (which is not shown). Moving averages do not mark support or resistance levels. They just give you an idea of the average price over a particular time period and show if the average price is rising or falling. Returning to the chart, RSI became oversold in mid June as CSTE firmed in the 34-35 area. Look for a breakout at 36 to signal an end to the correction and a resumption of the bigger uptrend.
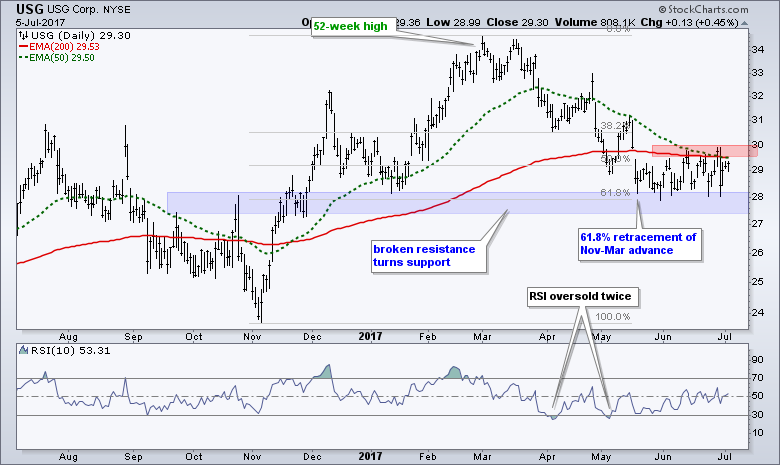
 USG Corp (USG) is an interesting play on housing because it is a big supplier of building products, including sheetrock. The stock sports a setup similar to CSTE as it firms near the 61.8% retracement. A breakout at 30 would signal an end to the correction and a resumption of the bigger uptrend.
High and Tight Flags for Two Biotechs (AMGN, GILD)
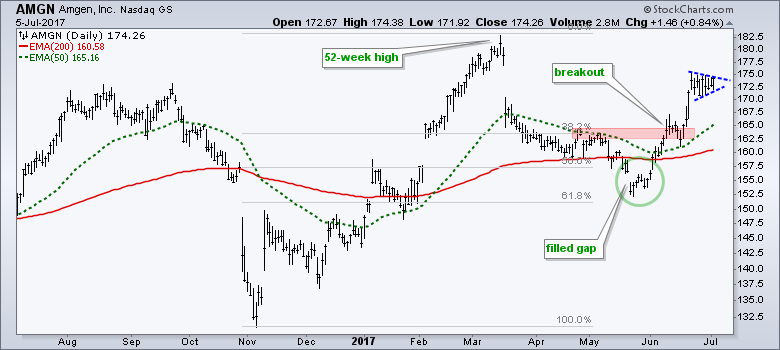
The next two charts show the same short-term patterns, but the long-term trends are clearly different. First, Amgen (AMGN) is in a long-term uptrend with a 52-week high in March, correction into May and breakout surge in June. The stock consolidated the last two weeks with a pennant taking shape. An upside breakout at 175 would signal a continuation of the June surge. Chartists more interested in playing a pullback, can mark first support near the breakout zone (call it the 165 area).
 Before looking the Gilead (GILD), keep in mind what the flag and the pennant represent. Flags and pennants are just consolidation patterns after a sharp surge. Sometimes a bull flag is flat and sometimes it slopes down. Sometimes we can draw nice lines to define these patterns; sometimes we cannot and must rely on our intuition. Sideways movement for 2-4 weeks after a surge represents a rest after the move and we should be on guard for a continuation breakout.
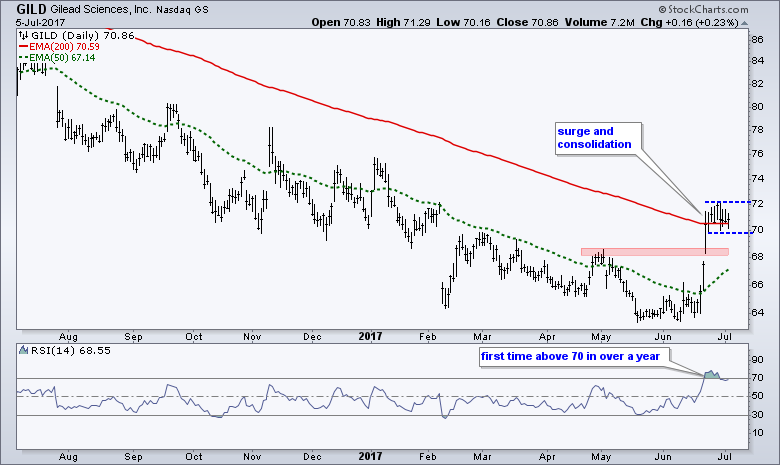
The chart below shows GILD with its biggest surge in over a year. Notice that RSI moved above 70 for the first time in over a year and the stock is right at its 200-day EMA for the first time in a long time. Prices moved sideways after the surge and a breakout at 72 would signal a continuation higher. Pullback players can watch the breakout zone around 68 for support.
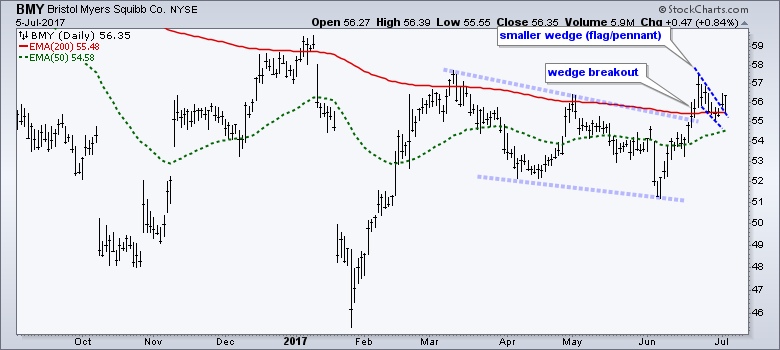
 The third chart shows Bristol Meyers Squibb (BMY) with a wedge breakout in late June, a falling flag/wedge into early July and a breakout over the last two days.
3 Cyber Security Stocks (PANW, FTNT, PFPT)
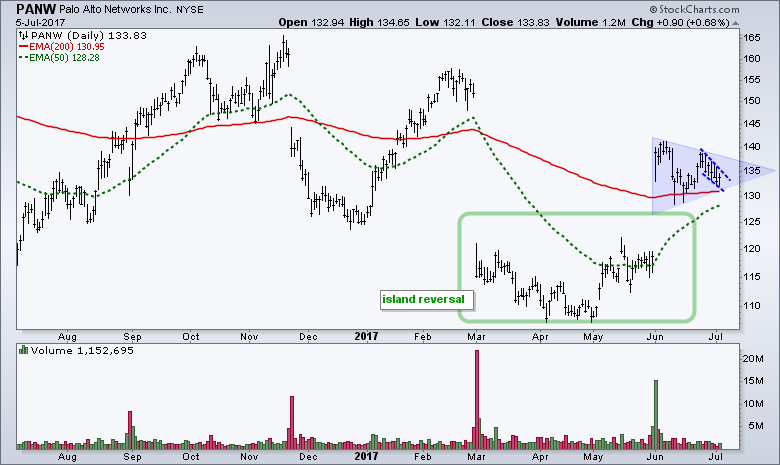
The next three stocks come from the Cyber Security ETF (HACK), which is correcting within a long-term uptrend. The first shows Palo Alto Networks (PANW) with three patterns representing three timeframes. The first, and most important, is the island reversal and surge above the 200-day EMA. This sets the long-term uptrend and provides a trading bias, which is bullish. The second is the shaded triangle over the last five weeks. This represents a rest after the surge and the expectation is for an upside breakout. The third pattern is within the triangle and represents the short-term pullback (blue dashed lines). Look for a break above 136 to reverse the short-term slide and increase the chances of a triangle breakout.
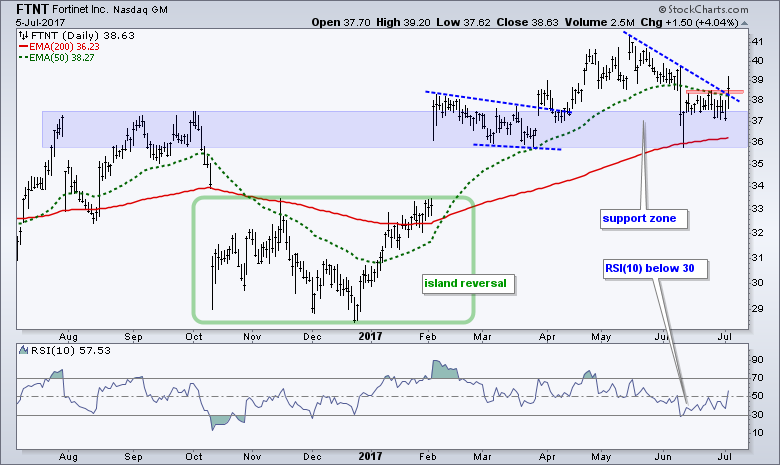
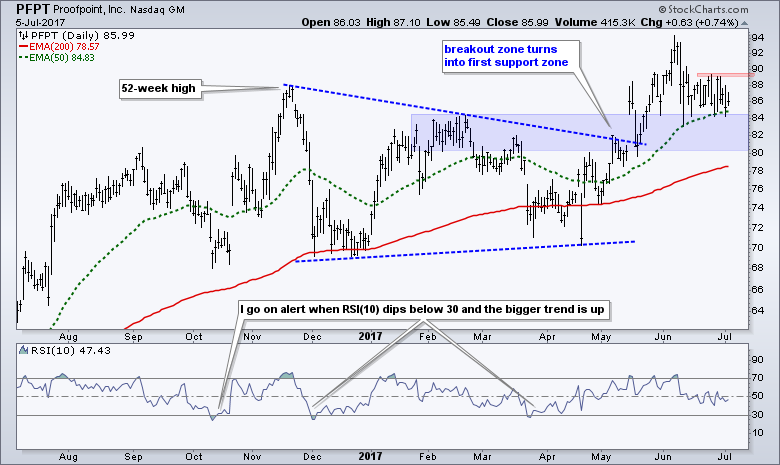
 The next chart shows Fortinet (FTNT) with an island reversal earlier this year and a breakout in February-March. This is a pretty powerful reversal because the stock gapped down, stabilized for three months and gapped up again. The stock fell back to the breakout zone in June and broke out with a surge on Wednesday. The third chart shows Proofpoint (PFPT) pulling back to its breakout zone.
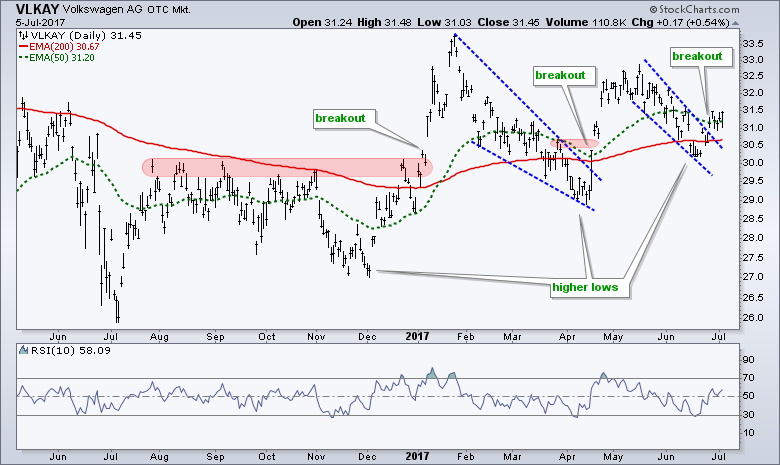
Three Charts for the Road (DOX, WEN, VLKAY)
 ******************************************************
ETF Master ChartPack - 300+ ETFs organized in a Master ChartList and in individual groups.
Follow me on Twitter @arthurhill - Keep up with my 140 character commentaries.
****************************************
Thanks for tuning in and have a good day!
--Arthur Hill CMT
Plan your Trade and Trade your Plan
*****************************************


