.... Medical Devices ETF Bids to End Correction
.... An ETF is Only as Good as it's Component Stocks
.... Scanning for Trends with a ChartList
.... Charting the Top Five IHI Stocks
.... Abbot Surges off Support
.... Thermo Fisher Consolidates after Gap
.... Danaher Bounces after Support Break
.... Boston Scientific Firms in Retracement Zone ....
Medical Devices ETF Bids to End Correction
Today I will look at the Medical Devices ETF (IHI) and analyze some of its key component stocks. First, let's look at the price chart for IHI. The ETF advanced over 30% from the December low to the July high, which is a 52-week high. IHI is clearly in a long-term uptrend and this means modest declines are viewed as corrections within this uptrend. The ETF recently fell from 170 to 160 and retraced 38-50% of the last leg up (mid April to late July). This retracement amount is normal for a correction within an uptrend. Think of it as two steps forward and one step backward. After becoming oversold for the first time this year, IHI is showing signs of strength again with a gap three days ago and move above last week's high.
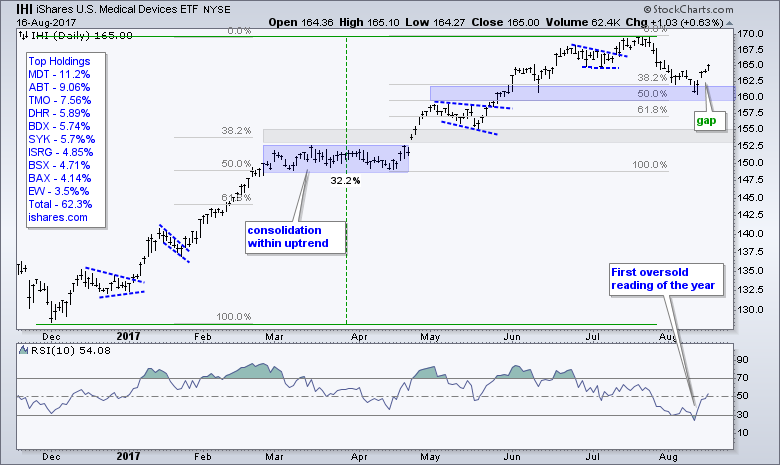
Ideally, IHI will continue its uptrend after this gap and move to new highs over the next few weeks or months. The ideal, however, is not always what we get. A close back below the gap (162) would mark a failure. Getting out the crystal ball, this could lead to a deeper retracement and perhaps a move to the 153-155 area. This area marks a 38.3% retracement of the advance from December to July.
An ETF is Only as Good as it's Component Stocks
Even though I marked support and used the Fibonacci retracements on IHI, I must admit that I am pretty skeptical when it comes to the validity of these levels for ETFs and indexes that have dozens of component stocks because each component stock has its own support, resistance and key retracement levels, The key levels for the component stocks don't always match up with each other or the ETF. Sure, there are buyers and sellers in the ETF that influence support, resistance and retracements, but there are also buyers and sellers pushing around the individual stocks. Price changes in the individual stocks lead to price changes in the ETF, not the other way around. Personally, I think the stocks within the ETF are the main price drivers for the ETF.
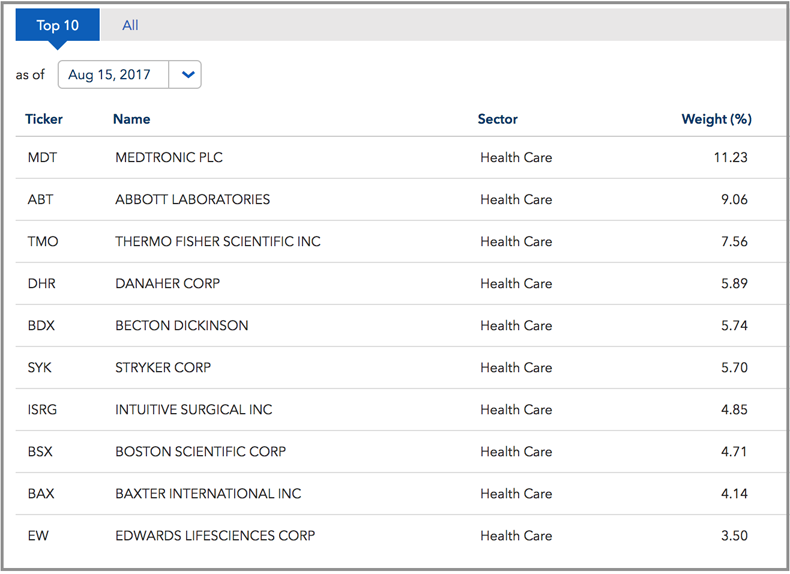
The image above shows the top ten stocks in the ETF and their weightings, which can be found at the iShares website (www.ishares.com). Some stocks weigh much more than others and these are largely responsible for gains and losses in the ETF. Even though there are 50 stocks in IHI, note that the top five stocks account for around 40% of the ETF and the top ten stocks account for around 62%. Over half the stocks in this ETF are weighted less than 1% each and these 29 account for just 14.77% of the ETF. Thus, the stocks with the biggest weightings are clearly the key drivers for IHI. A 20% move in Medtronic (11.2%) will affect the ETF much more than a 20% move in Accuray (.15%). Not all ETFs are constructed this way, but it is important that traders and investors understand the key drivers.
Scanning for Trends within a ChartList
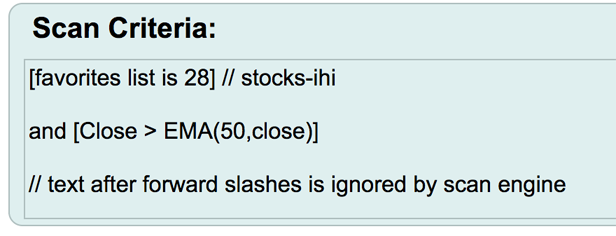
Chartists interested in a particular group can create a ChartList with the components and use this for scanning or charting. This makes it easy to focus on a particular sector or industry group. I downloaded the ETF components from the iShares website, created a csv file of the components and uploaded this file to a ChartList. I then ran a small scan to find out how many stocks are above the 200-day EMA and how many are above the 50-day EMA. The image below shows the basic scan code and three links describing the process.
- Working with ChartLists
- Creating a ChartList from a CSV File
- Scanning a ChartList (Advanced Scan Workbench)
It turns out that 39 out of 50 components (78%) are above their 200-day and 27 of 50 (54%) are above their 200-day. This tells me that the vast majority are in long-term uptrends and around half are in medium-term uptrends. Of course, some of the stocks below the 50-day EMA could be correcting within their larger uptrends.
Of the top ten stocks, 9 are above their 200-day EMA (90%) and 8 are above their 50-day EMA (8%). A higher percentage of the top ten stocks are above these key EMA and these stocks are the large-caps within the ETF. Once again, we are seeing the preference for large-caps over small-caps play out.
Charting the Top IHI Stocks
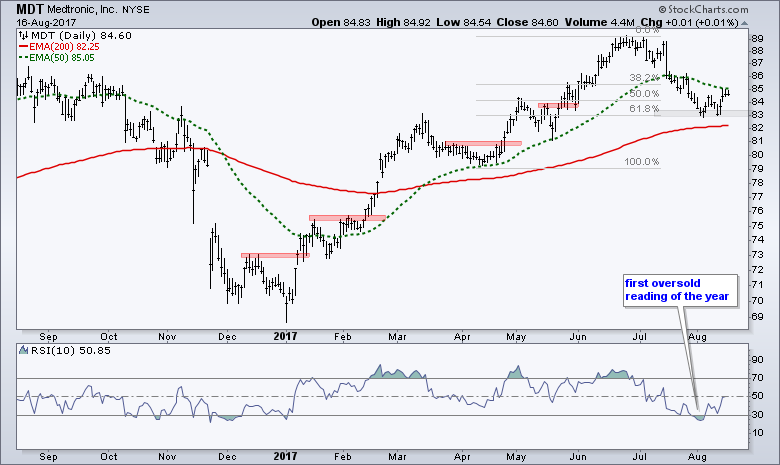
Let's look at some top stocks in the Medical Devices ETF. The first chart shows Medtronic (11.2%) moving below its 50-day EMA as it retraced around 62% of the April-July advance and became oversold for the first time this year. The stock is still above the 200-day EMA and finding support around 83 with two bounces off this level. MDT is making an attempt to end its correction and I will mark re-evaluation support at 83.
Abbot Surges off Support
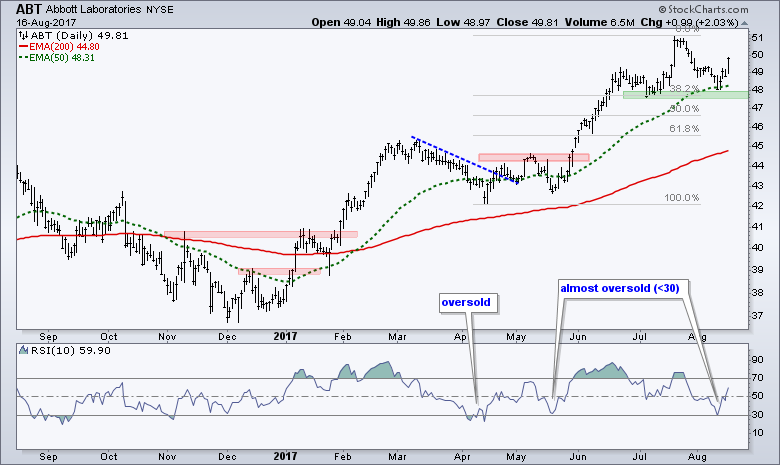
The next chart shows Abbot Labs (9%) surging to a new high in July and then falling back to support with a 38% retracement. Notice that RSI almost became oversold with a dip below 30. The support test is looking successful as the stock surged over the last four days.
Thermo Fisher Consolidates after Gap
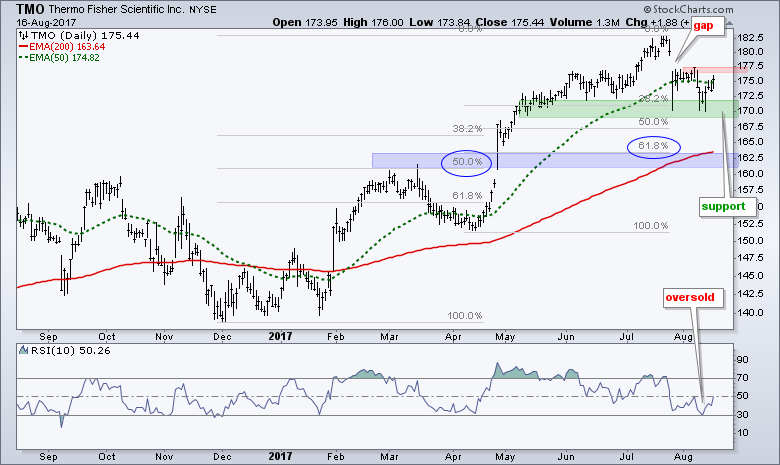
Thermo Fisher (7.56%) is in an uptrend overall, but the stock gapped down in mid July and this gap remains unfilled. Even though the gap is not enough to reverse the long-term uptrend, it is enough to create some short-term concern for a deeper correction. A break above the red resistance zone would start filling the gap and alleviate this concern. A break below the green support zone would be quite negative and target a move to the low 160s. The blue shading and ovals mark a Fibonacci cluster in this area: a 61.8% retracement of the April to July advance and a 50% retracement of the December to July advance.
Danaher Bounces after Support Break
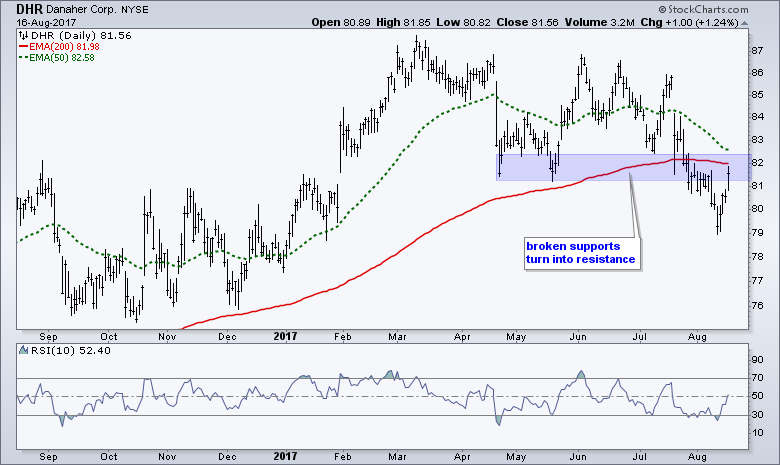
Danaher (5.89%) is the weakest of the top stocks because it is below its 200-day EMA. The stock recently broke support in the 81-82 area and this broken support zone turns into a resistance zone. DHR got a nice oversold bounce the last four days, but I want to see a follow through breakout above 83 before getting interested from the long side.
Boston Scientific Firms in Retracement Zone
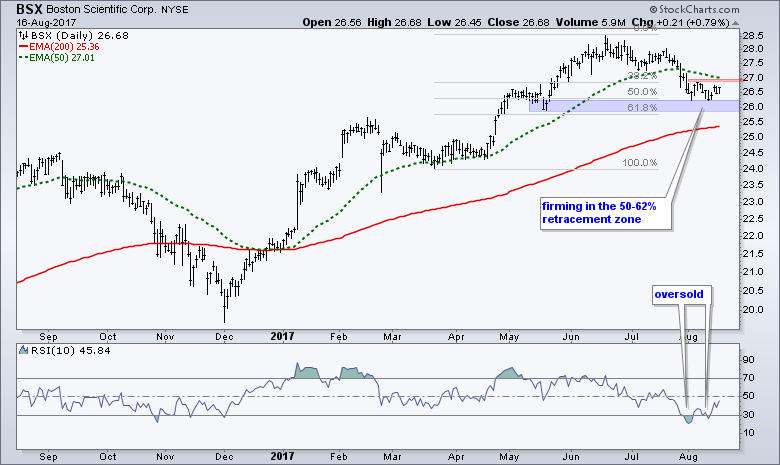
I am skipping ahead to Boston Scientific (4.71%) because it has one of the more interesting chart patterns. Namely, the stock pulled back within an uptrend and it shows signs of firming near a key retracement zone. The blue shading marks the 50-62% retracement zone and the stock became oversold twice in the last few weeks. A break above 27 would suggest that the correction is ending and the bigger uptrend is resuming.
******************************************************
ETF Master ChartPack - 300+ ETFs organized in a Master ChartList and in individual groups.
Follow me on Twitter @arthurhill - Keep up with my 140 character commentaries.
****************************************
Thanks for tuning in and have a good day!
--Arthur Hill CMT
Plan your Trade and Trade your Plan
*****************************************


