
|
|
---- Reworking the Momentum-Rotation Strategy |

Reworking the Momentum-Rotation Strategy
I presented a momentum-rotation trading strategy at ChartCon in August 2016. This system started out with a bang the following November (+5.9%), took a hit in March (-5.2%) and surged in July (+6.4%). Overall, the system is up around 6% from 1-October-2016 to 1-August-2017 with an 11% Maximum Drawdown. The results are not bad, but I am looking for ways to improve the return and lock in some profits.
Basically, the ChartCon strategy buys the top ranked momentum stocks in the S&P 1500 and sells when they drop out of the top 10%. Thus, the 6.4% gain in July could evaporate with a broad market decline in August. Today I am reworking the ChartCon strategy by adding a profit target and an exit. Note that this is still a momentum system and the entry basics remain the same. It appears that we can improve results by taking profits early and keeping our stops wide. Sounds crazy? Read on.....
Setting the Benchmark
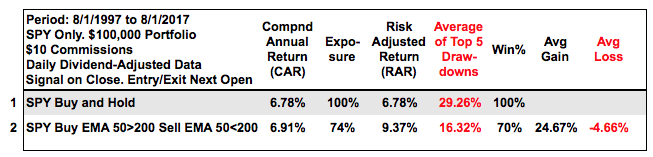
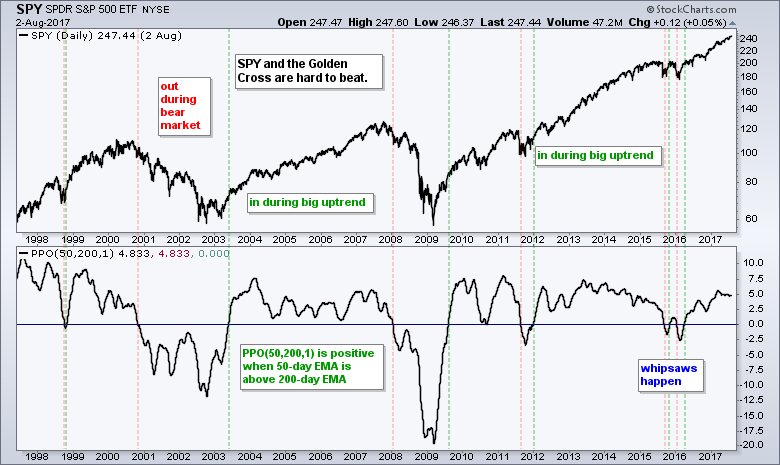
The testing period ran from 1-August-1997 to 1-August-2017, which covers 20 years. The S&P 500 SPDR (SPY) is the benchmark index with buy-and-hold and the golden cross system used as benchmarks for returns. The table below shows buy-and-hold returning 6.78% per year with an average drawdown of 29%. Note that I am using the average of the top five drawdowns. Buying when the 50-day EMA crosses above the 200-day EMA and selling when the 50-day EMA crosses below the 200-day EMA beat buy-and-hold and reduced the drawdown. The SPY golden-cross system returned 6.91% per year with an average drawdown of 16.32%, which is pretty hard to beat.
System Ground Rules
Even though the golden cross system for SPY is hard to beat, there were only 12 signals over the last 20 years and it is not a very active system. We can increase the number of signals by using stocks and shortening the trading timeframe. First, here are some general guidelines for stock selection.
- Bull market: Only long positions are considered and positions are only considered when the S&P 500 is in a long-term uptrend (50-day EMA above the 200-day EMA).
- Trading Universe: S&P 500 stocks. Historical Constituents are used to avoid survivorship bias. This means signals on a particular day, such as October 10th, 2010, are based the S&P 500 constituents for that particular day.
- The portfolio begins at $100,000 and commissions are set at $10 per trade. There are 20 equal weight positions in the portfolio. I did not account for slippage, which can occur for less liquid stocks.
- Buy-Sell signals are based on closing prices, while the entry and exit prices are based on the next open. Thus, this is an end-of-day (EOD) system. There are no signals or trades intraday.
Note that I opted to focus on the S&P 500 for this test. The system tested well with mid-caps, but not so well with small-caps. Large-caps have different characteristics than small-caps and trade differently. The average drawdown when trading the S&P Small-Cap 600 was near 30% and this is just too high.
Four Extra Filters
There are also four filters used to weed out low-priced stocks, excessive volatility, illiquid stocks and extreme movers. Most stocks in the S&P 500 are above $10 and liquid, but I use these extra filters just in case. The chart below shows AMD with indicators representing the four filters. First, the stock was ineligible for a buy signal when it closed below $10 in mid January. Second, the stock is currently ineligible because the normalized standard deviation is above 20%. The formula is shown on the chart and in the scan code below.
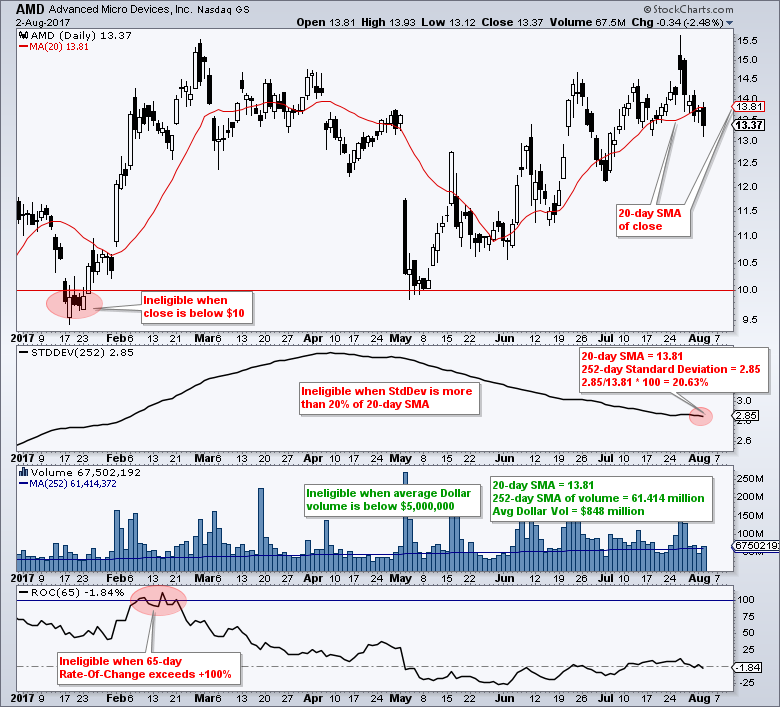
Third, the stock met the Dollar-volume criteria because it averages over 60 million shares per day and trades above $13. Dollar volume is the 20-day SMA of the close multiplied by the 252-day SMA of volume. I am looking for stocks with Dollar-volume above $5,000,000. Fourth, the 65-day Rate-of-Change must be below 100%. This is to insure the stock has not run too far too fast.
Consulting, Software and Data
System development is a time consuming, yet rewarding, endeavor with far more failures than successes. There are dozens of testing rounds before the final systems are presented. In addition to the development process, the results need to be verified by going through the trades and making sure the system is working right. This means checking signals, entries, exits and rankings on particular days. It is a true labor of love!
Cesar Alvarez of AlvarezQuantTrading.com provided invaluable feedback during the system development and the verification process. Cesar has a great blog and provides consulting services for system development click here. I used Amibroker to test the code and Premium Data from Norgate. Just like StockCharts, the data is adjusted for dividends to reflect the total return.
Charts with Trading Signals
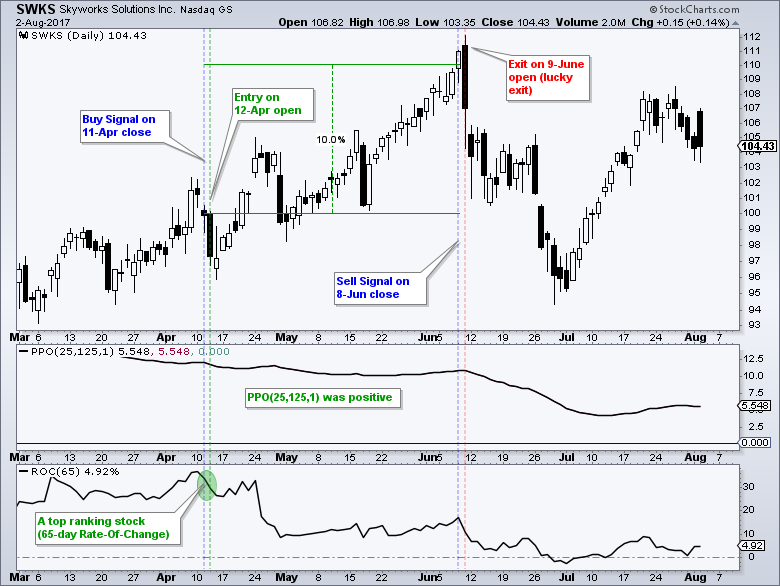
Once the ground rules and filters are set, the setup and signals are relatively simple. The 25-day EMA needs to be above the 125-day EMA to insure an uptrend. I then rank the stocks by a momentum indicator and buy the top ranked stocks. There are two exit possibilities. Exit when there is a 10% profit or exit when the 25-day EMA moves below the 125-day EMA. There are no stops.
The chart below shows a 10% profit exit for Skyworks (SKWS). The buy signal triggered on the 11-April close. Skyworks was selected because it had the highest 65-day Rate-of-Change (momentum) of available stocks, which are those meeting the filter requirements and those not already in the portfolio. The entry is based on the next day's open (12-April). Skyworks hit the 10% profit target with the close on 8-June and the exit triggered on the next open.
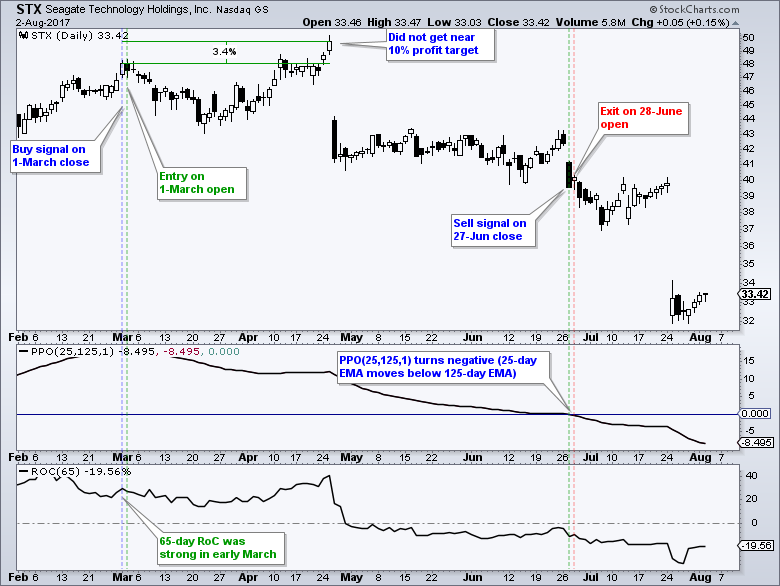
The next chart shows a losing trade for Seagate Technologies (STX). STX did not come close to the 10% profit target after the signal. Instead, the stock gapped down in late April, stalled and then gapped down again in late June. The sell signal triggered when the 25-day EMA moved below the 125-day EMA. While a trailing stop would have helped on this particular trade, my work shows that trailing stops hurt system performance overall. There is a trailing-stop test further down in this commentary.
Once a position is closed, the system runs the scan and buys the stock with the highest Rate-of-Change (strongest momentum). Stocks already in the portfolio are excluded. Chartists should also make an effort to exclude stocks that are in the midst of a takeover or acquisition.
Rate-of-Change Ranking Results
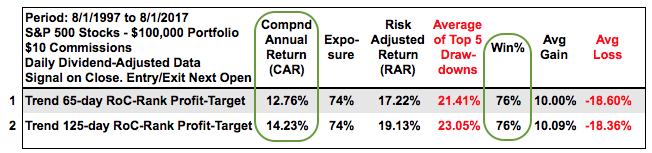
The table below shows the results using two different momentum rankings for stock selection: 65-day Rate-of-Change and 125-day Rate-of-Change. The results are quite good with both returning 12+ percent per annum and winning percentages at 76%. The average drawdowns were greater than 21% with the Maximum Drawdowns running around 27%. Thus, this system is not for the faint of heart because there will be drawdowns.
Testing a Trailing Stop
I am always asked about stop-losses and trailing stops whenever I put a system together. While stops seem perfectly logical, they usually hurt the results when looking at hundreds of trades. Some trades benefit from a trailing stop-loss, but the results suggest that these stops do not improve performance when trading a momentum system.
The table below shows the results for the 125-day Rate-of-Change system with a 10% profit target and different trailing stop-losses. The Compound Annual Return was negative with a 5% trailing stop-loss and exceeded +12% with a 20% trailing stop-loss. Thus, a tight stop that was half the profit target did not improve performance, but a wide stop-loss that was twice the profit target did. 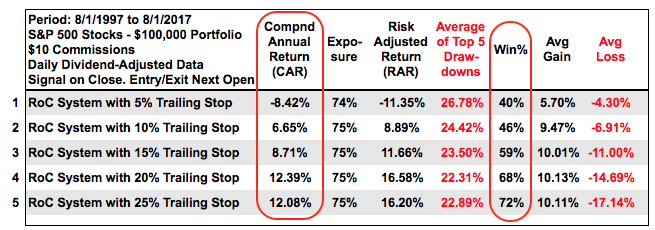
Some sort of stop-loss or exit is needed to prevent risk of ruin because we do not want to ride a stock to zero. Tight stop-losses did not help, but wide stop-losses did help the trading system. Instead of using a stop-loss, it appears that some sort of trend exit can prevent a BIG loss and help system performance. In the systems above, the exit triggered when the 25-day EMA moved below the 125-day EMA or PPO(25,125,1) turned negative.
Conclusions and Caveat Emptor
Momentum can be part of a profitable trading system, but traders should consider a method to lock in some profits. I tested different profit targets and settled on 10% because it sounds nice and it tested well. 10% sounds much better than 8.7%. By selecting the stocks with the highest Rate-of-Change, we are picking the stocks showing the most strength (momentum). Thus, this is also a relative strength system. Drawdowns have always been the Achilles heel of momentum systems, but taking profits early and often can improve returns and reduce drawdowns.
Portfolio level backtesting means I am testing a basket of stocks. I never know which picks will be winners and which will be losers. These systems are profitable because the profit from the winners exceeds the losses from the losers, and because there are more winners than losers. Also note that the results are based on taking every trade and sticking with the system, which is difficult in real life. And finally, keep in mind that past results do not guarantee future results.
Scan Code
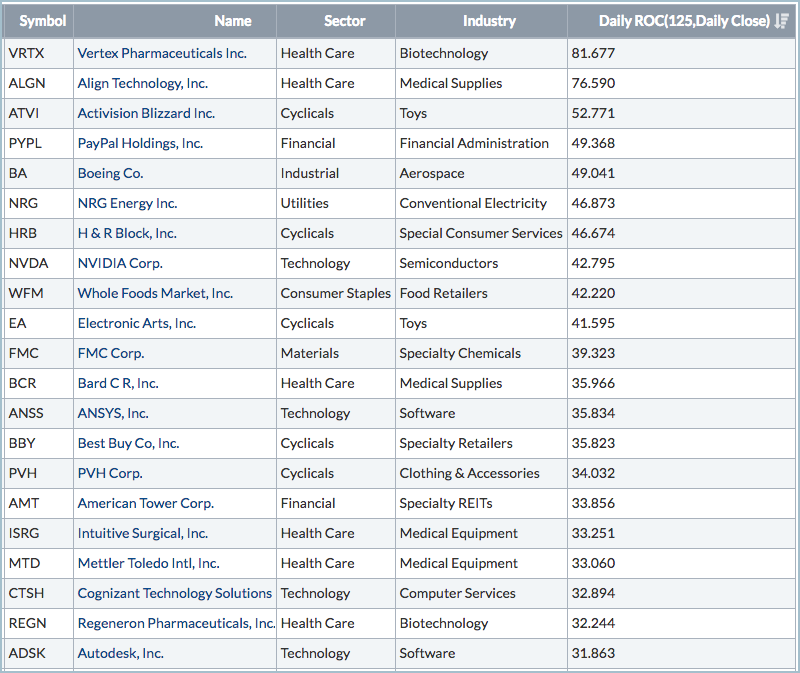
Here is the scan code for filtering stocks in the S&P 500 and then ranking by the 125-day Rate-of-Change. The table below shows the top results based on today's scan.
// set stock universe
[group is SP500]// weed out extremely high volatility
AND [Std Deviation(250) / SMA(20,Close) * 100 < 20]// weed out low-priced stocks
//AND [SMA(20,Close) > 10]// insure daily Dollar Volume is greater than $5 million
AND [SMA(20,close) * SMA(250,volume) > 5000000 ]// weed out stocks that have already doubled
AND [ROC(65) < 100]// only stocks that are in long-term uptrend
AND [EMA(25,close) > EMA(125,close)]// rank results by 125-day RoC
Rank by ROC(125)
******************************************************
Thanks for tuning in and have a good day!
--Arthur Hill CMT
Plan your Trade and Trade your Plan
******************************************************
Other Articles in the SystemTrader Series:
- Introduction to Key Performance Metrics
Quantifying the Golden Cross for the S&P 500 - Golden Cross and 5 Major Indexes
EMAs versus SMAs - Do Short Positions Add Value? - Setting up Momentum Scans, Creating ChartLists and Exporting Lists.
Differences in Major Indexes - Do Trend Filters Work? - MACD Crosses
Rules to Reduce Drawdowns and Increase Gains - Testing PPO Strategy - Follow me on Twitter @arthurhill
Keep up with my 140 character commentaries.