 |
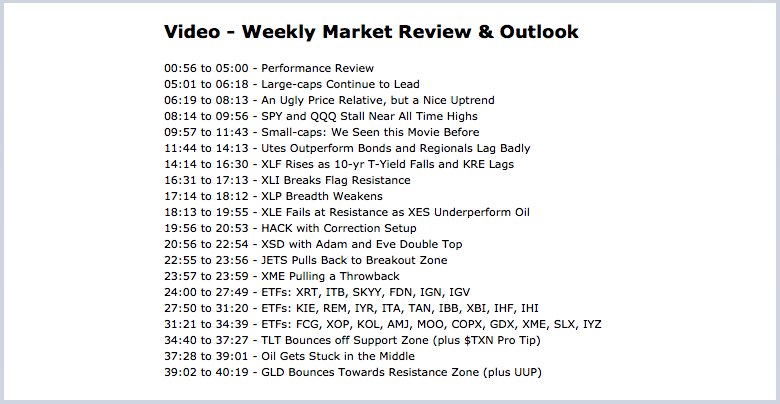
.... Large-caps Continue to Lead
.... An Ugly Price Relative, but a Nice Uptrend .... SPY and QQQ Stall Near All Time Highs .... Small-caps: We Seen this Movie Before .... Utes Outperform Bonds and Regionals Lag Badly .... XLF Rises as 10-yr T-Yield Falls - KRE Lags .... XLI Breaks Flag Resistance .... XLP Breadth Weakens and XLE Fails .... XES Continues to Underperform Oil .... HACK with Correction Setup .... XSD with Adam and Eve Double Top .... JETS Pulls Back to Breakout Zone .... XME Pulling a Throwback .... TLT Bounces off Support Zone (plus Pro Tip) .... Oil Gets Stuck in the Middle .... GLD Bounces Towards Resistance Zone .... |
----- Art's Charts ChartList (updated 4-August) -----
Large-caps Continue to Lead
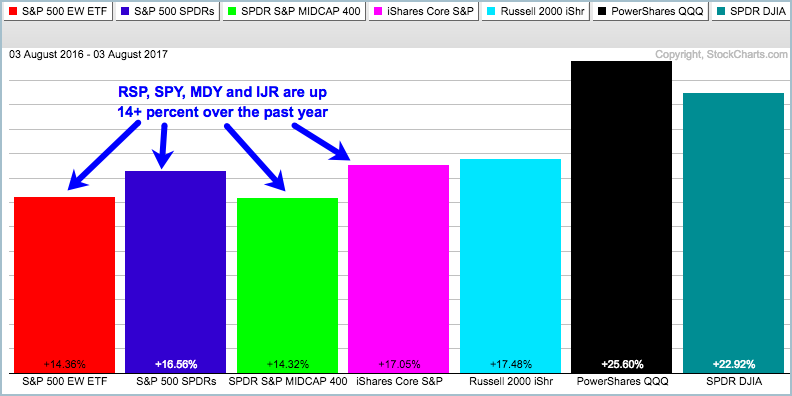
Large-caps continue to lead, but the average stock in the S&P 500 is doing just fine. The chart below shows the EW S&P 500 ETF (RSP) hitting new highs throughout 2017, just like SPY. RSP is up 14.36% over the past year and SPY is up 16.56%. Large-caps (SPY) are leading equal-weights (RSP), but the average stock in the S&P 500 is certainly not suffering. Even small-caps and mid-caps are keeping pace when measuring returns from August 2016 to August 2016 (thanks to November-December).
Underperformance becomes clear when we look at year-to-date performance (January to August). SPY and RSP are performing well and I do not think the performance discrepancy is a problem (more on that later). Mid-caps and small-caps, on the other hand, are seriously underperforming. Note that SPY (+11.5%) is up five times as much as IJR (+2.24%).
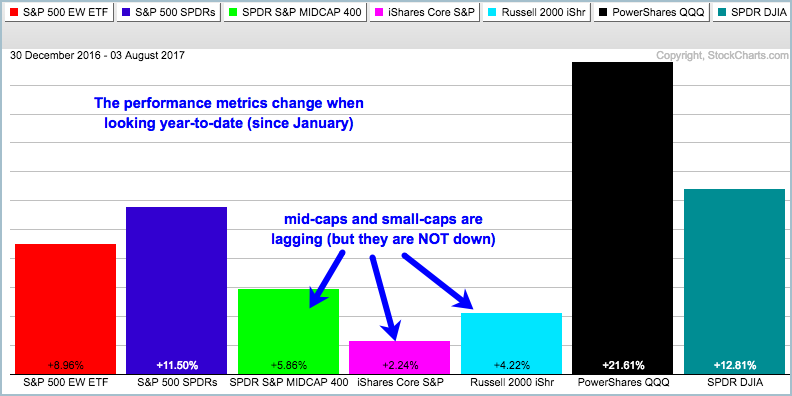
Is this big performance discrepancy a problem? So far Mister Market says, "no hay problemo". That's because Señor Market just got back from Spain. In all seriousness, note that IJR hit new highs in February, April, June and July. Thus, the trend is up and relative weakness is NOT affecting the trend or the broader market right now. This uptrend is just less pronounced (strong) than the uptrend in SPY. The S&P 500 remains the key driver for the stock market and this is where I will remain focused.
An Ugly Price Relative, but a Nice Uptrend
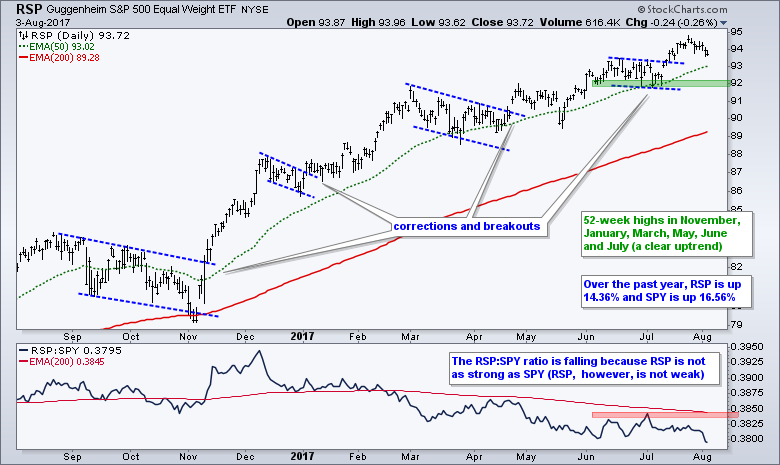
The next chart shows the EW S&P 500 ETF (RSP) hitting a new high in late July and pulling back the last nine days. The trend is clearly up with the June-July lows marking the first support level. The indicator window shows the price relative (SPY:RSP ratio) sinking to new lows this week. RSP is indeed underperforming on a percentage basis, but it is keeping up on the price chart because of the 52-week highs throughout 2017. The price chart is what really matters here. I will become concerned when/if RSP starts lagging on the price chart (i.e. not confirming SPY).
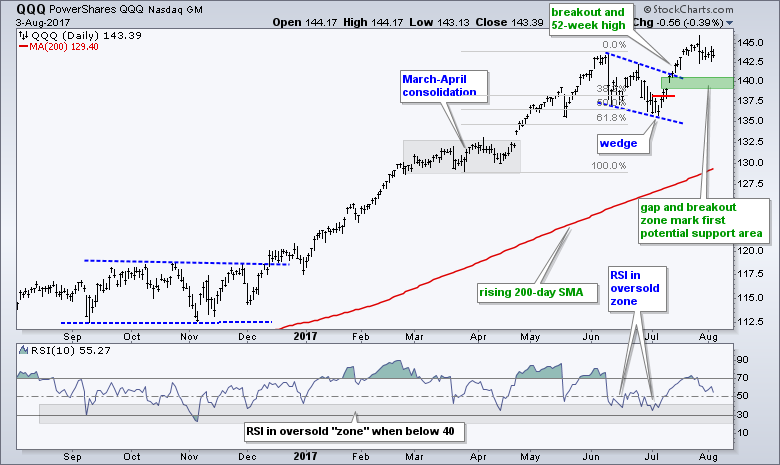
SPY and QQQ Stall Near All Time Highs
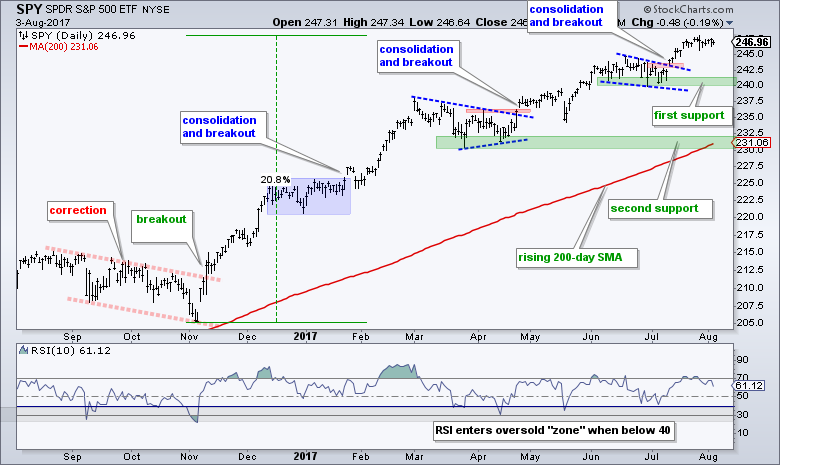
There is no change in the S&P 500 SPDR (SPY) chart as the ETF stalled over the last two weeks. The wedge breakout in mid July was the last continuation signal and the most recent new high was recorded on 27-July. First support is set in the 240 area. The March-April lows and rising 200-day moving average mark second support in the 231 area. This means actual support will probably be somewhere between these two support zones. Yes, we are all making educated guesses here.
Small-caps: We Seen this Movie Before
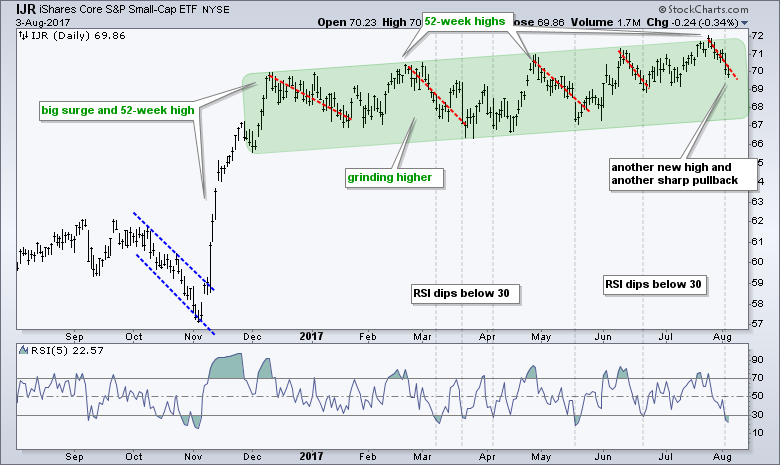
For the fifth time since December, the S&P SmallCap iShares (IJR) recorded a new high and then declined more than 3%. The green zone marks the grind higher since December and the overall uptrend. The red dashed lines mark the pullbacks after the new highs. The current pullback is already short-term oversold as 5-day RSI moved below 30. The gray lines show the previous times when RSI moved below 30. A mean-reversion long trade from here is certainly not a layup (basketball term), but it has worked pretty well so far this year and the setup is there right now.
Utes Outperform Bonds and Regionals Lag Badly
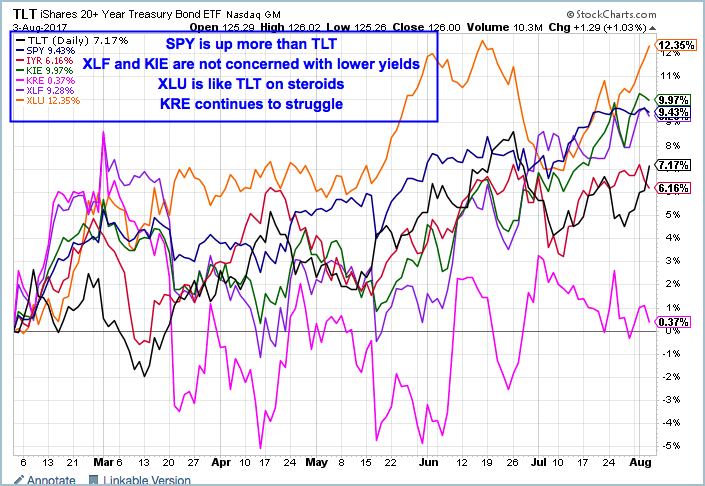
Before looking at the Finance SPDR (XLF) chart, which hit a new high on Wednesday, I would like to show a chart with the 20+ YR T-Bond ETF (TLT), S&P 500 SPDR (SPY), S&P SmallCap iShares (IJR), Insurance SPDR (KIE), Regional Bank SPDR (KRE), XLF and Utilities SPDR (XLU). First, notice that stocks and bonds are up over the last six months and stocks are outperforming bonds (+1 for stocks). Second, the rise in TLT means long-term Treasury yields fell over the last six months. Despite this decline, XLF and KIE are up. KRE, on the other hand, is the big laggard and clearly affected by falling Treasury yields. And finally, the bond proxies are strong with XLU acting like TLT on steroids. Thus, expect XLU to fall hard and KRE to bounce if TLT turns lower.
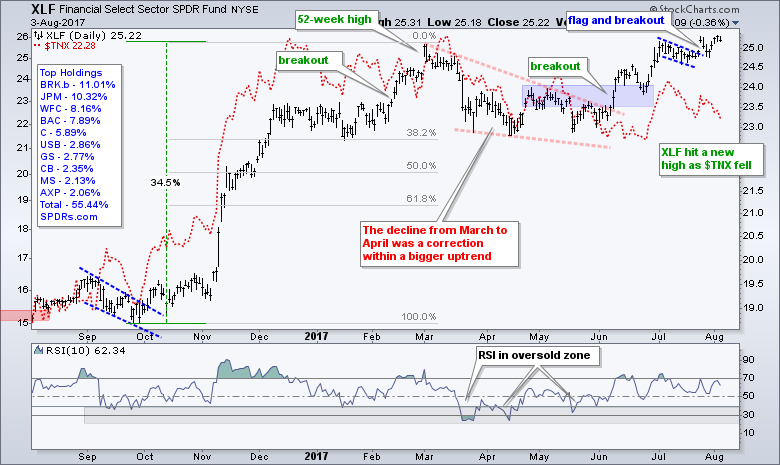
XLF Rises as 10-yr T-Yield Falls
The Finance SPDR (XLF) broke flag resistance last week, fell back to the breakout area and moved to another new high on Wednesday. Overall, the correction ended with the wedge breakout in June and the new high simply affirms the bigger uptrend. We may see some backing and filling or choppy trading, but this chart is bullish right now and this is positive for the broader market. The red dashed line shows the 10-yr T-Yield ($TNX) falling over the last four weeks. XLF and $TNX moved together from October to May, but XLF seems to have found a life of its own since June.
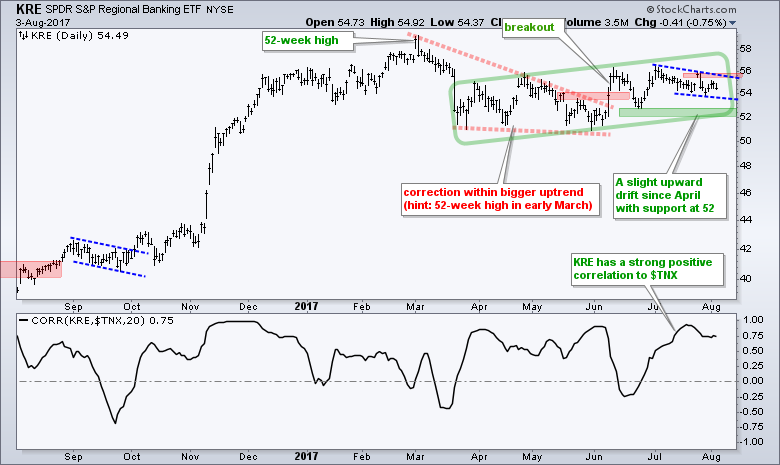
KRE Continues to Underwhelm
The Regional Bank SPDR (KRE) is one of the least strong industry groups ETFs right now. I did not say weakest because the ETF remains in a slight uptrend since mid March. Despite this excruciating grind higher, the ETF cannot seem to break free of the mid 50s because it crossed the 55 level at least eight times since mid April. The blue lines show a falling wedge and a break above 56 is needed to get more confident in this uptrend. Support remains at 52. KRE will most likely react to the bond market so traders should watch the 10-yr T-Yield for clues.
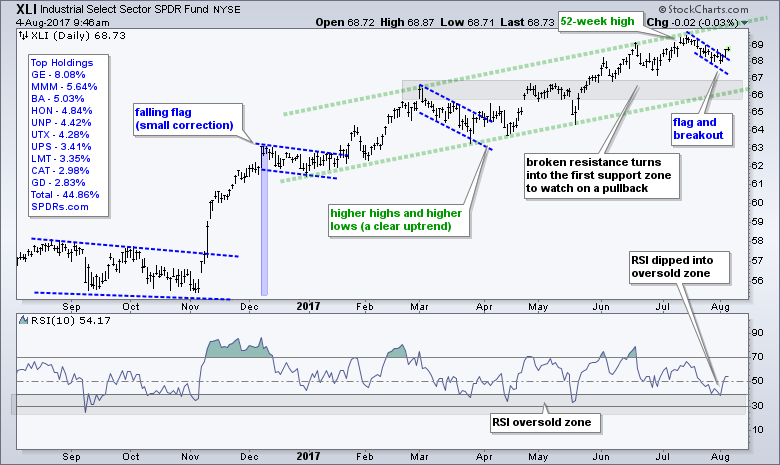
XLI Breaks Flag Resistance
The Industrials SPDR (XLI) perked up on Wednesday and broke flag resistance with a surge above 68.5. Also notice that RSI dipped into the oversold zone and bounced back above 50. The overall trend is clearly up and this latest upturn opens the door to new highs.
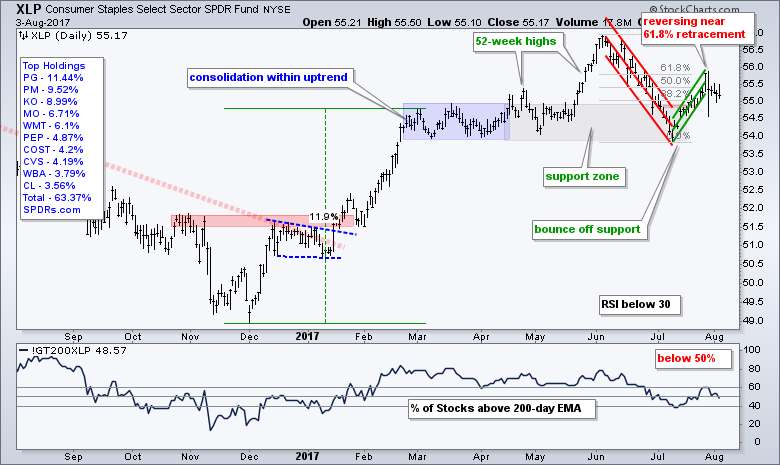
XLP Breadth Weakens
The Consumer Staples SPDR (XLP) looks vulnerable as the Staples %Above 200-day EMA (!GT200XLP) indicator dips below 50% for the second time in as many months. This indicates that more than 50% of the stocks in the sector are below their 200-day EMA. On the price chart, XLP bounced off support and retraced around 61.8% of the prior advance. This could be a counter-trend bounce and the ETF could form a lower high. Notice that XLP closed below the lower line of the Raff Regression Channel.
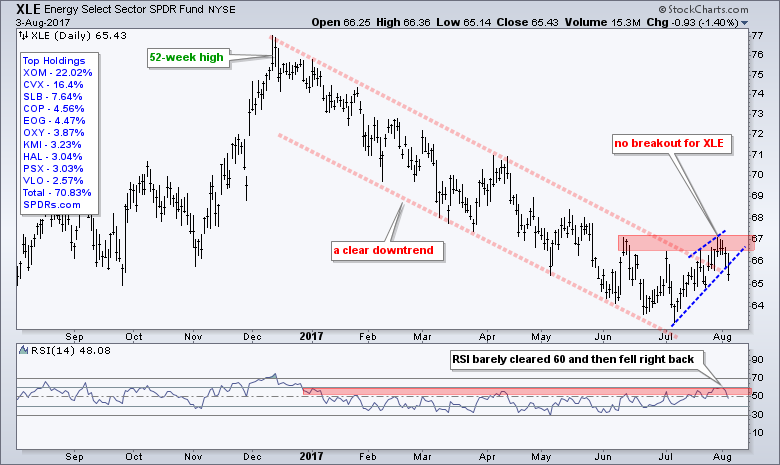
XLE Fails at Resistance
The Energy SPDR (XLE) advanced to its resistance zone in July and then turned sharply lower the last two days. The decline affirms resistance in the 67 area and this remains the level to clear for a trend reversal. The blue lines mark a rising wedge and XLE closed below the lower line on Thursday.
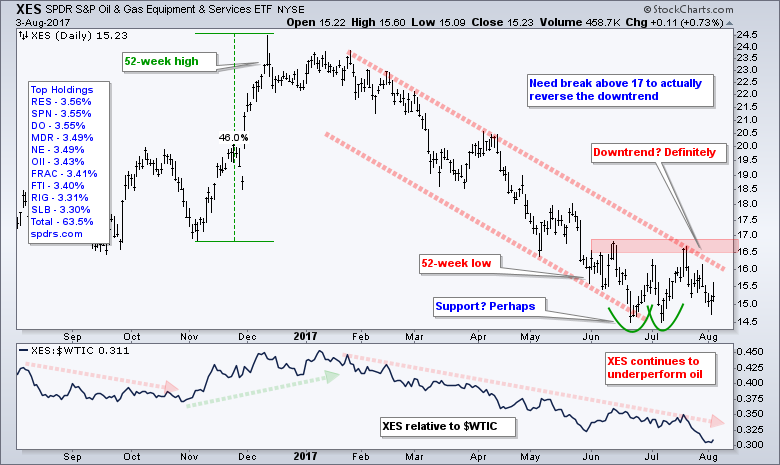
XES Continues to Underperform Oil
The Oil & Gas Equip & Services SPDR (XES) tends to be more sensitive to changes in the price of oil and sometimes acts as a front runner. Notice that XES did not break out and fell back from resistance over the last few weeks. A close above 17 is needed to reverse this downtrend and start paying attention to the energy sector. The indicator window shows the XES:$WTIC ratio moving to a new low as XES continues to underperform oil. Relative weakness in XES has been prevalent throughout the decline and I would like to see this ratio turn up before getting bullish on the energy sector.
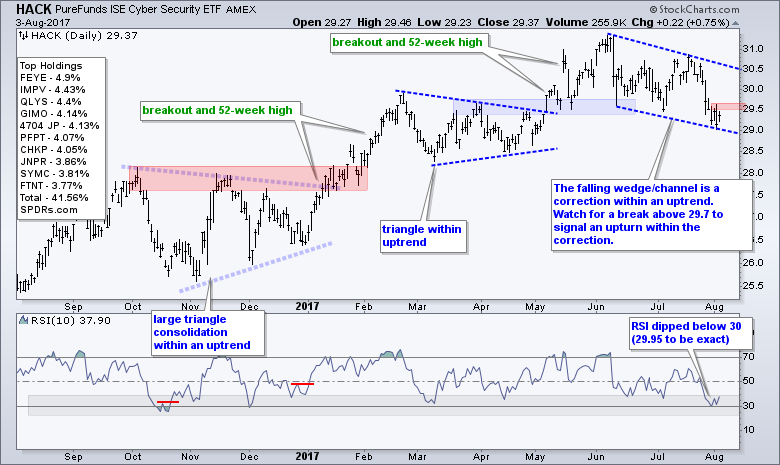
HACK with Correction Setup
The Cyber Security ETF (HACK) is at an interesting juncture because the big trend is up and the ETF became short-term oversold this week. This means the ETF corrected and a bullish setup could be emerging. The decline formed a falling channel or wedge. It does not matter which because I consider both as corrective patterns. The swing within the wedge is down after the decline the last three weeks. Look for a break above 29.7 to reverse this downswing and provide the first clue that the correction is ending.
XSD with Adam and Eve Double Top
I am going to highlight a potential double top in the Semiconductor SPDR (XSD), but I must first qualify this analysis. First and foremost, we are in a bull market and the technology sector is leading. This argues against bearish reversal patterns. Second, the double top is simply in the process of being formed and is not yet confirmed. In other words, it is an incomplete pattern and the bigger uptrend remains in place right now. Broken resistance turns into support, as does the July low. A close below support would confirm the double top and argue for further weakness. As the red parabolas show, a spike marks the first high (Adam) and a flatter peak marks the second high (Eve). This is what Thomas Bulkowski called an Adam and Eve double top.
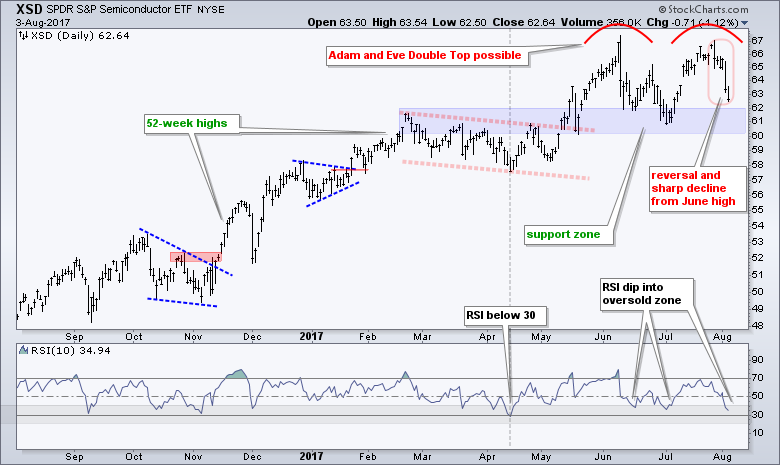
Despite the sharp decline over the last six days, the real play here may be for a short-term oversold bounce (mean reversion). RSI moved into the oversold zone and XSD is nearing its support zone.
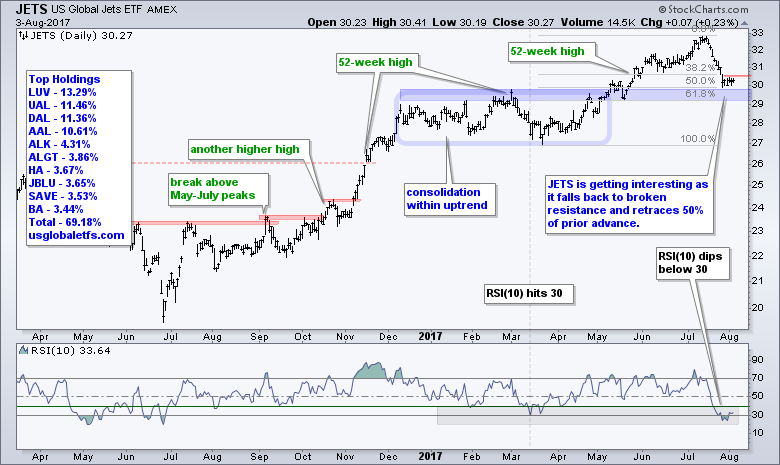
JETS Pulls Back to Breakout Zone
Speaking of pullbacks within an uptrend, the Airline ETF (JETS) hit a 52-week high and then fell around 10% with a move back to 30. This decline is sharp and looks bad from a short-term perspective, but it looks like a pullback within a bigger uptrend from a longer-term perspective. Notice that broken resistance turns support in the 29-30 area and the 50-61.8% retracement zone also resides here. In addition, RSI moved below 30 to become oversold. This makes the blue zone ideal for a reversal.
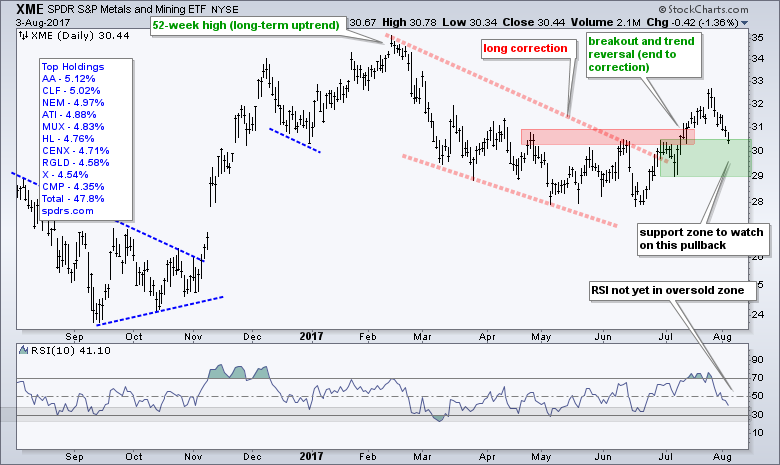
XME Pulling a Throwback
The Metals & Mining SPDR (XME) is one to watch because it broke out with a surge in July and pulled back to the top of its support zone this week. I think the wedge breakout ended the correction and signaled a resumption of the bigger uptrend. Marking support on this throwback is a challenge with the 30 area being my best guess. Chartists can also watch for RSI to dip into the 30-40 zone for a short-term oversold signal.
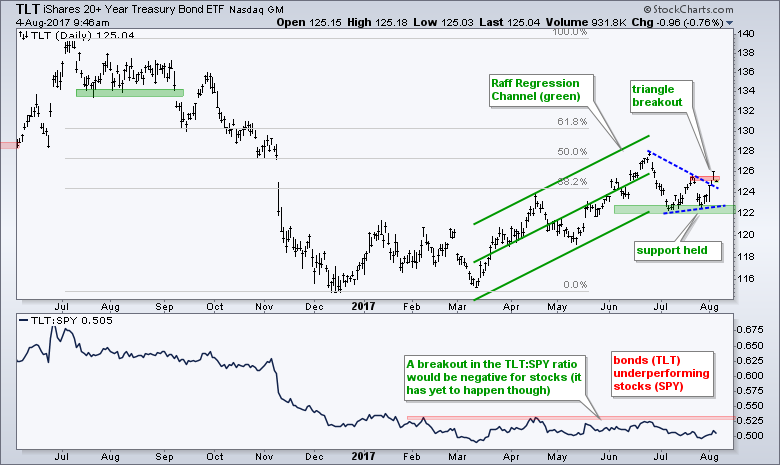
TLT Bounces off Support Zone
The 20+ YR T-Bond ETF (TLT) surged to 126 this week and broke triangle resistance. I made a bearish call on TLT last week and this triangle breakout has negated the setup. Perhaps my bearish call was just a little early, which is another way of saying wrong. Anyhow, TLT is trading down around 85 cents at the 125.15 level today so this triangle breakout may not hold. The July lows and Raff Regression Channel mark support in the 122-123 area. A close below 122 would clearly reverse the uptrend and signal a continuation of the July-December decline.
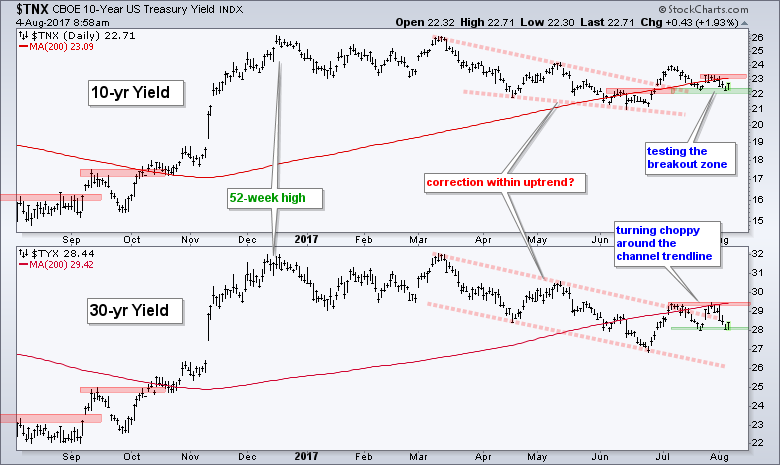
Pro Tip on the 10-yr T-Yield
Data for the 10-yr T-Yield ($TNX) comes into StockCharts about an hour before stocks open and chartists can get a bond market preview on this chart. I am writing this about 30 minutes before the open and you can see a bounce in the 10-yr T-Yield ($TNX) and 30-yr T-Yield ($TYX) today (Friday morning). $TNX is bouncing off support in the 22 area (2.2%). $TYX is battling the channel line and needs to clear 29.5 (2.95%) to trigger a clean upside breakout.
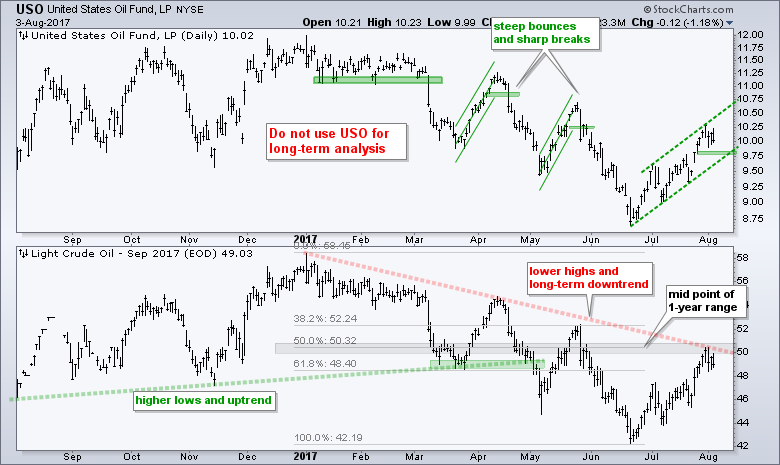
Oil Gets Stuck in the Middle
September Crude (^CLU17) is in a long-term downtrend and hitting resistance in the $50 area. The long-term trend is down with lower lows and lower highs throughout 2017. The current bounce is big in percentage terms, but crude remains below the May high. I do not view the red trend line has a strong resistance level, but it fits the narrative. Note that trend lines simply reflect the rate of descent or ascent with their steepness. The gray zone marks the mid point of the one year range. There was support in the 48-50 area in 2016 and resistance in the 50-52 area in 2017. With the bigger trend clearly down, I would expect crude to hit resistance sooner rather than later and turn back down.
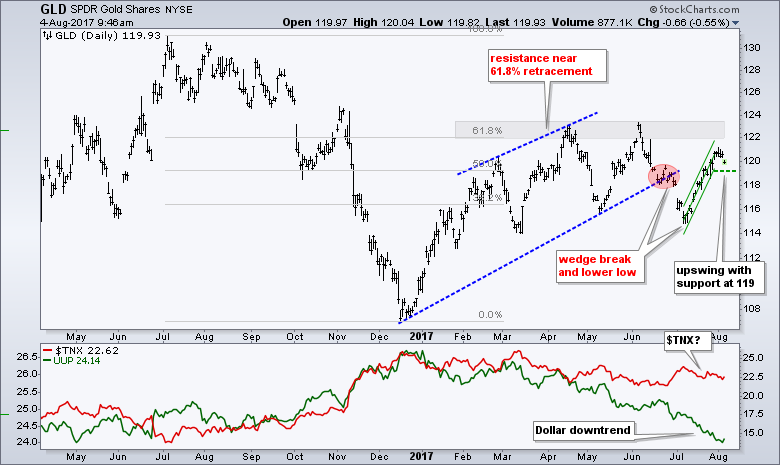
GLD Bounces Towards Resistance Zone
The Gold SPDR (GLD) is trading lower in early trading today because it is positively correlated with the 20+ YR T-Bond ETF (TLT), which is also down. Overall, GLD broke the wedge line and then bounced back above 120. The bounce certainly looks strong, but the ETF hit resistance in the 120-124 area in February, April and June. The green Raff Regression Channel marks the upswing with support set at 119. A break here would reverse the short-term uptrend and put the bigger wedge break back in play. Again, watch TLT for clues because there is a strong positive correlation between GLD and TLT. There is no need to chart the Dollar because UUP remains in a strong downtrend.
******************************************************
ETF Master ChartPack - 300+ ETFs organized in a Master ChartList and in individual groups.
Follow me on Twitter @arthurhill - Keep up with my 140 character commentaries.
****************************************
Thanks for tuning in and have a good day!
--Arthur Hill CMT
Plan your Trade and Trade your Plan
*****************************************


