 |
.... RSP Takes a Big Hit after New High .... Small-caps and Mid-caps Lead Breadth Lower .... AD Volume Lines Turn Down .... SPY Closes below 50-day EMA .... IJR Pulls Back within Grinding Uptrend .... Sector Balance Remains Long-term Bullish .... Finance, Technology and Utilities Lead .... Industrials-Healthcare Correct within Uptrends .... Consumer Staples is the Second Weakest Sector .... TLT Holds Triangle Breakout .... Gold Challenges Resistance Zone .... Oil Stalls at midpoint of Range .... Dollar Bounces as Yen Turns Up .... |
----- Art's Charts ChartList (updated 11-August) -----
RSP Takes a Big Hit after New High
Stocks were hit hard this week with the EW S&P 500 ETF (RSP) suffering its biggest decline since early November. RSP is down 2.18% over the last 10 trading days and down 1.70% so far this week (4 trading days). Even with these losses, the ETF is still less than 3% from a 52-week high and in an uptrend overall. The chart below shows the last time RSP hit a new high and then declined over 2% in one week (September 2016). Stocks bounced the following two to three weeks and then fell in October. This mild correction lasted nine weeks and RSP fell around 5%. A nine week correction now would extend to the end of September.
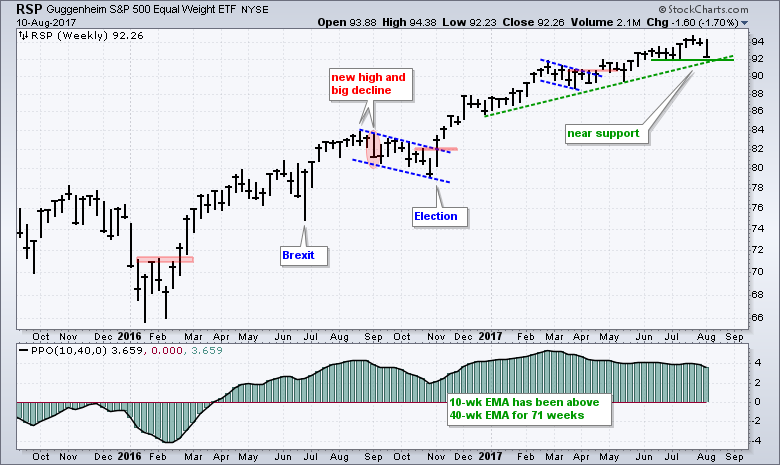
This week has one more trading day and we cannot build a strategy on one prior instance, but stocks are ripe for a correction and we are in a seasonally weak period. The green dashed trend line and June lows mark first support around 92. A break here could signal the start of a correction in the broader market. The indicator window shows the PPO(10,40,0) in positive territory over the last 71 weeks. This means the 10-week EMA has been above the 40-week EMA.
Small-caps and Mid-caps Lead Breadth Lower
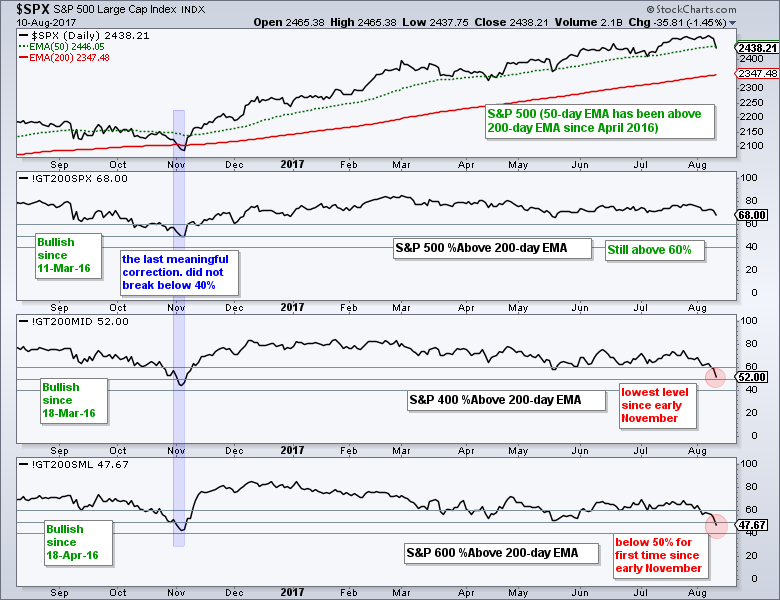
The next three charts focus on breadth indicators for the S&P 1500, S&P 500, S&P Mid-Cap 400 and S&P Small-Cap 600. The S&P 1500 is used to gauge broad market breadth and I then break down the S&P 1500 into three parts (large-caps, mid-caps and small-caps).
The first chart shows the Percentage of Stocks above the 200-day EMA. Note that I do not have the %Above the 200-day EMA for S&P 1500. The indicator turns bullish with a move above 60 and stays bullish until a move below 40%. All three have been on bull signals since March-April 2016, but we are seeing some serious deterioration within the S&P Small-Cap 600 and S&P Mid-Cap 400. The first chart shows the Small-Cap %Above 200-day EMA (!GT200SML) dipping below 50% for the first time since early November. Thus, more than 50% of stocks in the S&P Small-Cap 600 are below their 200-day EMA and this is net negative for small-caps. $SML is clearly the weakest of the three right now. The S&P 500 %Above 200-day EMA (!GT200SPX) is holding up and still well above 60%.
The next breadth indicator shows the 10-day EMA of AD Percent (advances less declines divided by total issues). A bullish thrust triggers with a move above +30% and a bearish thrust with a move below -30%. The indicator for the S&P 1500 triggered bullish on 3-March-16 and remains on a bull signal. The indicator fell to its lowest level of the year and this means selling pressure over the last ten days was the broadest of the year. The red shading shows prior dips in early November 2016 and early March 2017. Stocks bottomed in early November, but a mild correction unfolded in March-April.
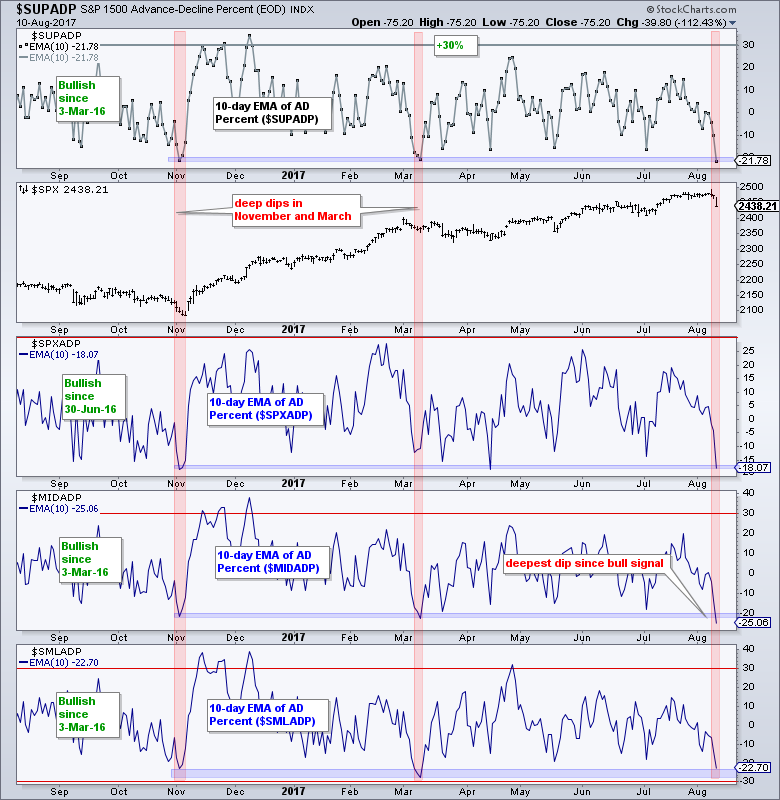
Chartists can see the indicator values on the right side of the chart. The 10-day EMA for $SPXADP is at -18.07%, the 10-day EMA for $MIDADP is at -25.06% and the 10-day EMA for $SMLADP is at -22.70%. Thus, mid-caps fared the worst. Two of the three need to break below -30% to signal a bearish breadth thrust.
AD Volume Lines Turn Down
The final indicator is the AD Volume Line, which is a cumulative measure of net advancing volume (advancing volume less declining volume). I prefer this indicator to total volume because the AD Volume Line measures net buying pressure or money flow. The S&P 1500 AD Volume Line is testing its June low and the S&P 500 AD Volume Line is just above its June low. Breaks here would be negative for the indicator. The S&P Small-Cap AD Volume Line and S&P Mid-Cap AD Volume Line both broke below their June lows this past week. This confirms that selling pressure is stronger in small-caps and mid-caps.
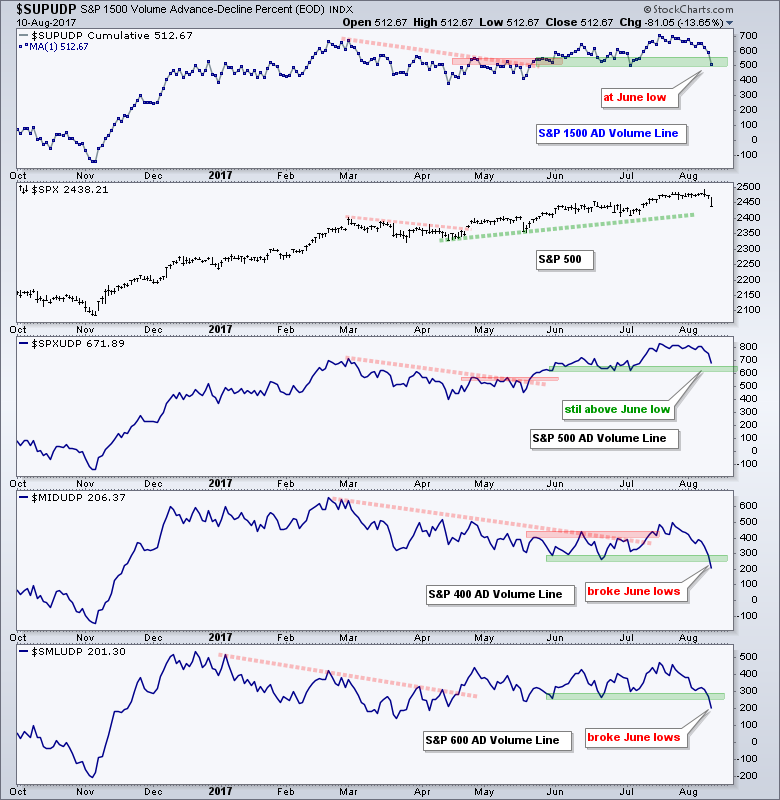
Overall, breadth has clearly deteriorated in small-caps and mid-caps, but we have yet to see bearish signals in the %Above 200-day EMA indicators or the AD Percent indicators. Such signals would suggest that an extended correction or downturn is unfolding. The AD Percent indicators are usually the first to trigger signals so I will be watching these closely over the next week or two because they are near make-or-break levels.
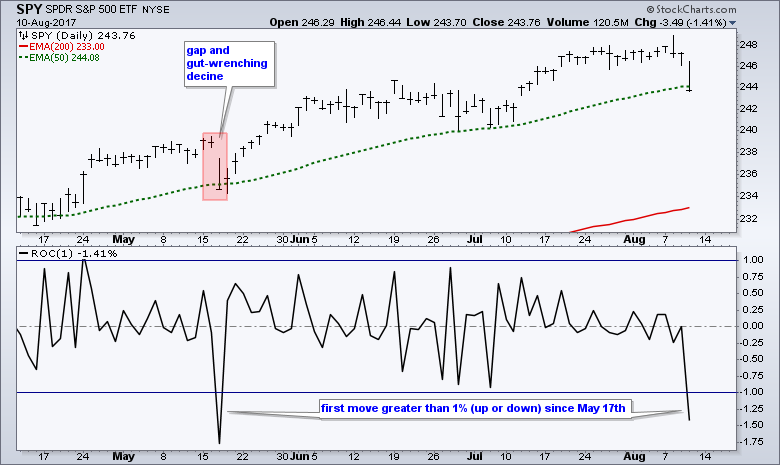
SPY Closes below 50-day EMA
The S&P 500 SPDR (SPY) hit a new high on Tuesday and then fell 1.41% on Thursday, and closed below its 50-day EMA in the process. This is the sharpest decline since May 17th and also the first time the ETF has moved more than 1% (up or down) since May 17th. Note that the decline on May 17th ended on May 18th as SPY closed back above the 50-day EMA. Yes, the gap down and gut-wrenching decline on May 17th ended the next day. Dips below the 50-day EMA are more likely opportunities than threats when the bigger trend is up (50-day EMA>200-day EMA).
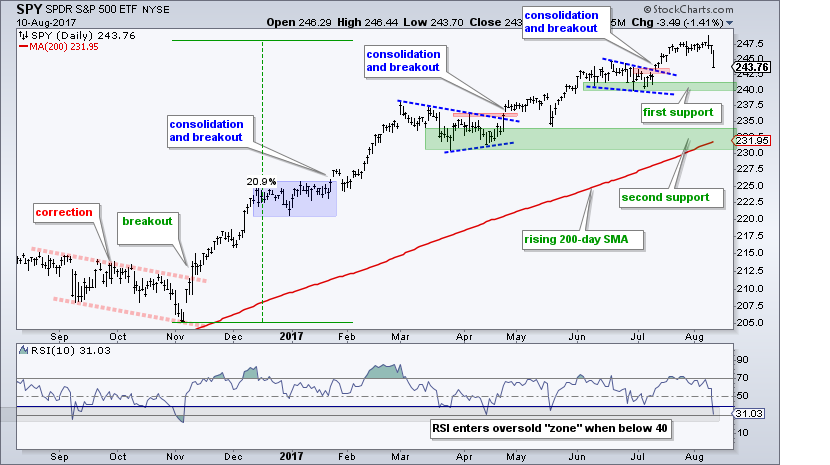
The next chart uses the June lows to mark first support in the 240 area. Note that this support zone is based on the lows from the last consolidation. It is hard to argue for a downtrend until these lows are broken. These June lows are also "benchmark" lows that we can use to compare against other charts. Stocks and ETFs that already broke their June lows show relative "chart" weakness. Stocks and ETFs holding above their June lows are holding up.
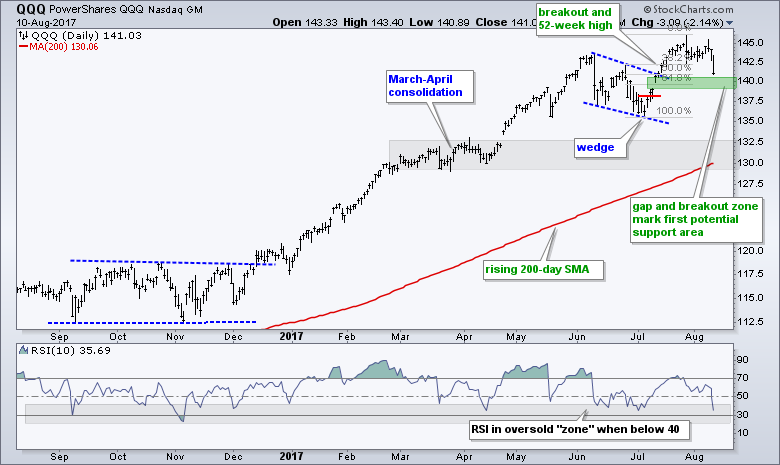
QQQ also fell sharply with a decline greater than 2%. Overall, the ETF broke out of a wedge in early July and hit a new high in mid July. The breakout zone and the 50-61.8% retracement zone turn into the first potential support zone to watch.
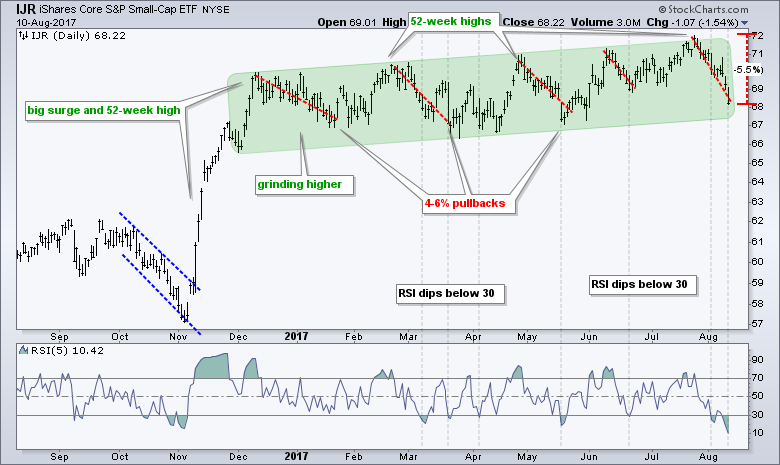
IJR Pulls Back within Grinding Uptrend
The S&P SmallCap iShares (IJR) led the market lower over the last 12 trading days with a 5.5% decline from high the low. Even so, there is no real change in the overall chart. IJR remains within a grinding uptrend since December. There were three 4-6% pullbacks within this uptrend and the current decline is the fourth. This decline is, however, a little bit different because it was strong enough to push RSI(5) to its lowest reading in over year.
Sector Balance Remains Long-term Bullish
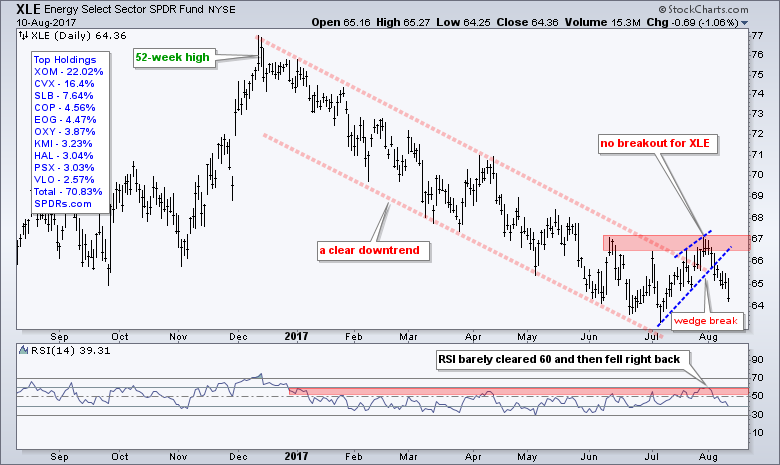
Eight of the nine sector SPDRs are above their 200-day EMAs, but only three of the nine are above their 50-day EMAs (XLF, XLK, XLU). In other words, six of the nine declined below their 50-day EMAs. Nonetheless, the 50-day EMA is above the 200-day EMA for eight of the nine sector. Thus, the long-term trends are still up for the vast majority of sectors and the recent moves below the 50-day EMA may be setting up the next opportunity. Think pullback within a bigger uptrend. Energy is the only sector trading below both the 200-day EMA and the 50-day EMA. Energy is the only one in a clear and present downtrend. The chart below shows XLE breaking the wedge line last week and continuing lower this week.
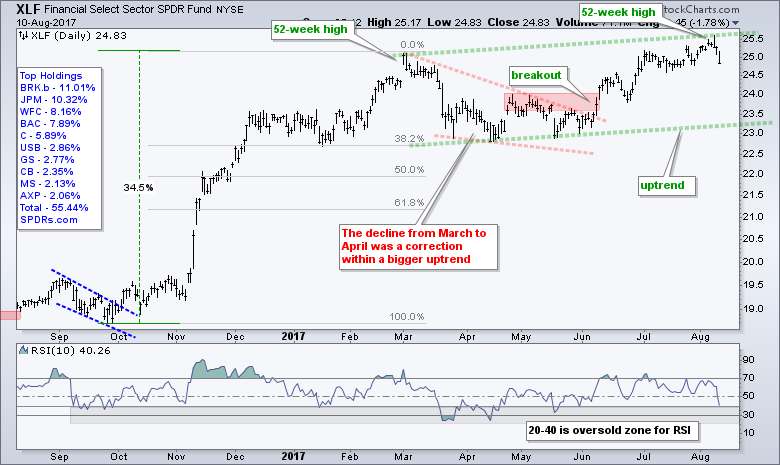
Finance, Technology and Utilities Lead
Finance, technology and utilities are the strongest sectors because these three hit new highs this week. The Finance SPDR (XLF) hit a new high on Tuesday and then fell sharply on Thursday. XLF could correct back to the 24 area and still be within a rising channel.
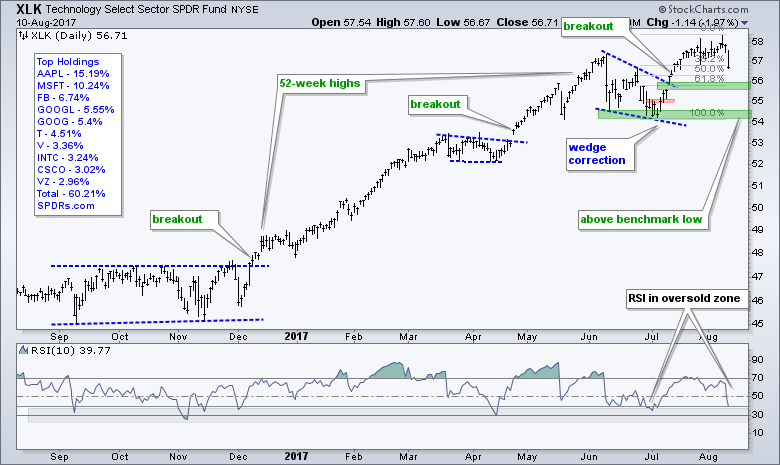
I marked first support in the 56 area for the Technology SPDR (XLK). This stems from the wedge line breakout, the gap and the 61.8% retracement. The June lows are benchmark lows and XLK is well above these lows (holding up well overall).
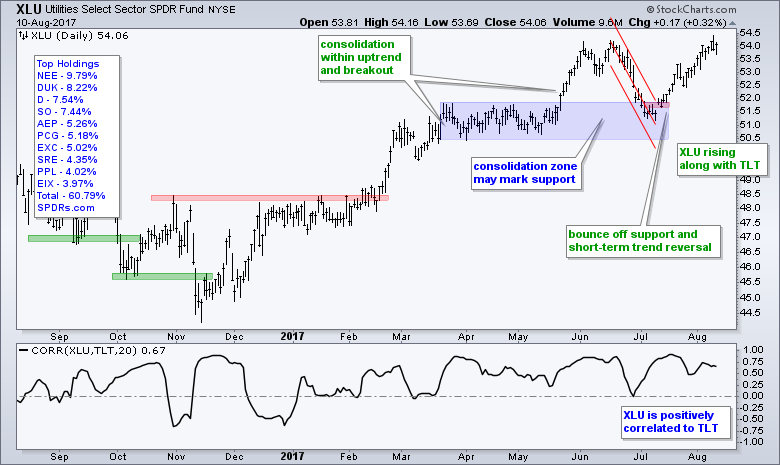
The Utilities SPDR (XLU) could be considered the strongest of the three because it moved higher on Thursday. XLU is a bond proxy and positively correlated to the 20+ YR T-Bond ETF. Overall, XLU broke out with the surge in mid July and hit a new high on Tuesday-Wednesday. I would expect further gains as long as TLT moves higher.
Industrials and Healthcare Correct within Uptrends
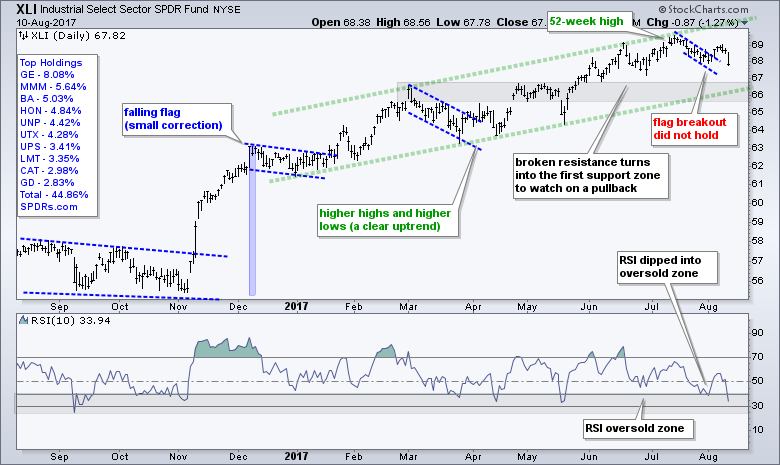
The Industrials SPDR (XLI) is lagging the top three because it did not record a new high this month and the flag breakout did not hold. These are short-term issues, not long-term problems. The overall trend is up with the rising channel and broken resistance zone marking support in the 66 area.
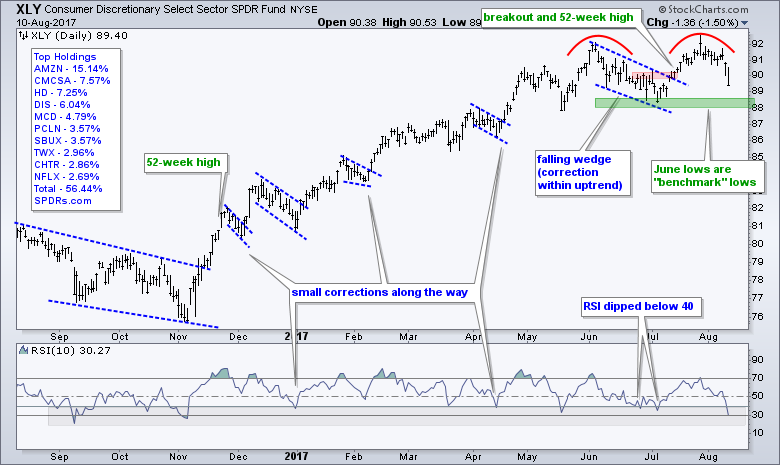
The Consumer Discretionary SPDR (XLY) hit a new high in July and then fell sharply over the last 12 days. The June lows and a buffer mark support in the 88-88.5 area. A break here would then raise the possibility of a double top reversal.
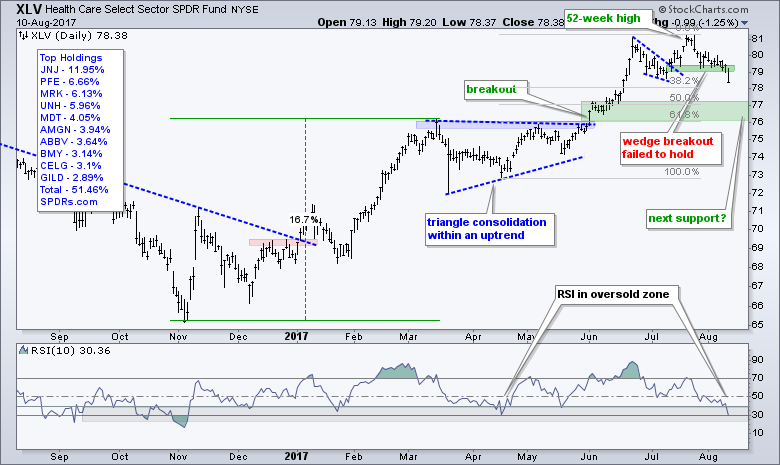
The HealthCare SPDR (XLV) failed to hold its wedge break and fell below the mid July high. Again, this is a short-term issue because the bigger trend is still up. The breakout zone and 50-62% retracement zone mark the next support area to watch around 76-77.
The Materials SPDR (XLB) hit a new high with a gap-surge on July 25th, but this gap did not hold as the ETF fell back below 54 this week. RSI is near 30 and the ETF is near a support zone marked by broken resistance.

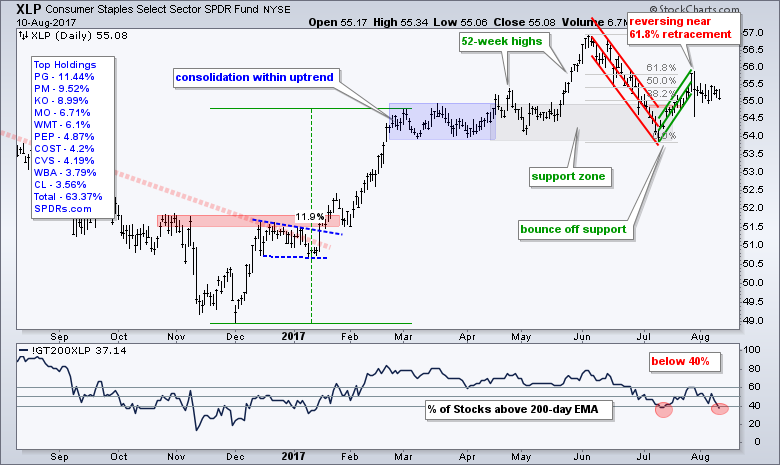
Consumer Staples is the Second Weakest Sector
The Consumer Staples SPDR (XLP) is perhaps the least strong of the eight sectors that are in long-term uptrends. XLP bounced off support in early July, but peaked near the 61.8% retracement in late July and stalled the last eight days. This looks like a good spot for a downturn. Also note that breadth is weak because Staples %Above 200-day EMA (!GT200XLP) moved below 40% again.
TLT Holds Triangle Breakout
The 20+ YR T-Bond ETF (TLT) broke the triangle line last week, fell back a little and then surged over the last two days. Thus, the triangle breakout is holding and TLT remains in bull mode. The Raff Regression Channel and July lows combine to mark support in the 122 area.
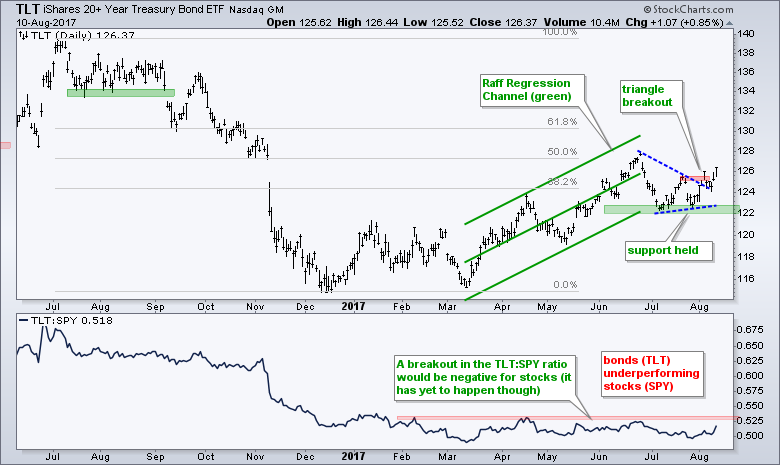
The indicator window shows the TLT:SPY ratio hitting a new low in March and flattening out the last six months or so. Treasuries are not outperforming stocks though and this is still net positive for stocks. The trouble could start if/when the TLT:SPY ratio turns up and breaks out.
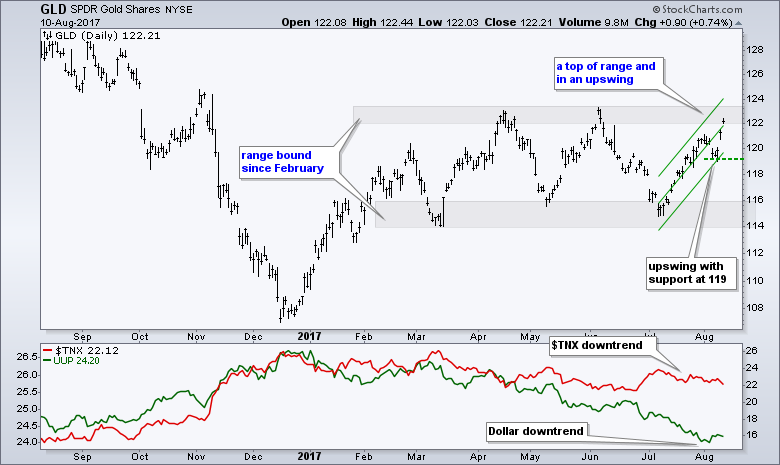
Gold Challenges Resistance Zone
Gold moved higher along with Treasuries this week. Overall, the Gold SPDR (GLD) remains stuck in a trading range with resistance in the 122-124 area and support in the 114-116 area. The swing within this range is clearly up with the Raff Regression Channel marking support at 119. A break below 119 would reverse this upswing.
Oil Stalls at midpoint of Range
There is no change in oil as September Crude (^CLU17) hit the midpoint of its 12-month range and stalled the last two weeks. The overall trend is down with lower lows and lowers highs extending back to early 2017. The 20% rally from the 42 area looks impressive short-term, but this rally started from a 52-week low and oil is still below its May high. Short-term, the USO Oil Fund chart (top) marks upswing support at 9.75. A break here would reverse the short-term uptrend.

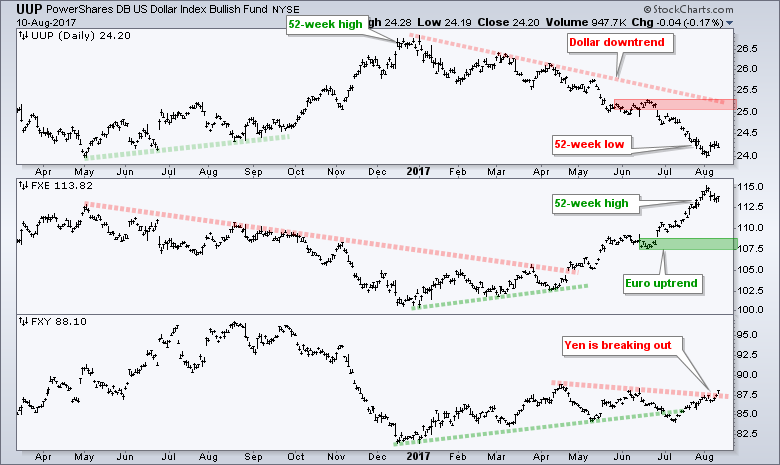
Dollar Bounces as Yen Turns Up
The US Dollar ETF (UUP) got an oversold bounce last Friday and then stalled the last four days. This bounce could extend further because the Dollar is quite oversold and the Euro is quite overbought. The Yen ETF (FXY) turned up over the last three days and broke the trend line extending down from mid April. The Yen is considered a safe-haven currency and may be benefitting from the geo-political events.
******************************************************
ETF Master ChartPack - 300+ ETFs organized in a Master ChartList and in individual groups.
Follow me on Twitter @arthurhill - Keep up with my 140 character commentaries.
****************************************
Thanks for tuning in and have a good day!
--Arthur Hill CMT
Plan your Trade and Trade your Plan
*****************************************


