
 |
---- An Attempt to Lower the Drawdowns |
An Attempt to Lower the Drawdowns ----
Last week I presented a trend-momentum strategy that used profit targets to lock in gains. I was pleased with the returns, but not happy with the drawdowns because they were relatively high. I suspect that this is because I am using Rate-of-Change to measure momentum and this is increasing volatility within the portfolio. Today I am trying to reduce portfolio drawdowns by using RSI to rank and select stocks. In contrast to Rate-of-Change, RSI dampens volatility because it is normalized and measures the gains relative to the losses.
Strategy Review
Last week's System Trader article used the Rate-of-Change (ROC) indicator for a momentum strategy trading stocks in the S&P 500. Please refer to the original article for full details. Basically, the system filters stocks in the S&P 500, ranks them by the Rate-of-Change and buys the stocks with the highest Rate-of-Change (momentum).
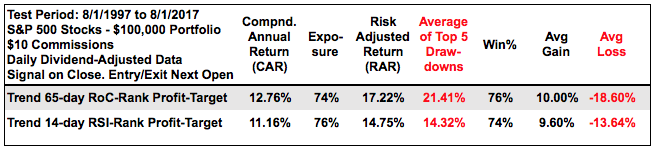
Instead of a stop-loss and/or trailing stop-loss, the system takes profits when the percentage gain reaches 10% or exits the trade when the 25-day EMA crosses below the 125-day EMA. Upon exit, the S&P 500 is scanned again and the stock with the highest Rate-of-Change becomes the new position. For reference, the table below shows backtest results using 65-day ROC and 125-day ROC.
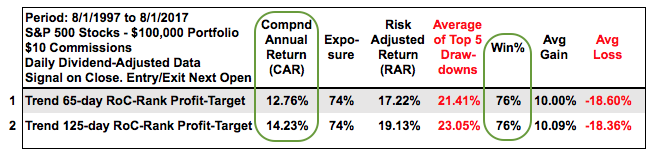
The Compound Annual Return is very good for both systems, as is the 76 percent win rate. I am, however, not happy with the average drawdown, which exceeds 21%.
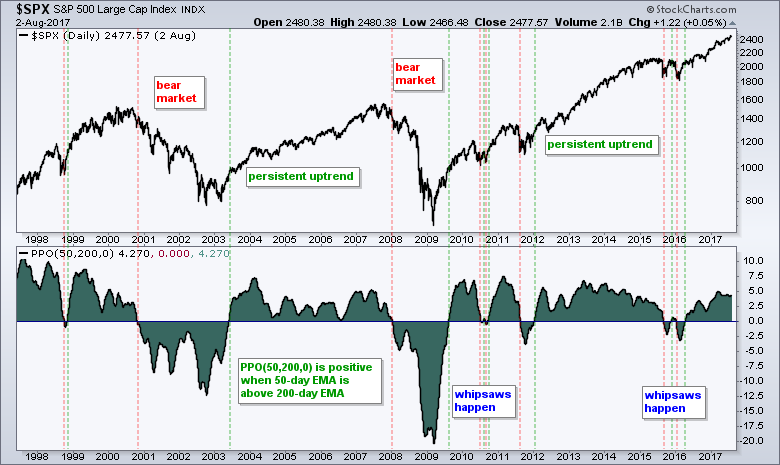
There are many ways to measure the success or failure of a trading system. One of my goals is to have a Risk-adjusted Return that is equal to or greater than the Average Drawdown. The Risk-adjusted Return is basically the Compound Annual Return divided by the exposure. These two systems were exposed to the market (invested) when the 50-day EMA of the S&P 500 was above the 200-day EMA, which was 74% of the time from August 1997 to August 2017.
Consulting, Software and Data
System development is a time consuming, yet rewarding, endeavor with far more failures than successes. There are dozens of testing rounds before the final systems are presented. In addition to the development process, the results need to be verified by going through the trades and making sure the system is working right. This means checking signals, entries, exits and rankings on particular days. It is a true labor of love!
Cesar Alvarez of AlvarezQuantTrading.com provided invaluable feedback during the system development and the verification process. Cesar has a great blog and provides consulting services for system development click here. I used Amibroker to test the code and Premium Data from Norgate. Just like StockCharts, the data is adjusted for dividends to reflect the total return.
Rate-of-Change versus RSI
Rate-of-Change (ROC) is one of the purest momentum indicators available. However, it does not do a good job of filtering out volatility because the stocks with the highest Rate-of-Change are often the most volatile. Think Nvidia (NVDA), NRG Energy (NRG), Vertex Pharma (VRTX) and Align Technology (ALGN). These stocks are certainly high flyers and in uptrends, but they are not for the faint of heart.
The Relative Strength Index (RSI) is a momentum oscillator created by Welles Wilder and introduced in his 1978 book, New Concepts in Technical Trading Systems. It is called the "Relative" Strength Index because the indicator measures a stock's gains relative to its losses using a ratio. Basically, RSI measures internal strength or weakness by comparing the magnitude of the gains to the magnitude of the losses. This indicator is then normalized so it ranges between zero and one hundred. In contrast to Rate-of-Change, RSI does a much better job adjusting for volatility.
The table below shows scan results ranked by the 65-day Rate-of-Change on the left and 14-day RSI on the right. Scan code is available at the end of this article. There are plenty of high flyers on the Rate-of-Change side (left) and none of the stocks come from the consumer staples sector. The right side of the table shows a ranking by 14-day RSI and this list is quite different.
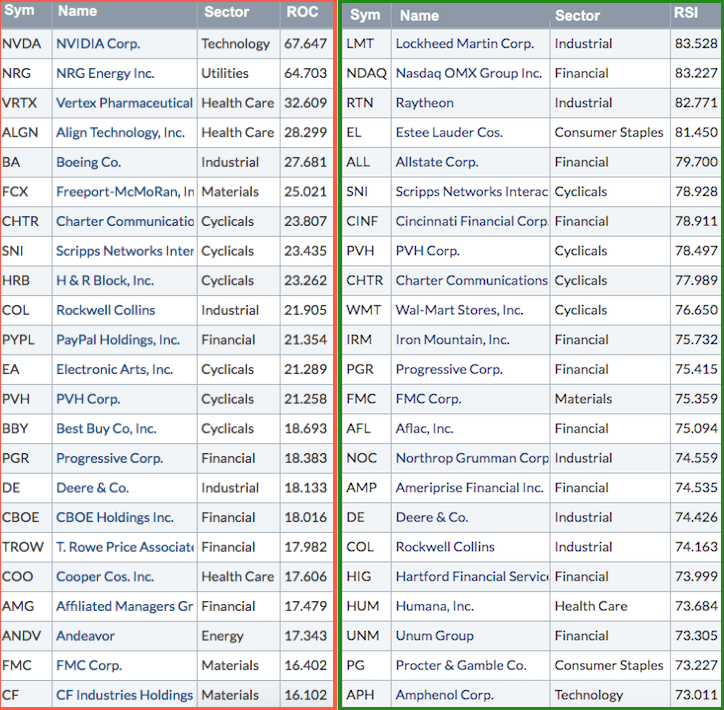
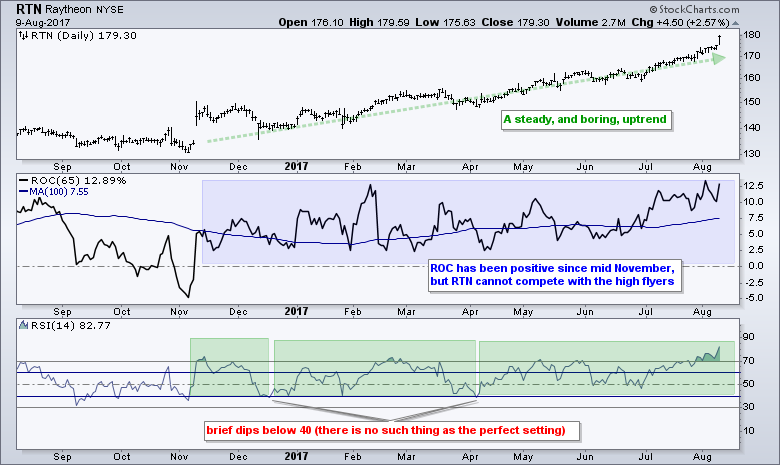
First, there are two stocks from the consumer staples sector and Wal-mart made the top ten (10th spot). Second, there are some boring defense stocks with very stable uptrends (LMT, RTN, ROC, COL). Third, there are some insurance stocks, which are also in steady and boring uptrends (ALL, PGR, AFL, HIG). Frankly, the RSI list looks a lot more boring than the ROC list. But.....boring is not always bad.
A High-Flyer versus a Boring Uptrend
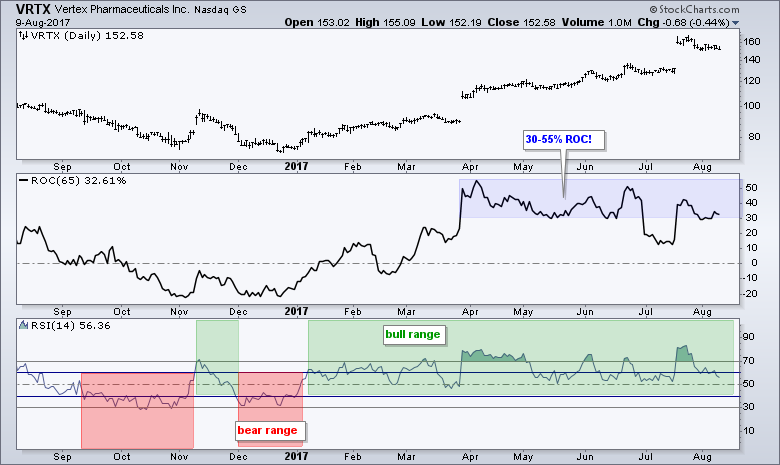
The chart below shows Vertex with the 65-day Rate-of-Change and 14-day RSI. Note that VRTX ranked 3rd for 65-day ROC. In general, ROC favors the bulls when positive and the bears when negative. RSI has a bull range between 40 and 100 and a bear range between 60 and 0. RSI moved into its bull range in mid January and remains in its bull range. Meanwhile ROC surged above 50% in March and has been between +30% and +55% most of the time since then.
The next chart shows Raytheon, which ranked 3rd for 14-day RSI. Notice that the 65-day Rate-of-Change never exceeded 15% and spent most of its time in the 5-8% area (100-day SMA). Clearly, RTN cannot complete with high flyers like Vertex and would not make the top tier of the Rate-of-Change ranking. The RSI ranking is a different story because RSI moved above 70 several times from November to August. In addition, RSI has been above 70 for eight days now.
Rate-of-Change is a pure momentum indicator that rewards volatility. RSI is also a momentum indicator, but it tempers volatility by weighing the gains against the losses. RSI, however, is not quite volatility neutral. Slower moving and less volatile stocks are less likely to see their RSI readings hit extremes (below 30 and above 70). High flying and fast moving stocks, on the other hand, are more likely to see their RSI readings hit extremes.
Testing with 14-day RSI Rank
The table below shows results for last week's backtest using 65-day Rate-of-Change for ranking and the same system using 14-day RSI for ranking. The RSI system has a lower Compound Annual Return and a much lower average drawdown. In fact, the average drawdown is now less than the Risk-adjusted Return.
Also note that the RSI system traded a lot less than the Rate-of-Change system. There were 1707 trades in the Rate-of-Change system and the average trade was held 47 days. In contrast, there were 1270 trades in the RSI system and the average trade was held 63 days. It is clearly a less active system, but sometimes a little less trading can be beneficial. In my opinion, the 14-day RSI system is more robust than the 65-day ROC system.
Conclusions and Caveat Emptor
There is clearly some value in using RSI to rank performance. I chose 14-day RSI because it is the default setting and it tested well. Note that I also tested other RSI settings and even ran an optimization to find the best setting (5 to 100 days). 75-day RSI had the lowest Compound Annual Return (10.15%) and 45-day RSI had the highest CAR (11.84%). Thus, the period setting for RSI is actually not that important.
Portfolio level backtesting means I am testing a basket of stocks. I never know which picks will be winners and which will be losers. It is a shotgun approach to stock picking. These systems are profitable because the profit from the winners exceeds the losses from the losers, and because there are more winners than losers. Also note that the results are based on taking every trade and sticking with the system, which is hard in real life. And finally, keep in mind that past results do not guarantee future results.
Scan Code
Here is the scan code for filtering stocks in the S&P 500 and then ranking by 14-day RSI.
// set stock universe[group is SP500]// weed out extremely high volatilityAND [Std Deviation(250) / SMA(20,Close) * 100 < 20]// weed out low-priced stocks//AND [SMA(20,Close) > 10]// insure daily Dollar Volume is greater than $5 millionAND [SMA(20,close) * SMA(250,volume) > 5000000 ]// weed out stocks that have already doubledAND [ROC(65) < 100]// only stocks that are in long-term uptrendAND [EMA(25,close) > EMA(125,close)]// rank results by RSIRank by RSI(14)
******************************************************
Thanks for tuning in and have a good day!
--Arthur Hill CMT
Plan your Trade and Trade your Plan
******************************************************
Other Articles in the SystemTrader Series:
- Introduction to Key Performance Metrics
Quantifying the Golden Cross for the S&P 500 - Golden Cross and 5 Major Indexes
EMAs versus SMAs - Do Short Positions Add Value? - Setting up Momentum Scans, Creating ChartLists and Exporting Lists.
Differences in Major Indexes - Do Trend Filters Work? - MACD Crosses
Rules to Reduce Drawdowns and Increase Gains - Testing PPO Strategy - Follow me on Twitter @arthurhill
Keep up with my 140 character commentaries.


