
Most of us are familiar with positive and negative divergences in momentum indicators. These divergences suggest that directional momentum is slowing and there could be a trend reversal. There is just one problem. Most divergences are at odds with the bigger trend. Most negative divergences form in an uptrend and most positive divergences form in a downtrend. Thus, most divergences are betting on a trend reversal instead of a trend continuation. Chartists working under the assumption that trends persist need to think twice before taking divergences seriously. This article will explain divergences, show when to ignore divergences and offer methods to quantify divergences.
Let's first review the basics of divergences. Positive and negative divergences form in momentum indicators when they diverge from price action. A positive divergence forms when the indicator holds above its prior low and price forges a lower low. This divergence shows less downside momentum and could lead to a bullish trend reversal. A negative divergence forms when the indicator does not exceed its prior high and price forms a higher high. This divergence shows less upside momentum and could lead to a bearish trend reversal.
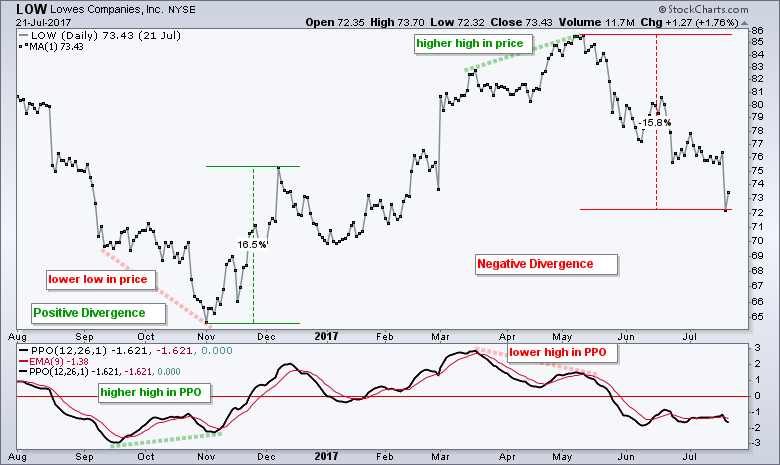
I am going to pick on the Percentage Price Oscillator (12,26,9) in these examples, but the lessons can be applied to any momentum indicator (MACD, RSI, Stochastic Oscillator etc...). The chart below shows Lowes Companies (LOW) with a large positive divergence marking a major low in November 2016 and a large negative divergence marking an important peak in May 2017. Note that a positive divergence in the PPO is confirmed with a subsequent move above the signal line and a negative divergence is confirmed with a move below the signal line.
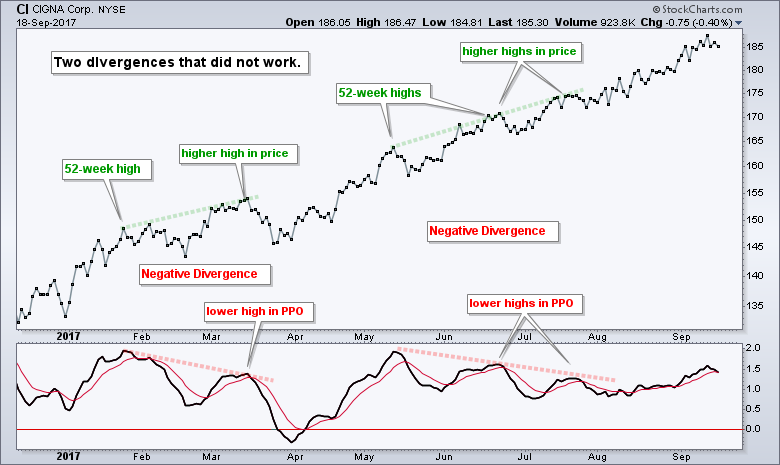
A chart like LOW makes one think that momentum divergences produce pretty good signals. Truth be told, I can usually find more failed divergences than successful divergences. Chartists interested in divergences should plot their favorite momentum indicator and really study the divergence signals. You might be surprised! The chart below shows Cigna (CI) with two negative divergences that did not foreshadow a major reversal or decline in prices. Instead, Cigna simply marched higher with less upside momentum.
Divergences, by their nature, form after prices have affirmed the overall trend with a new low or high. For example, a negative divergence forms when price exceeds its prior high, which means there is an uptrend underway. A negative divergence can also form when price is at a 52-week high. Think about that for a moment. A negative divergence is a bearish setup that forms within an uptrend and sometimes within a long-term uptrend. Negative divergences may work sometimes, but they are fighting the trend most of the time.
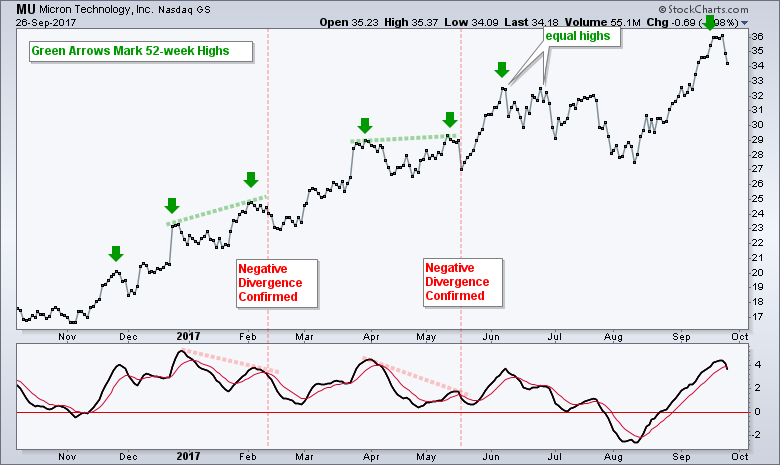
The chart below shows Micron Technology (MU) hitting a 52-week high in November and then forming at least two confirmed negative divergences (red vertical lines). Notice that these bearish signals occurred right after a series of 52-week highs. The bigger trend was clearly up and this was the dominant force at work. Momentum ebbs and flows during uptrends and these swings cause the divergences. A little less upside momentum is not always bearish. In the case of Micron, the divergences did not foreshadow a trend reversal because the uptrend resumed soon after these signals.
Personally, I do not think it makes sense to look for bearish signals when a 52-week high is within sight. As the LOW chart at the beginning shows, there will always be exceptions to the rule or guideline. Note that LOW hit a 52-week high in May and the negative divergence foreshadowed a 15% decline. Despite this exception, I think we can increase our odds overall by IGNORING negative divergences near 52-week highs and FOCUSING on positive divergences that form after a 52-week high. Ignoring negative divergences in an uptrend will eliminate most because most form during an uptrend.
I would suggest that we look for positive divergences when the following conditions are present. First, the S&P 500 is in a long-term uptrend as defined by the 50-day EMA being above the 200-day EMA. Second, the stock or ETF has recorded a 52-week high within the last three months. Third, the 50-day EMA is above the 200-day EMA for the stock or ETF. Fourth, the stock or ETF is above the 200-day EMA when the positive divergence is confirmed (PPO crosses above signal line). These requirements will quantify the positive divergences and ensure that subsequent signals are in harmony with the bigger trend. This system will certainly not be foolproof, but it does fit with my modus operandi, which is looking for corrections within an uptrend.
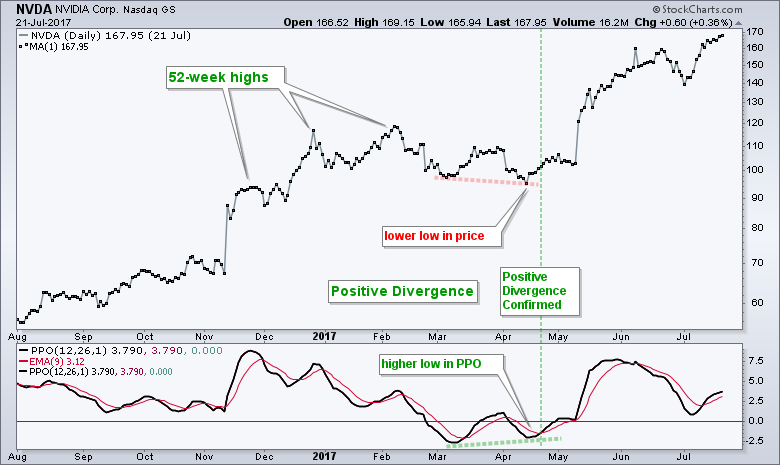
The chart below shows Nvdia (NVDA) with a great signal in late April. Of course it looks great! I hand picked it and Nvdia is the best performing stock in the S&P 500 in 2017. The stock hit 52-week highs in November, December and February, corrected into April and the PPO formed a positive divergence from March to April. The subsequent signal line crossover confirmed the divergence and foreshadowed a monster move in the stock. For what it is worth, I also found successful positive divergences in BRK.B, CSCO, CSRA, DAL, ETFC, HIG, HLT, HPQ, KLAC, XRX, XYL, UMN, RFJ and RMD in 2017.
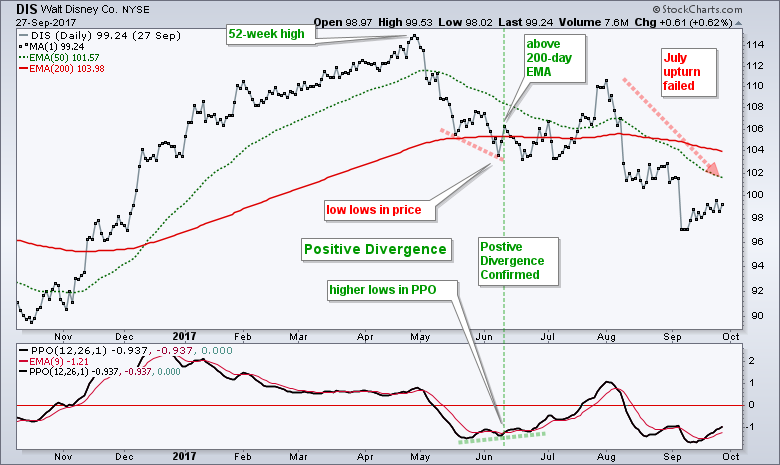
The next chart shows Disney (DIS) with a signal that looked successful initially, but ultimately failed as the stock fell below the summer lows. A positive divergence formed from mid May to early June and the PPO confirmed with a signal line cross on June 12th (green vertical line). Note that DIS closed back above the 200-day EMA on the signal day. The stock surged to 110 in late July, but did not hold these gains and ultimately fell below 98. Can't win them all.
Some divergences provide good signals and some do not. As with most momentum signals, it is clear that we need to further quantify divergences before considering a signal robust. We can improve our chances of a profitable signal by taking the bigger trend into consideration. Look for bullish setups when the long-term trend is up and look for bearish setups when the long-term trend is down.
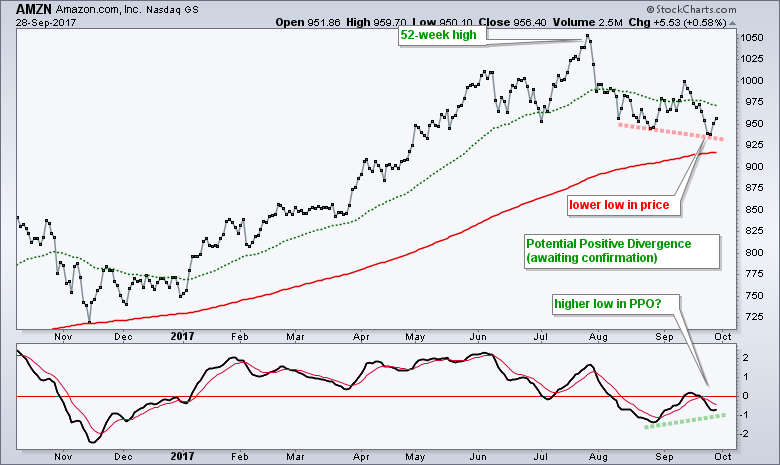
And finally, I managed to find a working positive divergence in Amazon (AMZN). The stock moved below the August low in September, but the PPO remains above its prior low. A positive divergence is working and a PPO signal line crossover would confirm this setup.
Follow me on Twitter @arthurhill - Keep up with my 140 character commentaries.
****************************************
Thanks for tuning in and have a good day!
--Arthur Hill CMT
Plan your Trade and Trade your Plan
*****************************************


