 |
.... VIX Extends its Low Run .... Revisiting Seasonality .... QQQ Lags, but Doesn't Drag .... Small-caps and Micro-caps Take the Lead .... Biggest Momentum Surge in 10 Years for IJR .... Sector Participation Supports Bull Market .... Industrials and Finance Lead with Fresh Highs .... Technology and Materials Not Far Behind .... Healthcare and Utilities Correct within Uptrends .... XLE moves into Bull Mode on Breadth Chart .... Discretionary and Staples are Lagging .... TLT Breaks Wedge Line .... Gold Falls Back to Breakout Zone .... November Crude Breaks Summer High .... Dollar Gets an Oversold Bounce .... Charting Notes |
----- Art's Charts ChartList (updated September 29th) -----
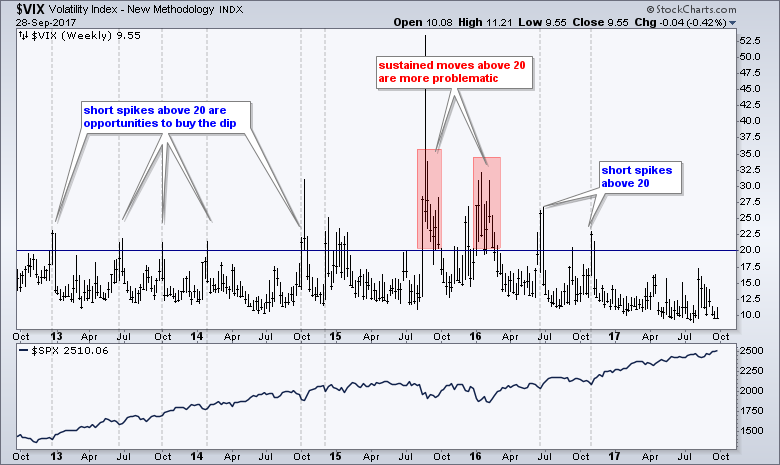
VIX Extends its Low Run
The S&P 500 Volatility Index ($VIX) moved below 10 again in September as the S&P 500 moved to a new high during the seasonally weakest month of the year. Personally, I think the S&P 500 Volatility Index ($VIX) is only good for buying the dip on spikes in fear and the trend is more important than seasonality. The chart below shows the VIX below 20 since early November. The last two spikes above 20 occurred in mid June 2016 and late October 2016. Both of these spikes coincided with lows in the S&P 500. The sustained moves above 20 in August-September 2015 and January-February 2016 proved more problematic.
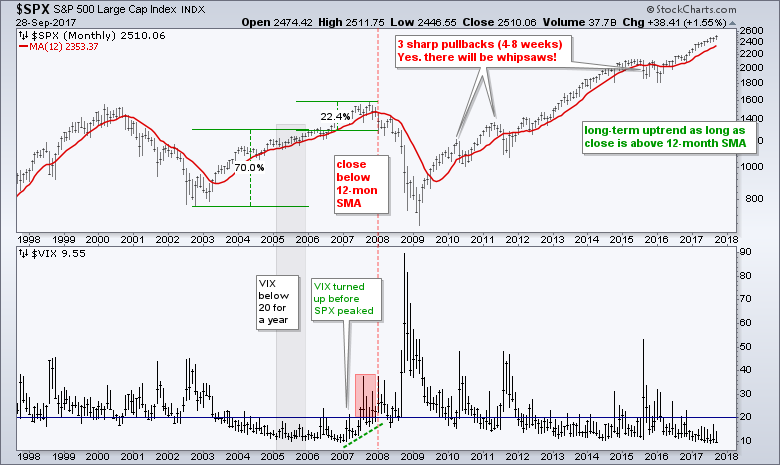
The next chart shows the S&P 500 and the VIX with monthly bars over the last twenty years. Should the VIX finish the year below 20, it would be the first time that the indicator did not move above 20 for an entire year since 2005. At the end of 2005 the S&P 500 was up around 70% from its 2002 lows and in a steady uptrend. This uptrend extended another 20% and the index did not peak until October 2007. Note that the VIX bottomed in January 2007 and was above 20 for most of the second half of that year. Thus, the VIX provide a warning for the 2007 peak. Trend followers can watch for a monthly close 12-month SMA to reverse the long-term uptrend. Until such events, the long-term trend for the S&P 500 is up and this means pullbacks are opportunities.
*********
Thursday's Art's Chart Article:
Momentum Divergences: Understanding, Knowing When to Ignore and Knowing When to Trade.
*********
Revisiting Seasonality
As with most technical indicators, seasonality is a double-edged sword that works until it doesn't work. I have written about seasonality several times and my findings indicate that chartists are better off focusing on the price chart. Study the chart and your indicators for clues on trend direction and accept the findings regardless of seasonal patterns.
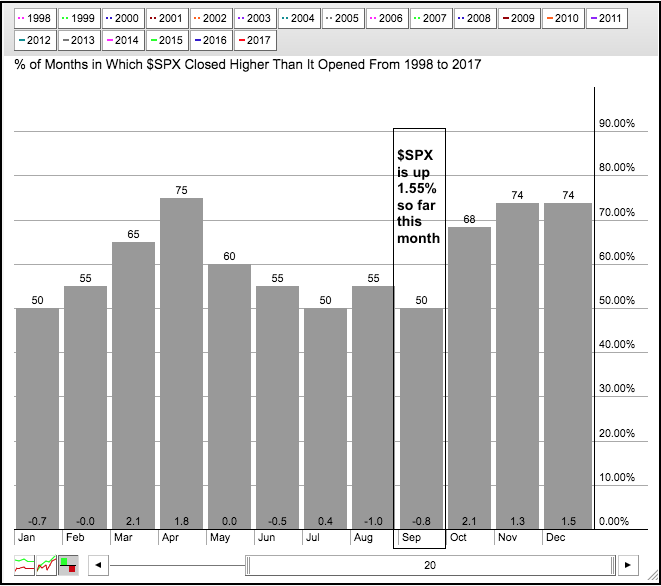
Admittedly, I wrote about the upcoming bearish seasonal patterns in August and they did not bear fruit. Instead, the uptrend continued and the major stock indices moved to new highs. The seasonal patterns are now set to turn bullish, but I cannot put much credence in a pattern that just failed miserably in September. The major stock indexes are in uptrends and small-caps are leading right now. The evidence for small-cap leadership is already there and that is really all we need to know.
Adding seasonal patterns to the mix can sew the seeds of doubt, just like having too many indicators leads to analysis paralysis. A bearish seasonal pattern can make one doubt an uptrend that looks perfectly fine on the chart. A bullish seasonal pattern can make one ignore bearish chart signals because we don't want to be wrong. Less is more and I think seasonal patterns add more confusion than clarity. Focus on price! Disclaimer: This is just an opinion and I am sure there are many traders successfully using seasonality. There are lots of technical tools out there and we need to focus on the ones that work best for us.
QQQ Lags, but Doesn't Drag
The Nasdaq 100 ETF (QQQ) is lagging the other major index ETFs because it was the only one that did not hit a new high this week. Poor baby. Don't feel too sorry for QQQ just yet because it is still the top performing ETF for 2017. QQQ is up 22.74% year-to-date and the Russell 2000 iShares (IWM) is up 10.68% this year. The tables, however, turned over the last three months because QQQ is up 3.63% since late June and IWM is up 4.82%. On the price chart below, the March trend line and the August lows define the uptrend in QQQ. A close below 140 would reverse this uptrend and this would be cause for concern.
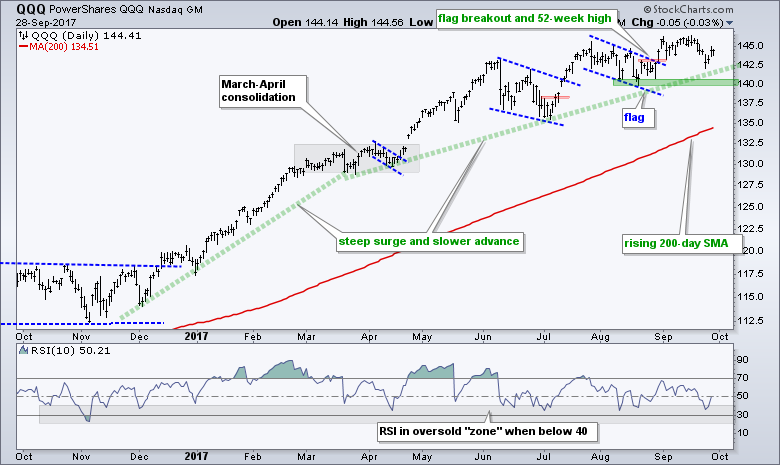
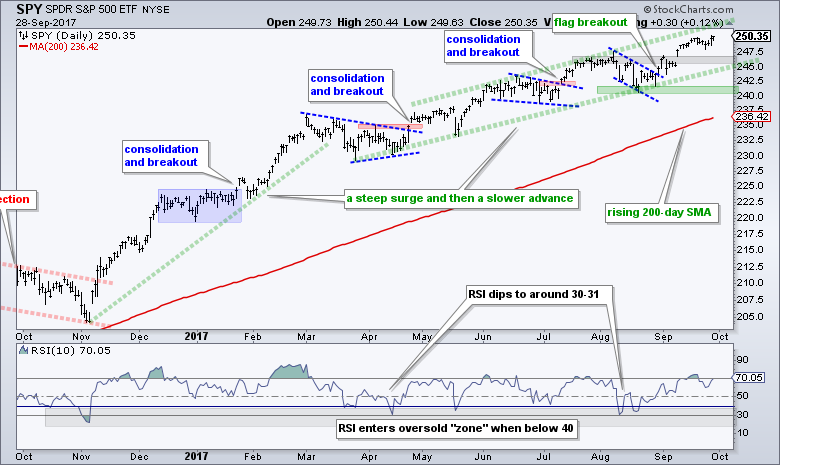
Short-term relative weakness in QQQ is not a cause for concern because the broad index ETFs all hit new highs. These include the S&P 500 SPDR, the EW S&P 500 ETF, the S&P MidCap SPDR, the S&P SmallCap iShares and the Russell 2000 iShares. The chart below shows SPY breaking out in late August and hitting new highs throughout September. The breakout zone turns into the first support zone around 245. The August lows mark key support in the 240-242 area.
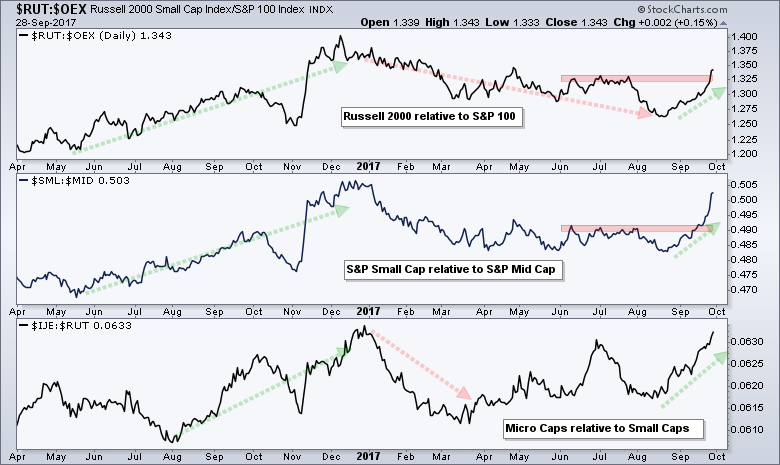
Small-caps and Micro-caps Take the Lead
The next chart shows three ratios to compare performance: the Russell 2000 relative to the S&P LargeCap 100, the S&P Small-Cap 600 relative to the S&P Mid-Cap 400 and the Russell Microcap Index relative to the Russell 2000. Small-caps are outperforming large-caps as the $RUT:$OEX ratio broke above its summer highs. Small-caps are now outperforming mid-caps as the $SML:$MID ratio surged above its spring and summer highs. Microcaps are outperforming small-caps as the $IJE:$RUT ratio surged from mid August to late September. The message here is clear. Money is moving into the small-caps and microcaps. We should put the S&P SmallCap iShares (IJR), the Russell 2000 iShares (IWM) and the Russell MicroCap iShares (IWC) on our radar for bullish setups, pullbacks and short-term oversold conditions.
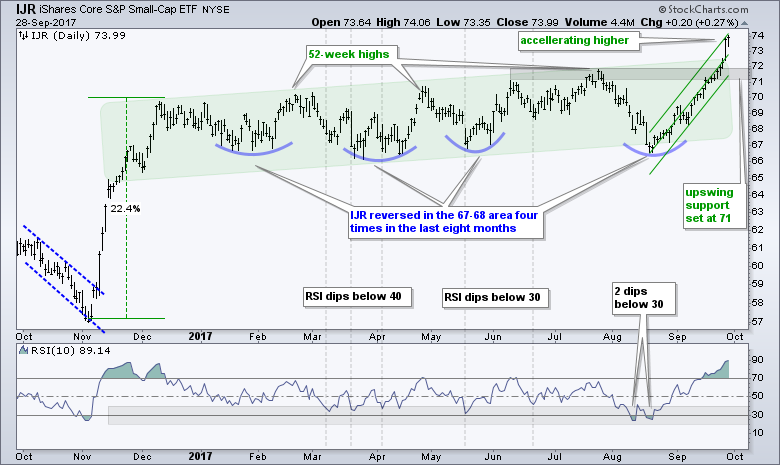
Biggest Momentum Surge in 10+ Years for IJR
The S&P SmallCap iShares (IJR) is now up over 10% from its mid August low and trading at a new high. I thought it was getting overbought at the end of last week and it just got even more overbought. This is what happens in strong uptrends. Notice that RSI(10) moved to its highest level in over 10 years! This is also true for RSI(14). The momentum surge is bullish because it signals strong buying pressure. The last buying binge occurred in early November when IJR surged over 20% in five weeks. The ETF is current up around 10% in 28 days. My best guess is that broken resistance around 70-71 and the Raff Regression Channel mark first support to watch on a pullback.
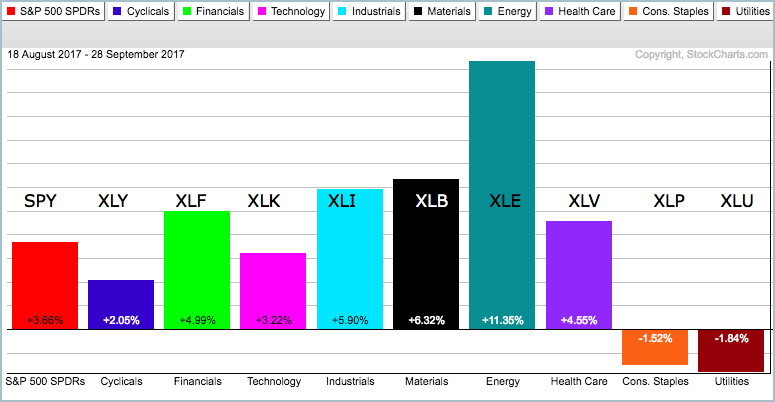
Sector Participation Supports Bull Market
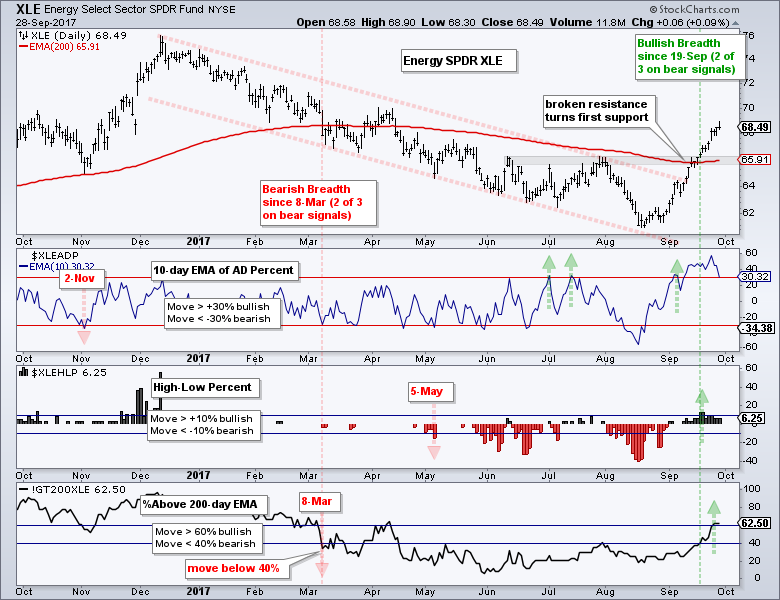
The Industrials SPDR (XLI) and the Finance SPDR (XLF) are the leaders right now because both hit fresh new highs this week. The Materials SPDR (XLB) and Technology SPDR (XLK) are not far behind because they recorded new highs the previous week. The HealthCare SPDR (XLV) and Utilities SPDR (XLU) fell back over the last few weeks, but they recorded 52-week highs three weeks ago. Overall, we have six of the nine sector SPDRs hitting new highs within the last three weeks and this points to broad strength in the stock market. The Energy SPDR (XLE) is leading all sectors since mid August with a 12% gain in six weeks. The PerfChart below shows XLF, XLI, XLB and XLE leading since August 17th. XLP and XLU are the only sector showing losses.
Industrials and Finance Lead with Fresh Highs
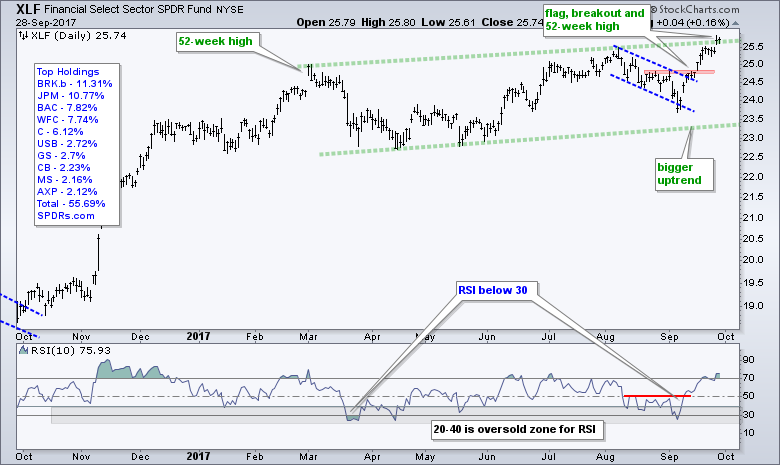
XLF broke out in mid September and surged to a 52-week high with a gap on Thursday. I could say it looks short-term overbought, but this is not bearish because it takes strong buying pressure to become overbought. It just means I will wait for the next setup to materialize (RSI move below 40 and/or some sort of pullback).
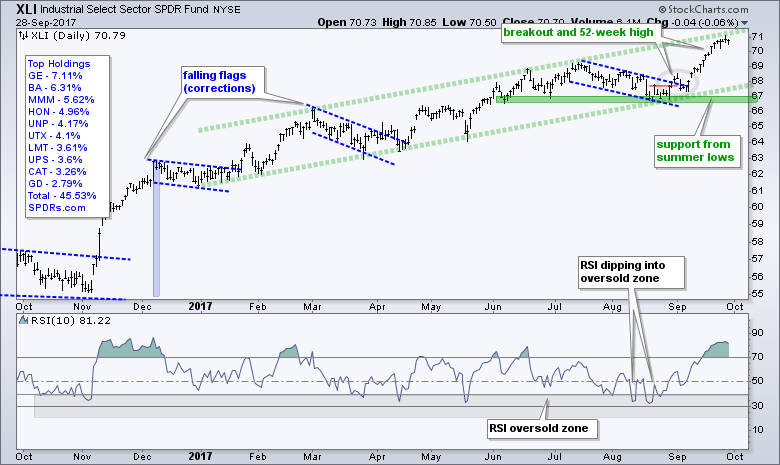
The same holds true for XLI, which broke out in early September and hit another new high this week. The summer lows and channel line mark key support in the 67 area.
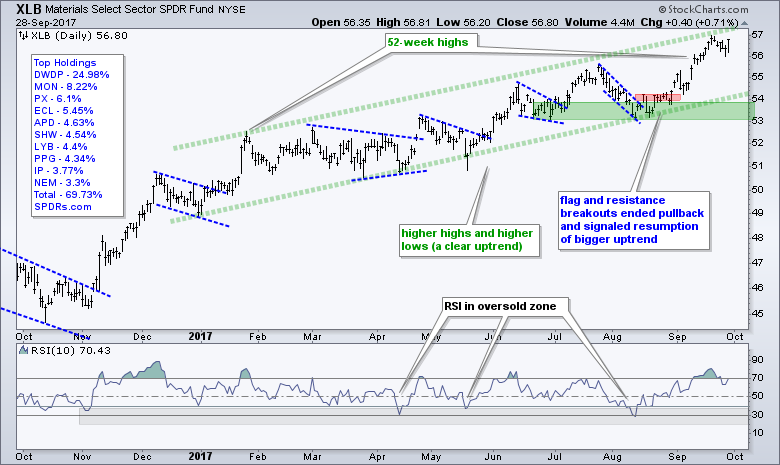
Technology and Materials Not Far Behind
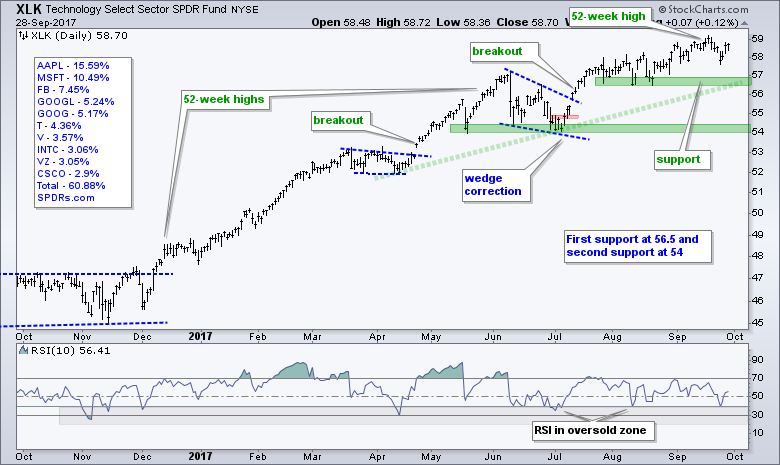
XLK broke out of a wedge in mid July and worked its way to new highs throughout August and September. The advance has slowed since late July, but it is still an advance as long as support in the 56.5-57 area holds.
XLB broke out in late August and raced to new highs in September. The green lines define a rising channel and the overall uptrend. Support is set in the 53-54 area.
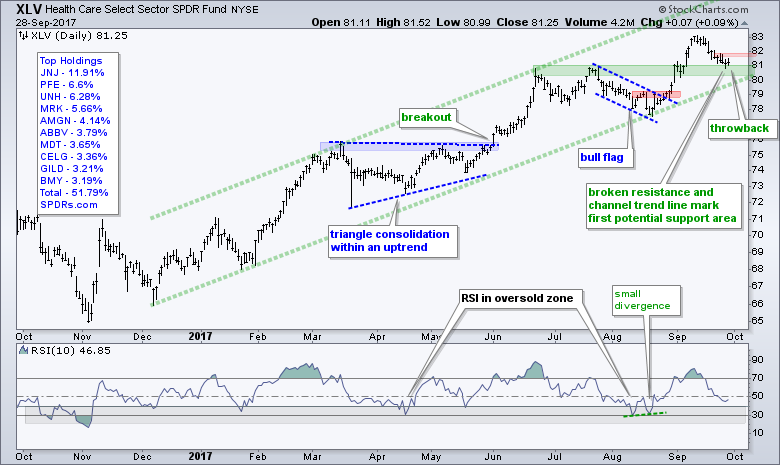
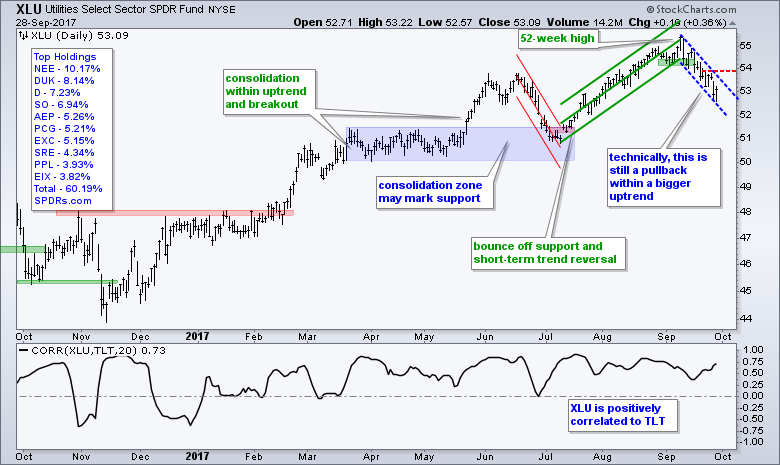
Healthcare and Utilities Correct within Uptrends
The first four sector SPDRs are clearly strong and leading, but they are not actionable because they are not "setting up" with pullbacks. XLV and XLU, on the other hand, are pulling back within uptrends and this makes them "interesting". XLV hit a new high in mid September and fell back to the breakout zone, which turns first support. RSI is not quite in the oversold zone though. The red zone marks first resistance at 82 and a breakout here could get the advance moving again.
XLU fell back pretty hard because the 20+ YR T-Bond ETF (TLT) declined sharply the last two weeks. XLU did hit a new high just three weeks ago and this makes the pullback at correction within the bigger uptrend. A breakout at 54 would end this pullback and signal a continuation of the bigger uptrend. Watch TLT for clues because XLU and TLT are positively correlated.
XLE moves into Bull Mode on Breadth Chart
The breadth indicators for the Energy SPDR (XLE) turned bullish with the September surge. The 10-day EMA of AD Percent ($XLEADP) moved above 30% in early September and High-Low% ($XLEHLP) exceed +10% on 19-Sep. This put two of the three breadth indicators are bullish signals and reversed the bearish signal from 8-Mar. The %Above 200-day EMA (!GT200XLE) followed suit with a move above 60% this week and all three indicators are bullish. XLE broke out during the September surge and the breakout zone marks first support in the 65-66 area. This is the area to watch on a pullback.
Discretionary and Staples are Lagging
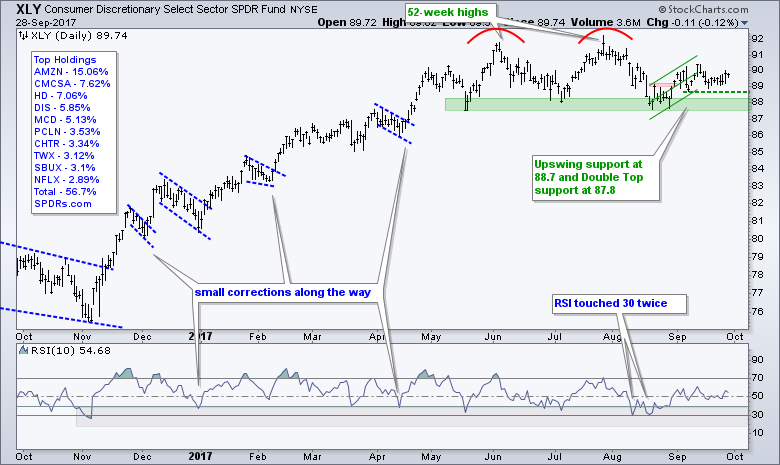
The Consumer Discretionary SPDR (XLY) has not done much this month, but remains above support and within upswing since mid August. The September lows mark first support at 88.7, a break of which would be negative and put the double top back in play.
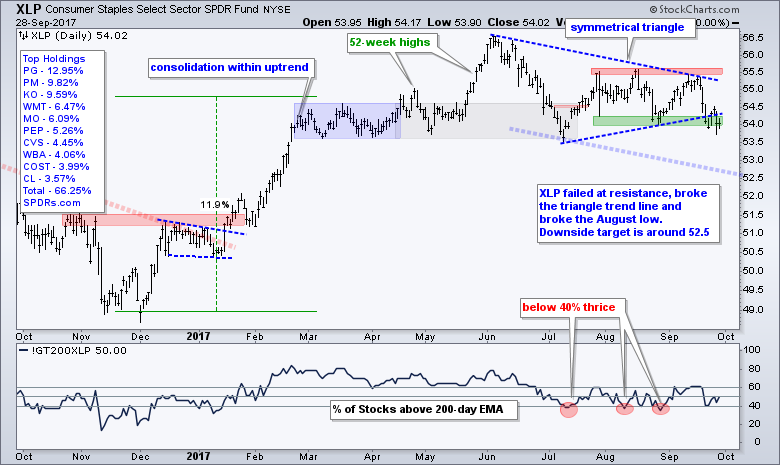
XLP is the weakest of the nine sectors right now. The ETF broke the triangle trend line last week and broke below the August low this week. The parallel trend line extends down from the July low to mark a target zone in the 52.5 area.
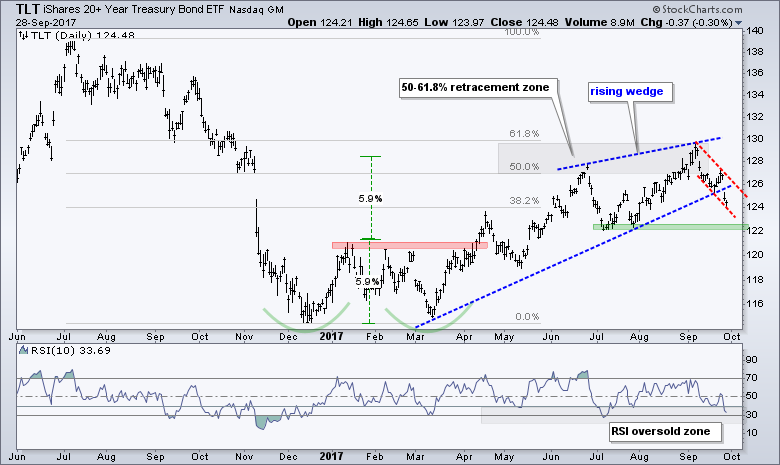
TLT Breaks Wedge Line
I thought the 20+ YR T-Bond ETF (TLT) was ripe for a bounce after a pullback to 126, but the ETF did not bounce and instead fell below 125. TLT broke the wedge trend line in the process and RSI(10) moved below 40. The wedge line break could be a big bearish development because it could signal a continuation of the 2016 decline (140 to 115). I repositioned support at the July low and will not turn fully bearish until a break here. The red lines and Wednesday's plunge define the downswing. Look for a close back above 127 to put the bulls back on track.
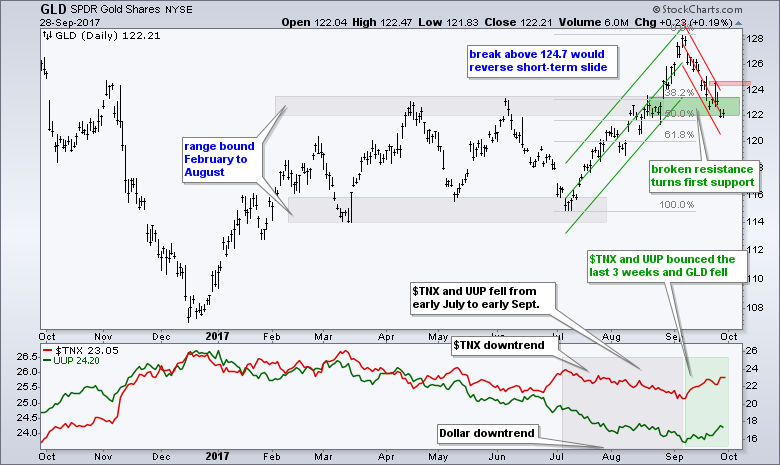
Gold Falls Back to Breakout Zone
The Gold SPDR (GLD) followed TLT lower with a sharp decline from 128 to 122. This puts the ETF at its first make-or-break level. Broken resistance turns first support and the ETF retraced 50% of the prior surge. The red Raff Regression Channel defines this pullback with resistance marked at 124.7, a break of which is needed to revive the bigger uptrend.
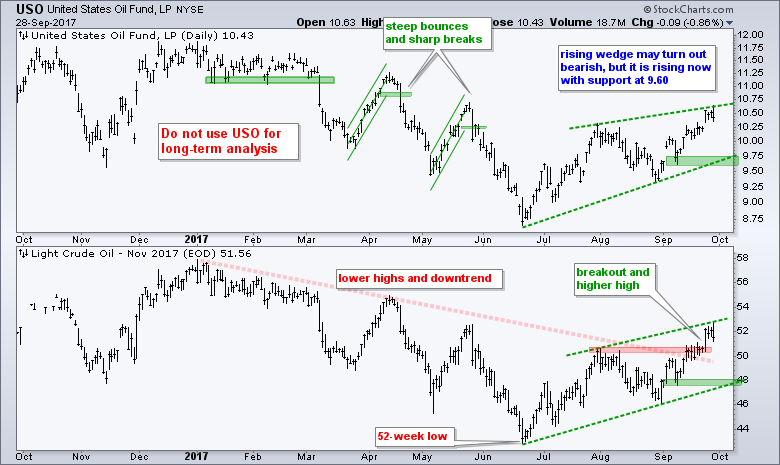
November Crude Breaks Summer High
November Crude (^CLX17) broke above its summer highs with a move above $51 this week. The trend since June is up and this breakout is making a bid to reverse the long-term downtrend. The green lines mark a rising wedge, which could turn out to be a bearish pattern because these are typical for counter-trend bounces. The wedge, however, is currently rising and this defines the immediate uptrend. I am marking support at 47.50 for November crude and at 9.6 for USO.
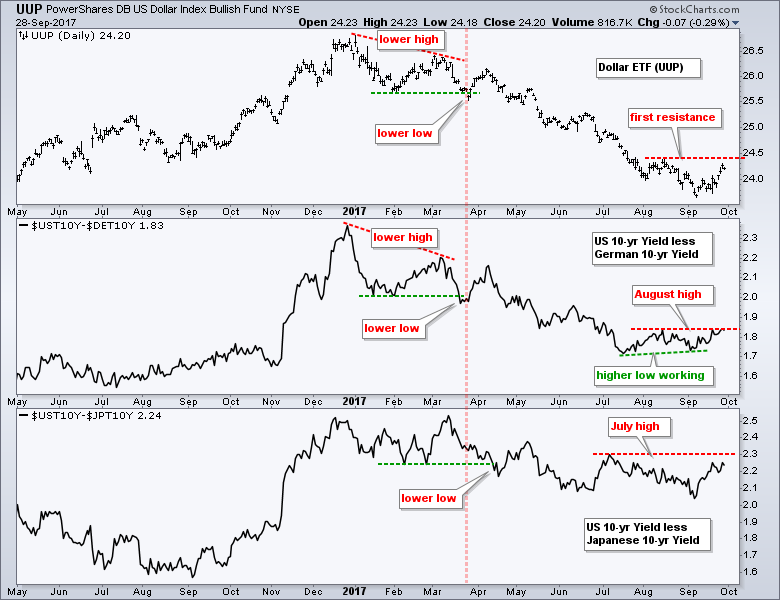
Dollar Gets an Oversold Bounce
The US Dollar ETF (UUP) got a bounce this week, but remains in a downtrend overall and short of a breakout. The August high marks first resistance and a break above 24.50 is needed before thinking trend reversal here. The indicator windows show the yield spreads for the US 10-yr and German 10-yr, and US 10-yr and Japanese 10-yr. Yield spreads affect currency pairs so we should watch the spread between $UST10Y and $DET10Y closely. A higher low formed from July to September and a break above the August high would show a widening spread. This means the difference between the US 10-yr and German 10-yr is widening. This would be bullish for the Dollar and negative for the Euro.
Charting Notes
- Art's Charts ChartList
- Retail SPDR (XRT) finally broke above its summer highs.
- Home Construction iShares (ITB) leads with fresh new high.
- HealthCare Providers ETF (IHF) forms triangle within uptrend (bullish continuation pattern)
- Biotech iShares (IBB) remains with flag/pennant.
- Biotech SPDR (XBI) broke out of bull flag.
- Metals & Mining SPDR (XME) has a bullish wedge working over the last few weeks.
- RSI(10) is in oversold zone for the Steel ETF (SLX).
- Copper ETN (JJC) bounced after a short pullback.
- RSI(10) moved back above 30 for the Copper Miners ETF (COPX).
- GOOGL bounced off support and broke short-term resistance.
- CL gapped off support and broke short-term resistance.
******************************************************
ETF Master ChartPack - 300+ ETFs organized in a Master ChartList and in individual groups.
Follow me on Twitter @arthurhill - Keep up with my 140 character commentaries.
****************************************
Thanks for tuning in and have a good day!
--Arthur Hill CMT
Plan your Trade and Trade your Plan
*****************************************


