 |
.... QQQ Leads with Breakout and New High .... Higher Highs > Weakening Momentum .... Small-caps Leading for Two Weeks .... Tech, Utes and Healthcare Lead Sector SPDRs .... Materials and Industrials Break Flag Lines .... Consumer Discret. SPDR Bounces off Support .... Financials Still Dragging .... Regional Bank SPDR Tests 2017 Lows .... Consumer Staples Show Internal Weakness .... Energy Remains the Weakest Link .... Oil & Gas Equip SPDR Gets Feeble Bounce .... Oil Holds Channel Break .... ChartList and Industry Group ETFs .... Bonds Rise along with Stocks .... Gold Breaks Out of Trading Range .... Dollar Breaks to New Lows .... |
----- Art's Charts ChartList (updated September 1st) -----
QQQ Leads with Breakout and New High
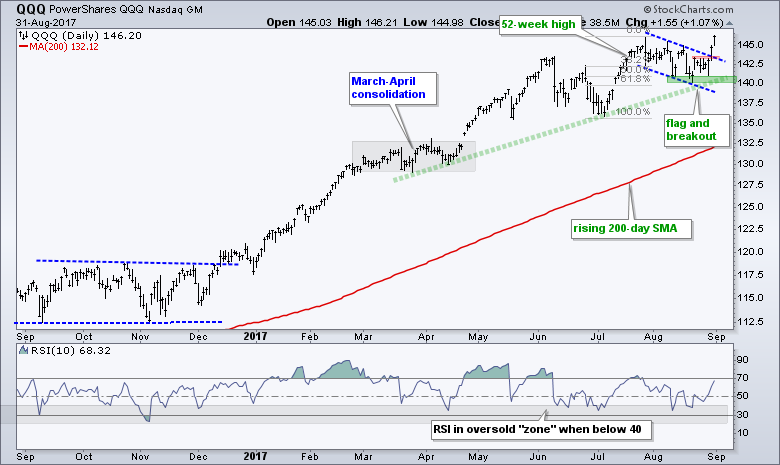
The Nasdaq 100 ETF (QQQ) was leading the market going into the summer and it is again leading the market as we come out of summer. Led by new highs in Apple, Adobe, Biogen, Intuitive Surgical, Microchip Technology, Microsoft and Paypal, QQQ broke out on Wednesday and surged to a new high in Thursday. The August decline was always viewed as a correction within a bigger uptrend and the breakout signals an end to this correction. The August lows and March trend line mark first support in the 140 area.
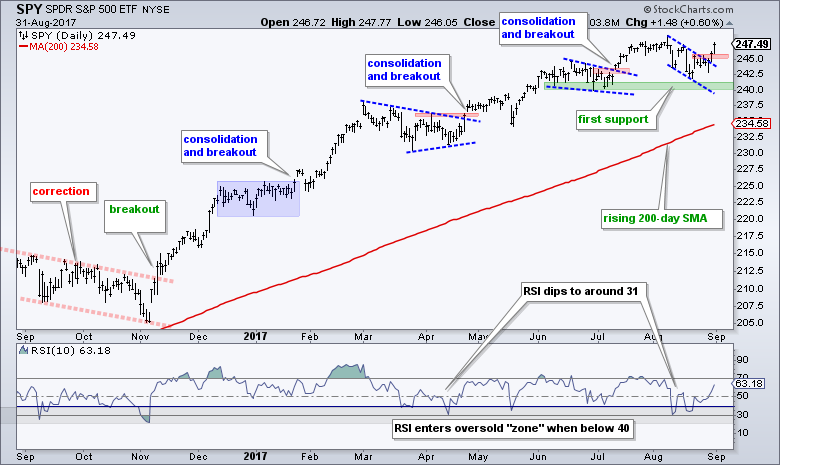
The second chart shows SPY forming a flag correction and breaking out with a move over the last two days. This move signals a continuation of the bigger uptrend and puts the ETF within 1% of an all time high. In addition, the advance over the last two weeks reinforces support in the 240 area.
Higher Highs > Weakening Momentum
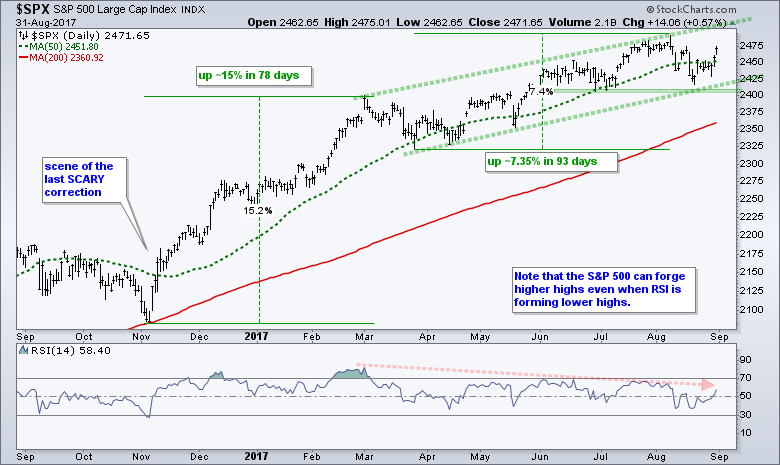
There are two distinct price moves since early November. First, the S&P 500 surged around 15% in 78 trading days. Second, the index formed a rising channel that advanced around 7.35% from low to high over the a 93 day period. The first surge represents the initial thrust and the second advance presents a slower slog. Sure, summer momentum is not as strong as is was in December and February, but there is clearly more upside momentum than downside momentum, and that is all that really matters. Notice how the S&P 500 formed a string of higher highs as RSI formed a string of lower highs. This is also true for MACD and the Percentage Price Oscillator (PPO). The PRICE CHART is what really counts!
Small-caps Leading for Two Weeks
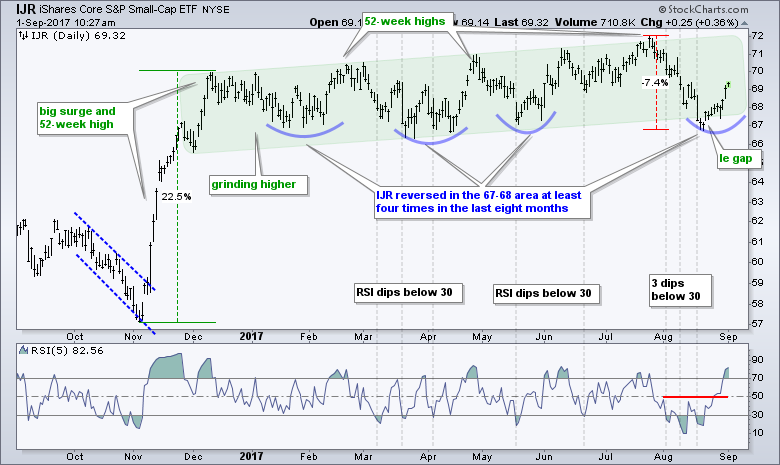
The S&P SmallCap iShares (IJR) led the market lower from July 25th to August 17th (-7.4%) and then led the market higher over the last ten trading days (+2.65%). Note that the Russell 2000 iShares (IWM) is up 3.5% over the last ten days and the Russell MicroCap iShares (IWC) is up 4%. The green zone in the IJR chart shows a choppy uptrend from January to August. There were at least four dips during this uptrend and each reversed in the 67-68 area. More importantly, the ETF forged 52-week highs in December, February, April, June and July. Thus, it was not a stretch to consider the bigger trend up and this means short-term declines are mere corrections. At this point, we have another short-term reversal in the 67-68 area and I would expect a move to new highs because the bigger trend is up. The blue half circles show that the prior three reversals in this area formed over a 1-4 week period. Thus, do not be surprised to see some backing and filling.
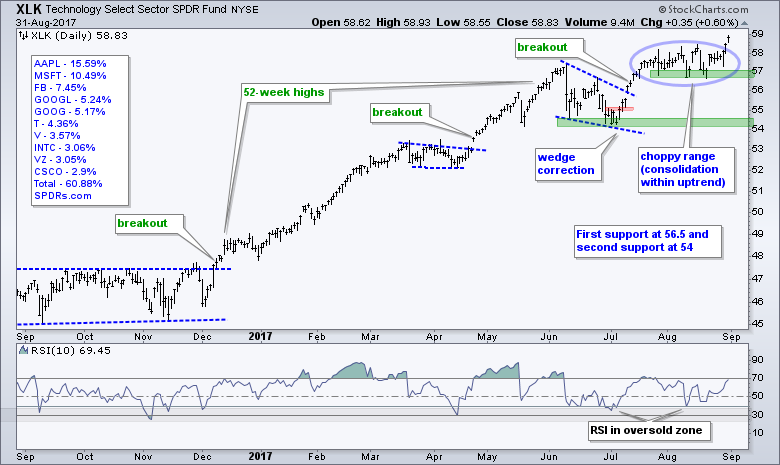
Technology, Utilities and Healthcare Lead Sector SPDRs
The Technology SPDR (23.5%), Utilities SPDR (3.3%) and HealthCare SPDR (14.5%) are leading the market because these three recorded 52-week highs this week. Together, these three sectors account for 41.3% of the S&P 500. The first chart shows XLK consolidating in August and surging to a new high with an advance the last three days. Most of the other sectors fell in August and formed falling flags. XLK, on the other hand, did not fall and traded flat near its 52-week highs. This showed relative strength during the month and led to the recent surge. The August lows now mark first support in the 56.5-57 area.
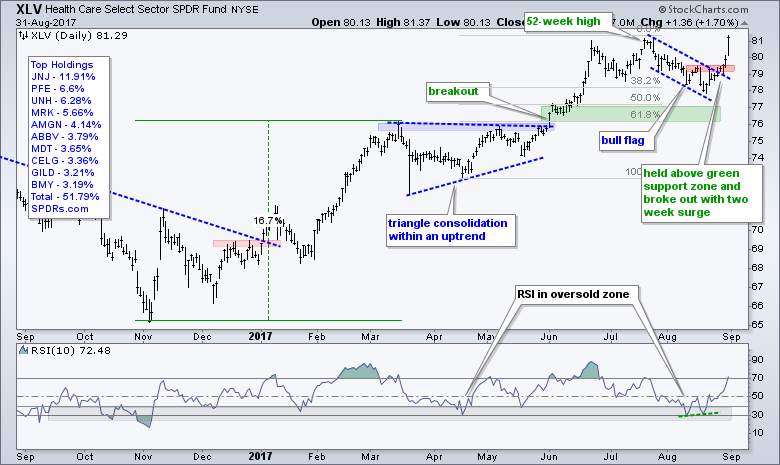
The next chart shows XLV breaking out of its flag formation with a surge over the last two weeks. The breakout zone around 79-79.5 becomes first support to watch on a short-term pullback (throwback).
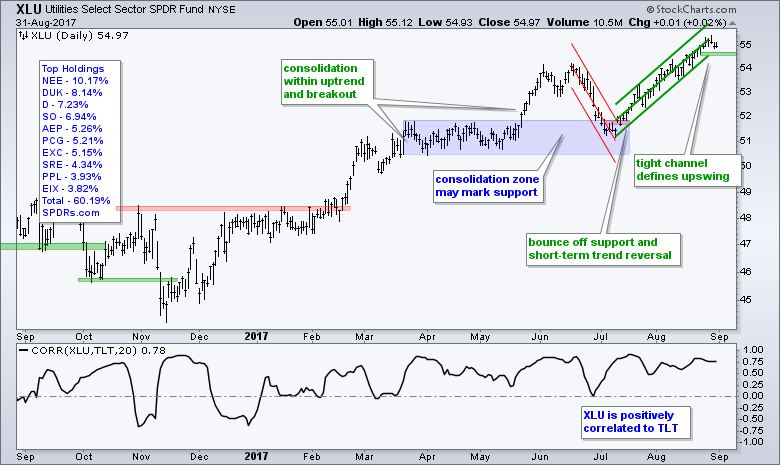
The next chart shows XLU within a tight rising channel (Raff Regression Channel). The lower line marks first support at 54.5 and a break here would argue for a pullback within the uptrend. Note that XLU has a strong positive correlation to TLT and TLT hit a new high for 2017 this week.
Materials and Industrials Break Flag Lines
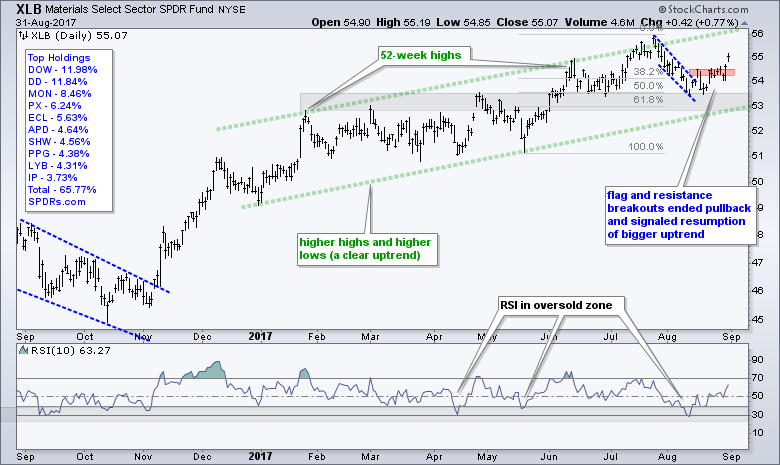
I would put the Materials SPDR (XLB) and the Industrials SPDR (XLI) in the fourth and fifth places for sector performance. Both recorded 52-week highs in July and corrected with falling flags into August. The first chart shows XLB bottoming on August 11th and turning up over the last three weeks. The green lines mark the long-term uptrend with a target zone in the 56-57 area.
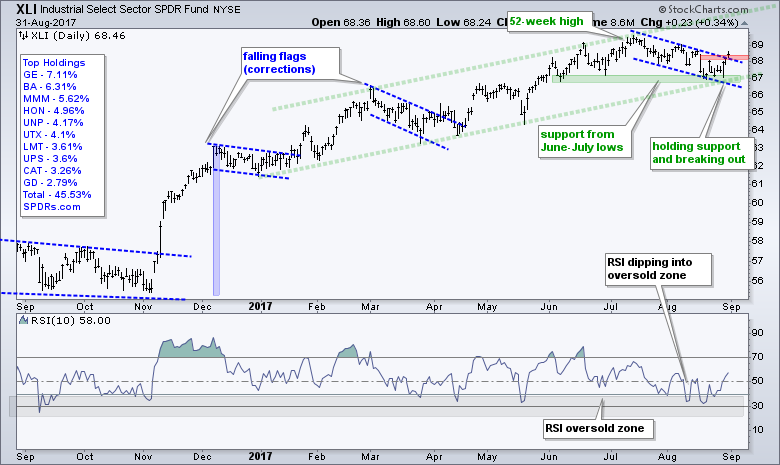
The second chart shows XLI finding support in the 67 area and breaking above the flag line. The green lines mark a rising channel to define the rate of ascent for the advance since January. The steeper the line, the higher the rate of ascent. Should this rate continue, the XLI target would be in the low 70s over the next few months. The lower line and summer lows mark first support in the 67 area.
Overall, the five sectors shown above are clearly in uptrends, both long-term and short-term. They are the leaders right now and they account for 54% of the S&P 500. The market can rise as long as 50 plus 1 percent of the sector weightings are in bull mode. As noted with the S&P 500 chart, the advance since March has been a choppier and slower affair. This is because there are weak areas within the market. However, the weight of the evidence is still bullish and I would expect higher prices as long as this holds true. And now for the laggards....
XLY Bounces off Support
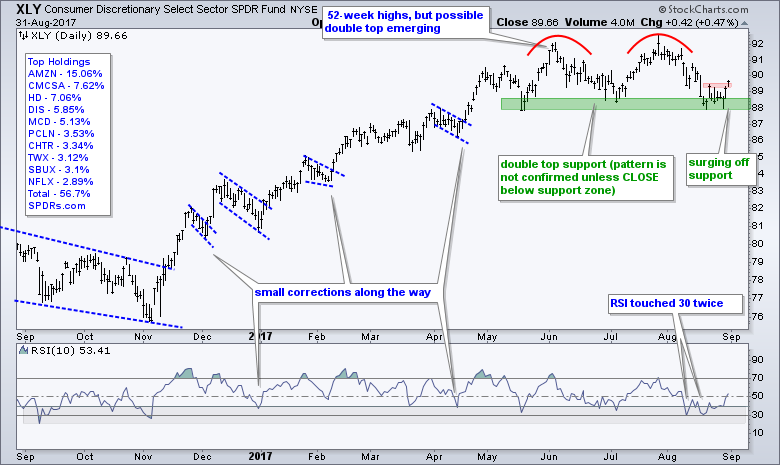
The Consumer Discretionary SPDR (XLY) still has a possible double top, but this pattern has yet to be confirmed as the ETF bounced off support the last two days. In addition, notice that XLY broke above last week's high (minor resistance). Thus, the double top is on hold with this short-term reversal and the bigger uptrend is still in play. The cup is half full, not half empty. Note that Amazon accounts for 15% of the ETF and this behemoth surged off support over the last three days.
Financials Still Dragging
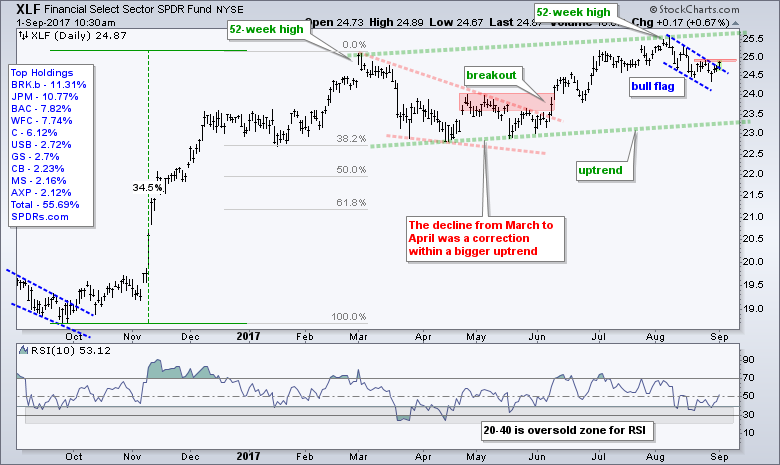
The Finance SPDR (XLF) did not partake in Thursday's big advance and remains within the falling flag, which I still consider a bullish continuation pattern. The overall trend is up (green lines) and the ETF did hit a 52-week high just a few weeks ago. Look for a close above 25 to break flag resistance and signal a continuation higher.
KRE Tests 2017 Lows
The Regional Bank SPDR (KRE) has been one of the weakest groups this year and the ETF also lagged this week. The red lines show a big descending triangle taking shape with lower highs this summer and equal lows since March. Even though this pattern is bearish, I am already bearish on KRE because of the August breakdown and relative weakness this year. Thus, the descending triangle is affirming that is already there. Look for a surge above 53 to put this pattern on hold.
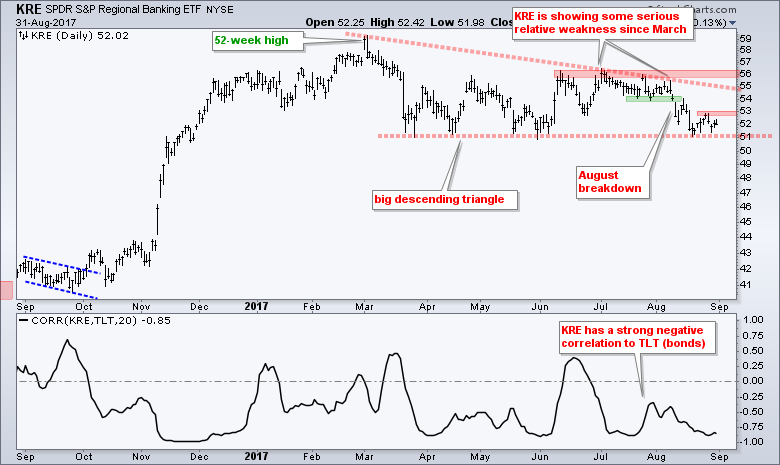
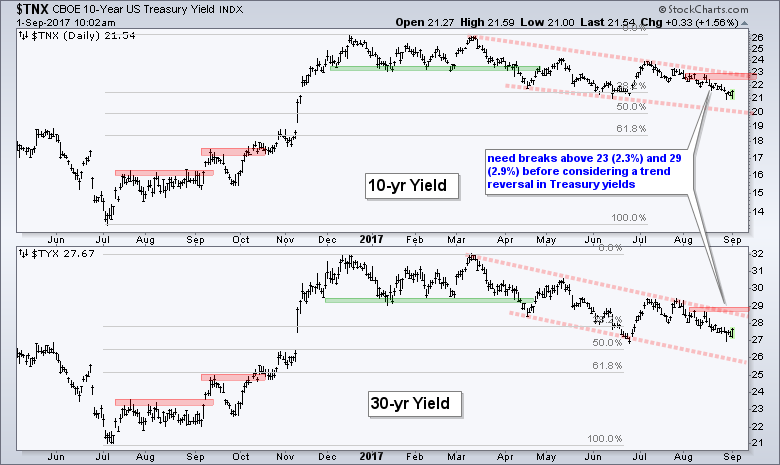
The indicator window shows that KRE has a strong negative correlation with the 20+ YR T-Bond ETF (TLT) and TLT hit a new high for 2017 this week. The new high in TLT corresponds to a nine-month low for the 10-yr T-Yield ($TNX). The long-term trend for TLT is up and the long-term trend for $TNX is down. This is negative for KRE and I would look for a change in the bond market before expecting a change in KRE.
XLP Shows Internal Weakness
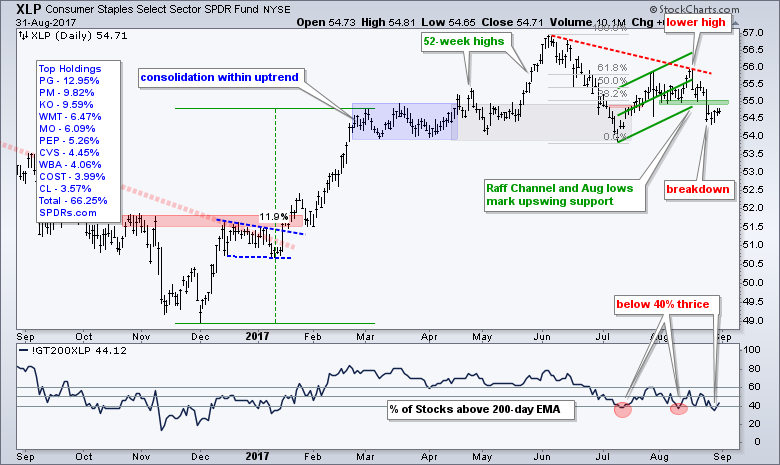
Procter & Gamble (PG) accounts for 13% of the Consumer Staples SPDR (XLP), but strength in the top stock is not enough. PG is up over 7% from its mid July low and trading near a 52-week high. XLP peaked back in June, formed a lower high in August and broke down last week. There is clearly weakness within this sector because Staples %Above 200-day EMA (!GT200XLP) dipped below 40% for the third time since mid July. This means around 60% of stocks in the consumer staples sector are below their 200-day EMAs.
XLE Remains the Weakest Link
The Energy SPDR (XLE) is by far the weakest of the nine sectors because it was the only one to hit a 52-week low earlier this month. The chart below shows XLE with three breadth indicators, which you can read more about using the links below the chart. The 10-day EMA of AD Percent triggered bearish on 2-Nov-16 with a move below -30%, the Energy %Above 200-day EMA (!GT200XLE) triggered bearish with a move below 40% on 8-Mar-17 and High-Low Percent triggered bearish with a move below -10% on 5-May. Two of the three breadth indicators have been bearish since March 8th and XLE remains in bear mode overall.
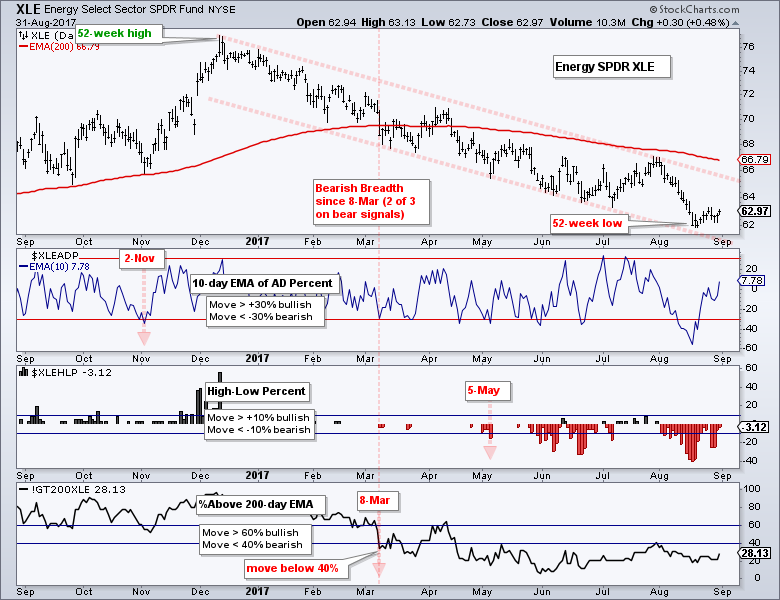
The 10-day EMA of AD Percent has been a bit wild since early July with two moves above +30% and another move below -30%. The indicator rebounded sharply the last two weeks and follow through above 30% would be the first sign of broad buying pressure in XLE. This is usually the first indicator to turn, and it is also the one most prone to false signals. XLE is still a bottom picking play at this point.
Links to articles explaining breadth indicators: 10-day EMA of AD Percent, High-Low Percent indicators and %Above 200-day EMA.
XES Gets Feeble Bounce
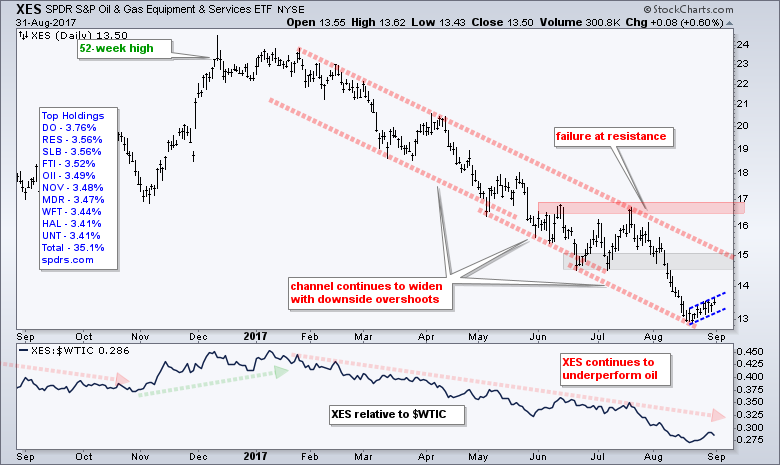
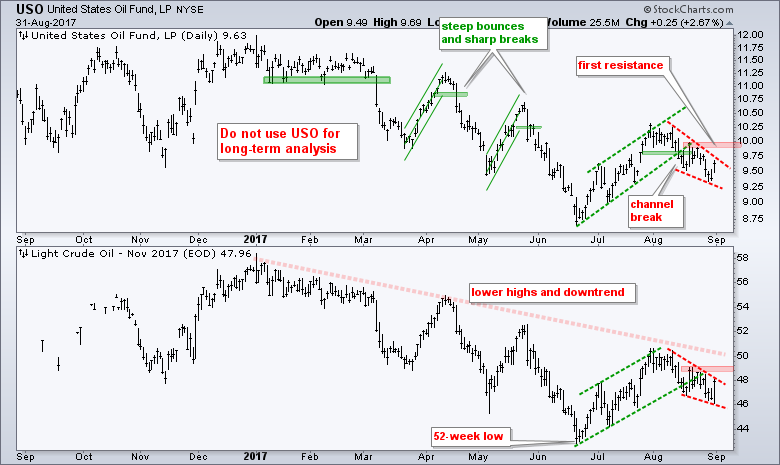
The next chart shows the Oil & Gas Equip & Services SPDR (XES) hitting a new low earlier this month and then bouncing the last two weeks. This bounce is pretty feeble thus far and could turn out to be a bear flag (blue lines). Chartists playing for the oversold bounce can use the flag line to mark first support at 13.20, a brea of which would reverse this bounce. The red lines mark a falling channel that expanded on the downside as XES overshot on each decline. The upper line and broken support zone mark the first resistance area to watch on an oversold bounce.
Oil Holds Channel Break
Oil needs to turn up before we can expect a sustainable bounce in energy-related stocks. The chart below shows November Crude (^CLX17) in a downtrend the entire year and a channel break in mid August. The channel break is the active signal and it remains in play. At this point, I am looking for evidence that would reverse this active signal. It is possible that a falling wedge is taking shape the last four weeks and an upside breakout would be bullish. Watch resistance at 10 for USO and at 49 for November crude.
ChartList and Industry Group ETFs
The Art's Charts ChartList has been updated with 30 industry group ETF charts. I covered the Biotech iShares (IBB), Biotech SPDR (XBI), the Metals & Mining SPDR (XME) and the Silver ETF (SLV) in a post on August 24th. I also covered the key tech-related ETFs on August 24th and again on August 31st. The basic analysis remains unchanged. IBB and XBI found support near their breakout zones in mid August and surged to new highs the last two weeks. We need to be thinking and talking about these ETFs when they are pulling back within uptrends, not after a two week surge to new highs. Ok, the surge to new highs is definitely bullish, but it is perhaps more observational than actionable. Whatever you do, always have an exit plan in place before initiating a position. Elsewhere within healthcare, note that the HealthCare Providers ETF (IHF) and Medical Devices ETF (IHI) also surged off short-term support zones on Wednesday-Thursday. Elsewhere, the Metals & Mining SPDR (XME) is holding above its breakout and the Gold Miners ETF (GDX) broke resistance.
Bonds Rise along with Stocks
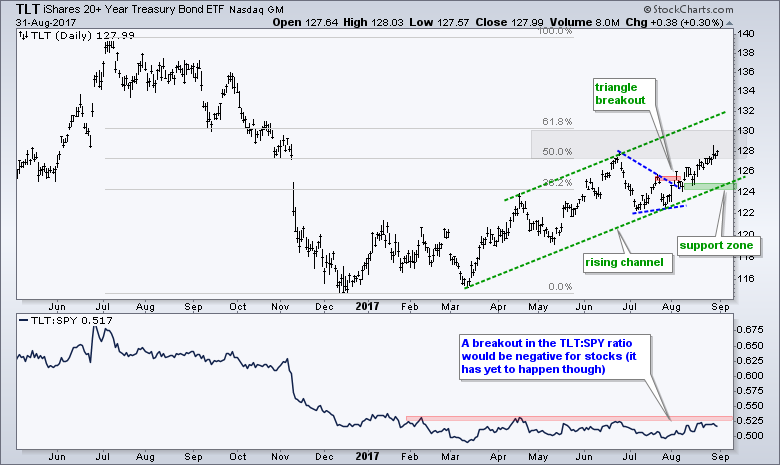
The S&P 500 SPDR (SPY) is up around 12% year-to-date and the 20+ YR T-Bond ETF (TLT) is up around 9%. Stocks can indeed rise along with Treasury bonds and this week was not different. It is an unexpected positive correlation, but it is what it is and we should not be negative on stocks just because bonds are up. On the chart, TLT broke out of a triangle and extended higher the last four weeks. I am now drawing a rising channel with normal trend lines and marking support in the 124-125 area. A close below 124 would negate the triangle breakout and break the channel trend line. This would call for a re-evaluation of the uptrend in TLT.
Gold Breaks Out of Trading Range
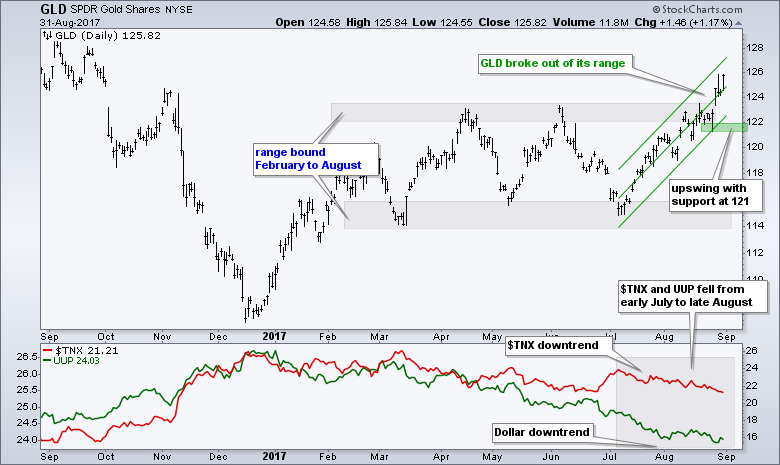
The Gold SPDR (GLD) is positively correlated to TLT, negatively correlated to the 10-yr T-Yield ($TNX) and negatively correlated to the Dollar. Gold is getting the best of both worlds right now because $TNX and the Dollar fell sharply from early July to late August. I am still focused on the upswing from early July to now. The Raff Regression Channel and late August low mark support in the 121-122 area. A pullback to the 122-123 area could present an opportunity, but a break below 121 would reverse the upswing.
Dollar Breaks to New Lows
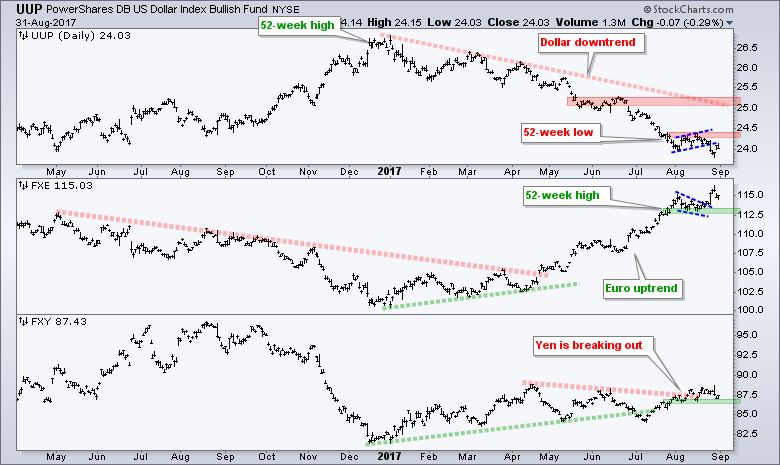
The US Dollar ETF (UUP) firmed for most of August and then broke down with a sharp decline last week. The August pattern looks like a bear flag and the break simply continues the bigger downtrend. The August highs now mark first resistance to watch for an oversold bounce. Key resistance remains in the 25-25.20 area. The Euro ETF (FXE) has first support at 112.5 and the Yen ETF (FXY) support at 86.5.
******************************************************
ETF Master ChartPack - 300+ ETFs organized in a Master ChartList and in individual groups.
Follow me on Twitter @arthurhill - Keep up with my 140 character commentaries.
****************************************
Thanks for tuning in and have a good day!
--Arthur Hill CMT
Plan your Trade and Trade your Plan
*****************************************


