.... Meet the New Boss, Same as the Old Boss
.... Software Leads Tech with 52-week High
.... Flag Breakouts in Cloud and Internet ETFs
.... Networking and Cyber Security Join the Surge
.... Five Cyber Security Stocks (QLYS, PFPT, FTNT, PANW, FEYE)
.... SOXX Goes for Breakout as XSD Surges off Support
.... Five Semiconductor Stocks to Watch
.... Transport iShares Surges to Wedge Line
.... UPS Leads as FedEx Turns Up ....
Meet the New Boss, Same as the Old Boss
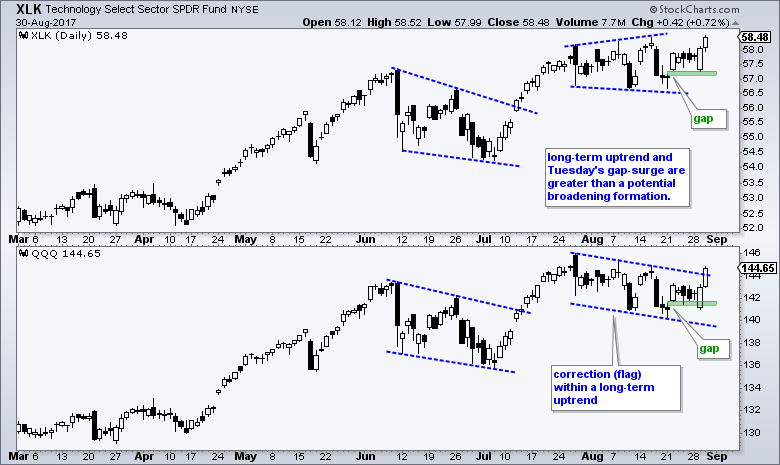
For those of us old enough to remember, this line comes from a classic song from The Who: We Won't Get Fooled Again (1971). The new market boss is the technology sector, which happens to be the same as the old market boss. The Technology SPDR (XLK) was the only sector SPDR to hit a new 52-week high on Wednesday. The Utilities SPDR (XLU) is not far behind with a 52-week high on Tuesday. The chart below shows XLK holding the gap zone on Tuesday's dip and edging above the mid August high during the day. QQQ is not far behind with a surge above the flag line. It is tough to say what will happen within the flag, but keep in mind that a falling flag is a bullish continuation pattern that forms within a bigger uptrend. This favors an upside resolution and this appears to be happening right now.
Software Leads Tech with 52-week High
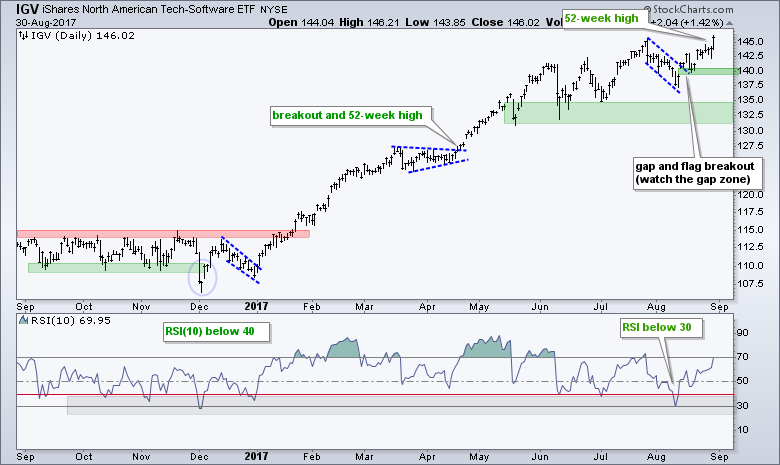
The Software iShares (IGV) is the leading industry group ETF within the technology sector because it was the only one to hit a 52-week high on Wednesday. Notice that IGV broke flag resistance with a gap-surge on August 14th and this gap held (140 area). Also notice that this flag bottomed when RSI dipped to 30. Within software, Microsoft (MSFT) and Salesforce.com (CRM) are very close to new highs, while Redhat (RHT) and Adobe (ADBE) hit new highs. Game makers Activision (ATVI) and Electronic Arts (EA) also hit new highs. Seems that software is not too concerned with the employment report, the debt ceiling debate, North Korea or seasonal weakness in the stock market.
Flag Breakouts in Cloud and Internet ETFs
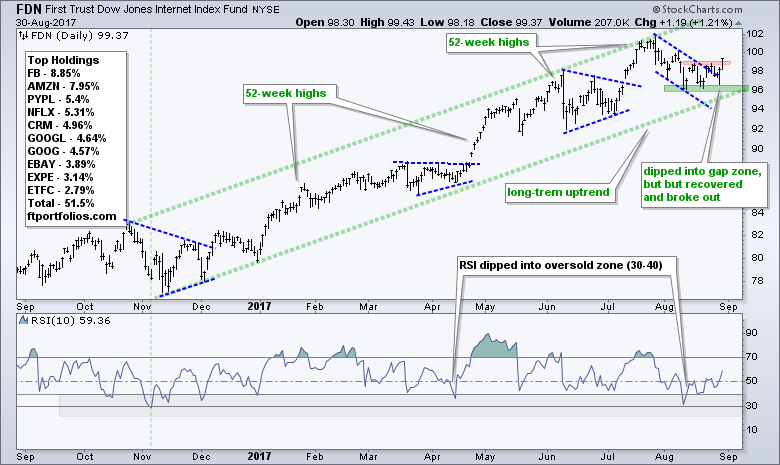
Last week I highlighted bullish flag patterns in the Cloud Computing ETF (SKYY) and the Internet ETF (FDN), and these patterns have now played out. The first chart shows a long uptrend for FDN and four corrections within this uptrend (blue lines). The falling flag was the most recent correction and this ended with the breakout over the past week. Chartists can now use the August lows to mark first support in the 96 area.
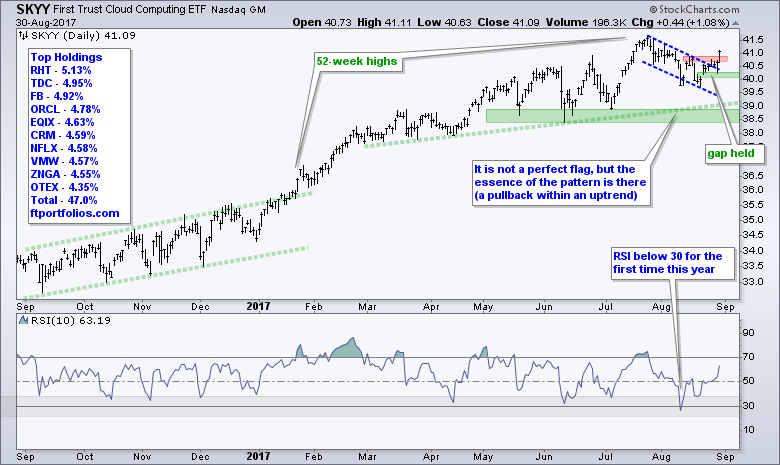
The other chart shows SKYY holding last week's gap and breaking above the mid August high on Wednesday. This ability to hold above this gap zone showed relative strength during the pullback on Tuesday morning (note that QQQ and FDN dipped into this gap zone).
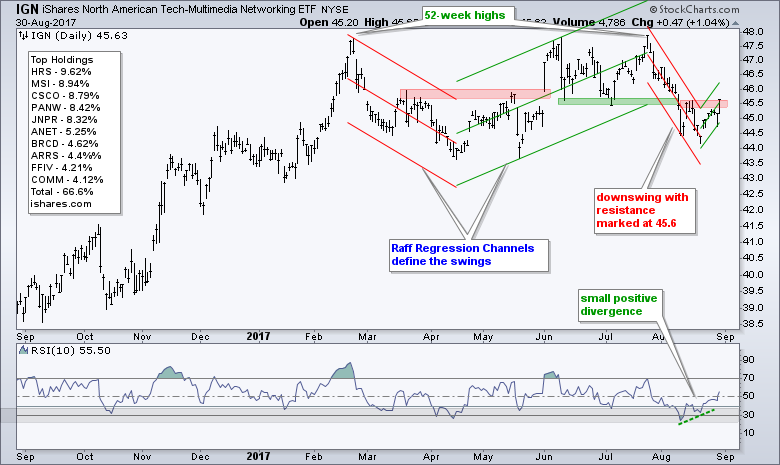
Networking and Cyber Security Join the Surge
The Networking iShares (IGN) and the Cyber Security ETF (HACK) are the laggards within the technology sector, but they came to life over the past week. The IGN chart shows four swings defined by the Raff Regression Channel. IGN reversed the August downswing with a close above 45.6 and I added a small Raff Regression Channel to define the current upswing (support at 44.70).
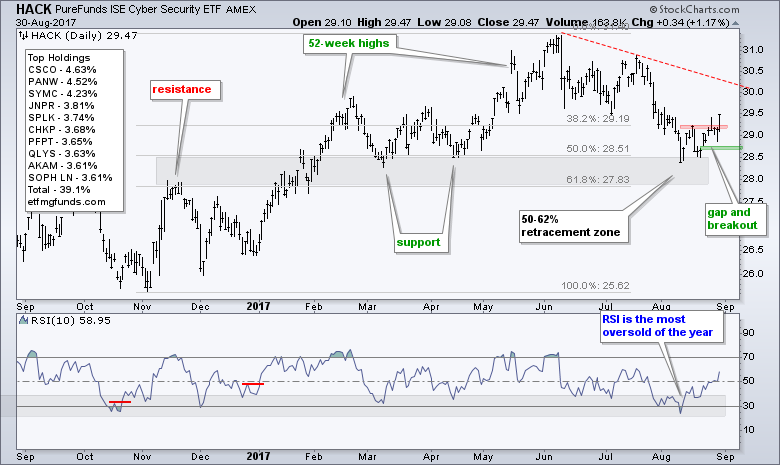
HACK found support near the 50% retracement and the March-April lows in mid August (~28.5). The ETF then gapped up with the rest of the market last week and followed through with a breakout on Wednesday. Technically, the trend since June is still down (red line), but I view this as a correction within a bigger uptrend because HACK hit a 52-week high in early June. The bigger uptrend holds more sway and this means I expect a bigger breakout at some point.
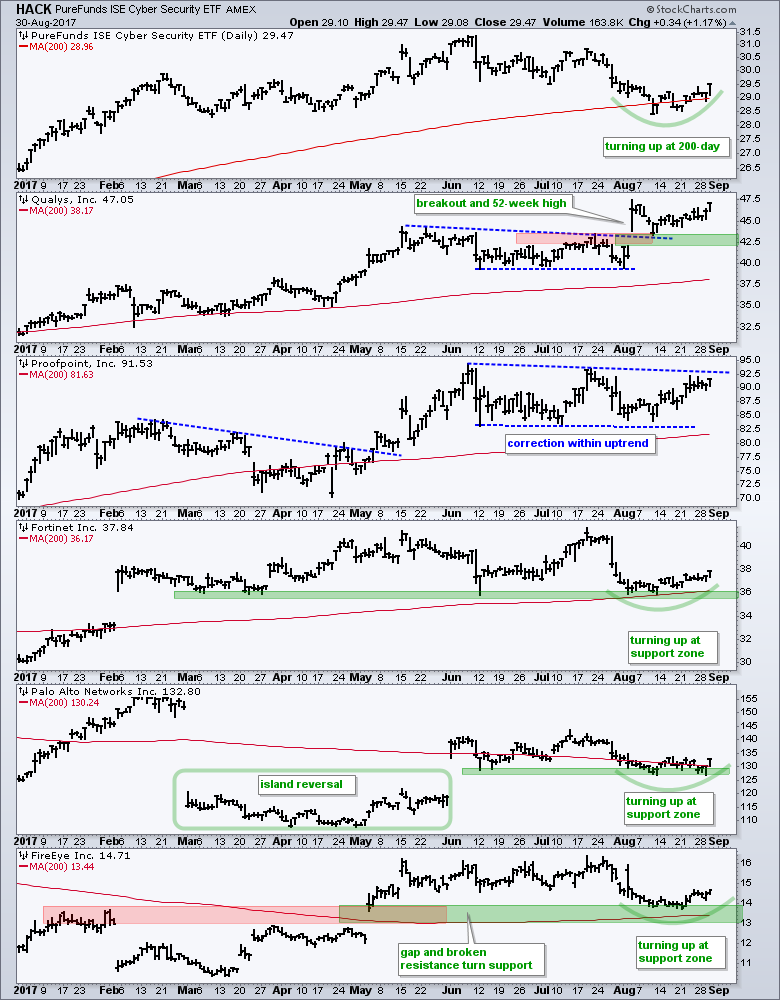
Five Cyber Security Stocks (QLYS, PFPT, FTNT, PANW, FEYE)
The next chart shows HACK with five component stocks and their 200-day SMAs. All are above their 200-day SMAs, but some more than others. Qualys (QLYS), Proofpoint (PFPT) and Fortinet (FTNT) are the leaders because they hit 52-week highs at some point this summer. The chart annotations and text speak for themselves.
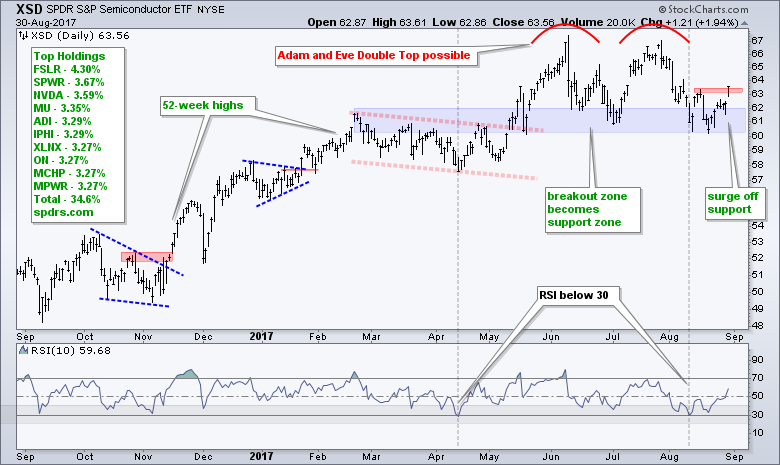
SOXX Goes for Breakout as XSD Surges off Support
The Semiconductor iShares (SOXX) and the Semiconductor SPDR (XSD) represent the same industry group, but the components and weightings in the ETFs are different. The first chart shows XSD with a potential double top that was NEVER confirmed (according to my support zone). I chose for a support ZONE because this is an ETF with 35 stocks (moving parts). In addition, broken resistance and troughs from late May to early July confirmed this zone. XSD is further confirming the validity of this zone with a seven day surge that carried it above the mid August high.
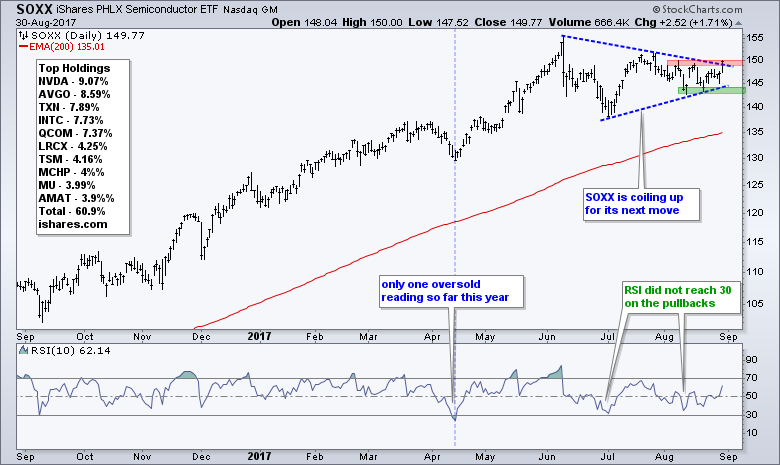
The next chart shows SOXX with a large symmetrical triangle and a surge above the upper trend line. There is still some resistance around 150 from the August highs, but the odds favor a breakout and move to new highs. Why? Because the bigger trend is up and the symmetrical triangle is a continuation pattern. In other words, it is a correction or rest within an uptrend.
Five Semiconductor Stocks to Watch
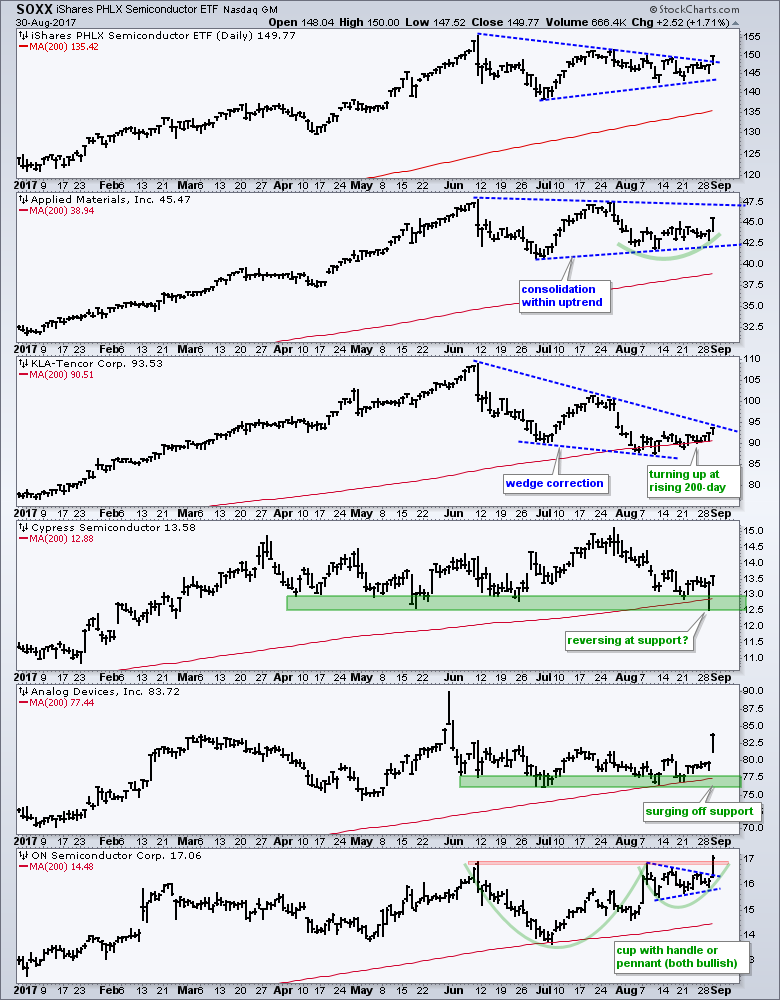
The next chart shows SOXX with five stocks and their 200-day SMAs. All are above their 200-day SMAs. AMAT and ON are the leaders because they are the furthest above. ON hit a 52-wek high with the breakout on Wednesday. KLAC appears to be turning up at its 200-day and CY could be poised to reverse at support.
Transport iShares Surges to Wedge Line
I am not a big fan of the Dow Industrials, Dow Transports and Dow Utilities because they are price-weighted averages, which means the stocks with the highest prices carry the most weight. Chartists should keep this in mind when analyzing the charts. The Transport iShares (IYT), which is based on the Dow Transports, is dominated by UPS, FDX and the railroad stocks (NSC, UNP, KSU), all of which are above $100 per share. Throw in JB Hunt (JBHT), which is a big trucking company, and we have the top six stocks accounting for around 50% of the ETF. Note that there are no airline stocks in the top ten. The five airlines account for around 20% of the ETF (UAL, ALK, LUV, DAL, AAL, JBLU).
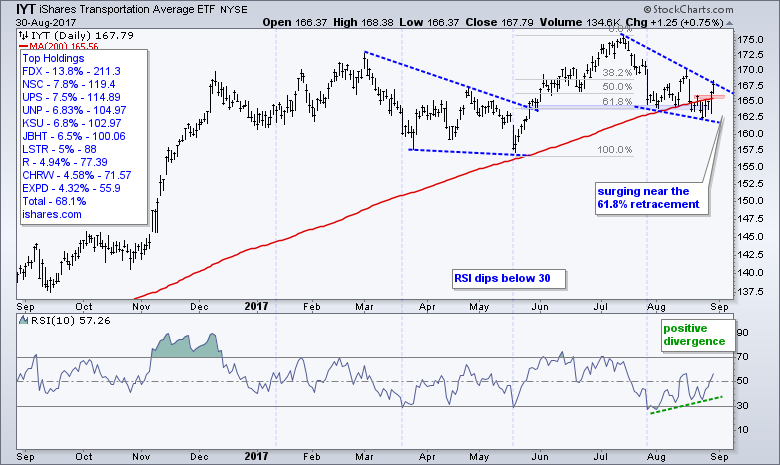
The chart shows IYT peaking in mid July and falling into August. Note that the July peak marked a 52-week high and the ETF is bouncing off the rising 200-day SMA. I think the long-term trend is up and this means the decline from mid July to late August is a correction within the bigger uptrend. Notice that IYT is reversing near the 61.8% retracement and poised to break the wedge line. There is also a positive divergence in RSI over the last few weeks.
UPS Leads as FedEx Turns Up
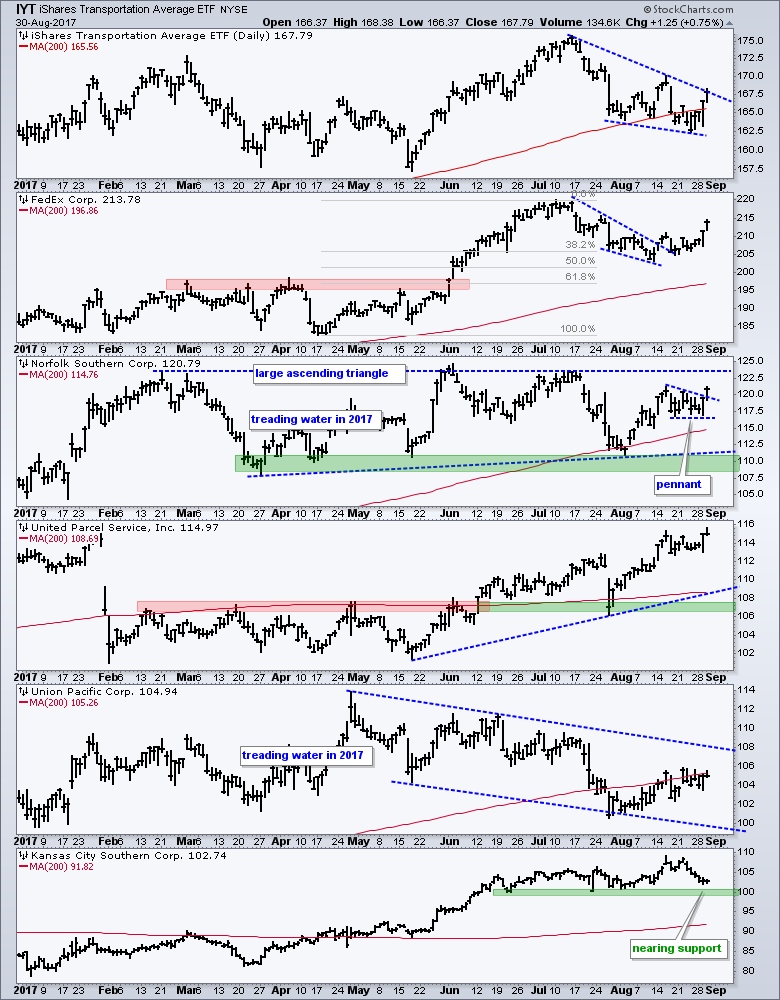
The next chart shows IYT and five top stocks with their 200-day SMAs. FedEx (FDX), United Parcel Service (UPS) and Kansas City Southern (KSU) are the leaders since May. UPS is up over 10% from its May low. FDX broke out of a wedge correction in mid August and surged the last two days. NSC broke out of a pennant and KSU is near support for a potential bounce.
******************************************************
ETF Master ChartPack - 300+ ETFs organized in a Master ChartList and in individual groups.
Follow me on Twitter @arthurhill - Keep up with my 140 character commentaries.
****************************************
Thanks for tuning in and have a good day!
--Arthur Hill CMT
Plan your Trade and Trade your Plan
*****************************************


