.... Lots of Ugly Charts can be Found
.... There are also Plenty of Strong Uptrends
.... New Highs in the Nasdaq 100
.... Netflix and Cintas Consolidate within Uptrends
.... Lilly Turns Up at Key Retracement Zone
.... Billy and Bobby Debate Tesla ....
Lots of Ugly Charts can be Found
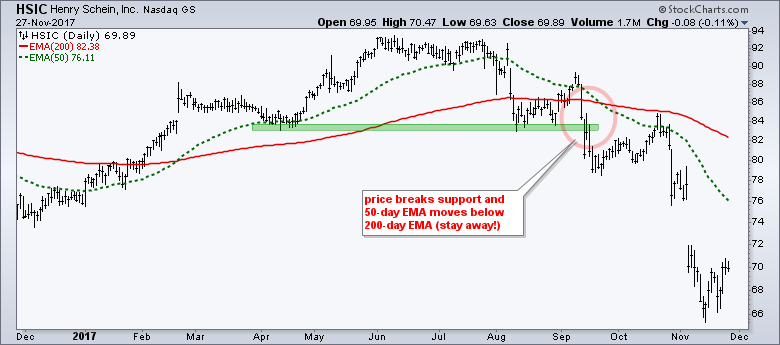
Chartists looking for weakness in the stock market can find plenty of ugly charts with long-term downtrends and 52-week lows over the last several weeks. Celgene (CELG) plunged over 30% and hit a 52-week low this month. Discovery (DISCA) has been trending lower all year and hit a 52-week low in mid November. Comcast (CMCSA) and Viacom (VIAB) led the cable group lower with new lows in November. Incyte Pharmaceuticals (INCY) and Henry Schein (HSCI) broke down in August-September and are in long-term downtrends. While not perfect, a good rule of thumb is to simply avoid stocks that are in long-term downtrends. In other words, don't try to pick bottoms. In general, I try to avoid stocks when the 50-day EMA is below the 200-day EMA.
I also ran a scan and found that 23.6% of stocks in the S&P 500 (118 stocks) are 20% or more below their 52-week highs. Remember that number (118) because it comes back. In addition, 7.6% of stocks in the index (38) are more than 50% below their 52-week highs.
There are also Plenty of Strong Uptrends
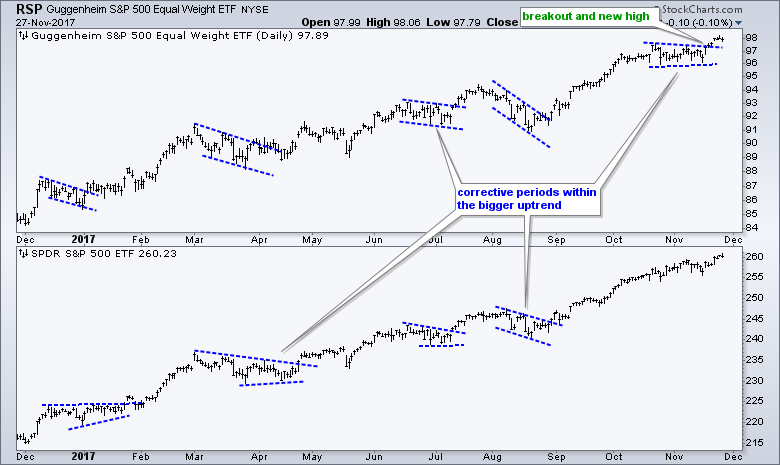
There are clearly pockets of weakness in the stock market, but this market has something for everyone because there are also plenty of new highs and strong uptrends to be found. Note that 23.6% of stocks in the S&P 500 are also within 2% of their 52-week highs. Remember that number? Thus, 118 stocks are 20% or more below their 52-week highs and another 118 are within 2% of a 52-week high. The latter 118 are clearly in uptrends and this means strength within the S&P 500 is not limited to just a few large-caps. In fact, note that both the EW S&P 500 ETF (RSP) and the S&P 500 SPDR (SPY) hit new 52-week highs over the last few days. Perhaps more importantly for the broader market, RSP broke out of a consolidation pattern the week before Thanksgiving.
New Highs in the Nasdaq 100
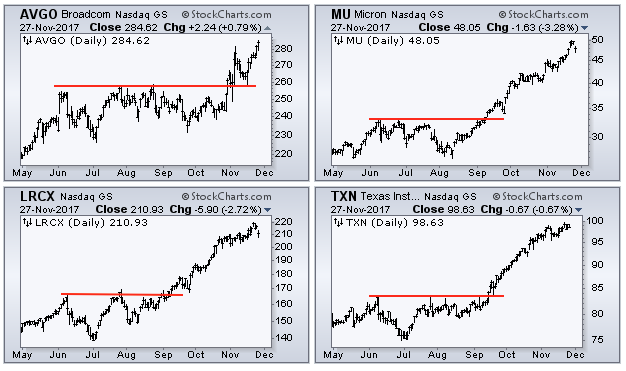
Looking through the stocks in the Nasdaq 100, I count at least 20 stocks with new highs over the last few days and these are spread throughout different groups. Adobe (ADBE), Intuit (INTU) and Autodesk (ADSK) are leading software with new highs. Broadcom (AVGO), Micron (MU), Lam Research (LRCX) and Texas Instruments (TXN) are leading semis with new highs. Facebook (FB) and Alphabet (GOOGL) are leading large-cap social-media stocks with new highs.
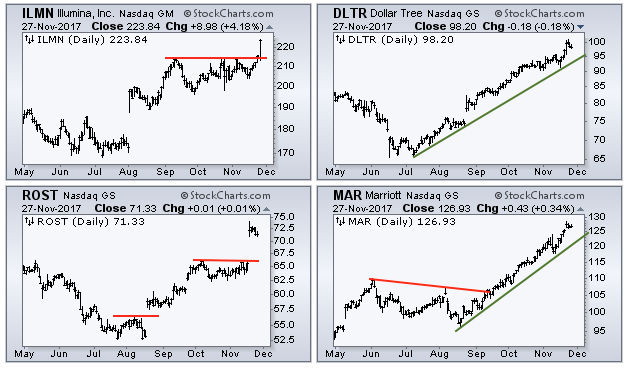
Cisco (CSCO), Amazon (AMZN) and Qualcom (QCOM) are leading large-cap tech. Yes, I am counting Amazon as a tech stock because of Amazon Web Services (AWS). Paypal (PYPL) is leading the payments space with new highs. Outside of tech, Dentsply (XRAY), Intuitive Surgical (ISRG) and Illumia (ILMN) are leading healthcare with new highs. Dollar Tree (DLTR) and Ross Stores (ROST) are leading discount retail with new highs. And finally, hotelier Marriott (MAR) hit a new high.
Our job as chartists is to weigh the evidence and take a stance. While the weak charts and new lows are certainly a concern, there are more strong charts and new highs right now. Thus, the weight of the evidence is still bullish for the broader market. The market may seem over-extended and ripe for a pullback, but I still favor bullish setups over bearish setups because the bulk of the evidence favors the bulls right now.
Netflix and Cintas Consolidate within Uptrends
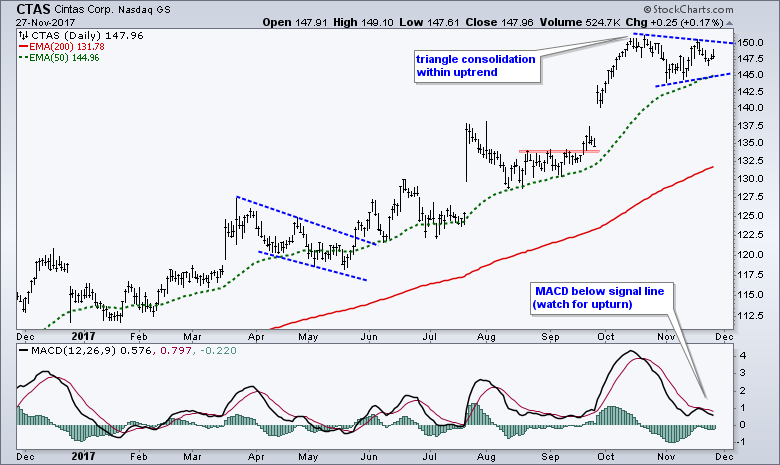
Cintas (CTAS) sports a bullish consolidation within a bigger uptrend. The long-term trend is clearly up with the stock hitting a 52-week high in October and the 50-day EMA above the 200-day EMA. CTAS stalled over the last six weeks with a triangle taking shape. A consolidation within an uptrend is typically a bullish continuation pattern and I am watching for a breakout.
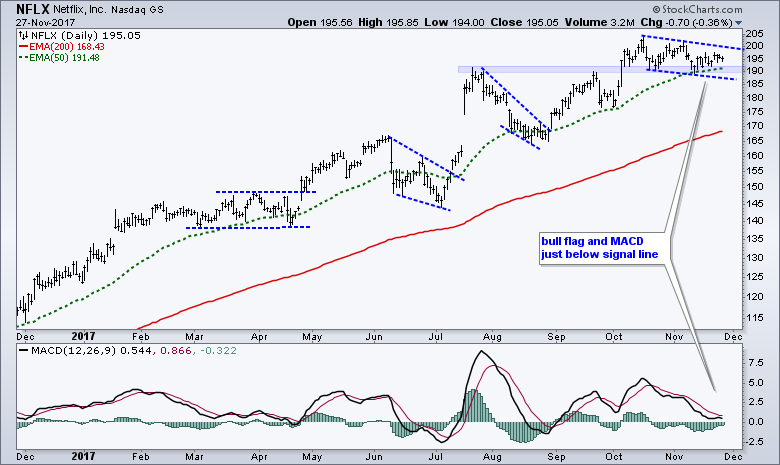
Netflix (NLFX) also sports a bullish continuation pattern as it fell back over the last six weeks. Note that NFLX hit a 52-week high in October and then pulled back with a falling flag. The broken resistance levels turn into a support zone in the 190 area and chartists should be on guard for a flag breakout to signal a continuation higher.
Lilly Turns Up at Key Retracement Zone
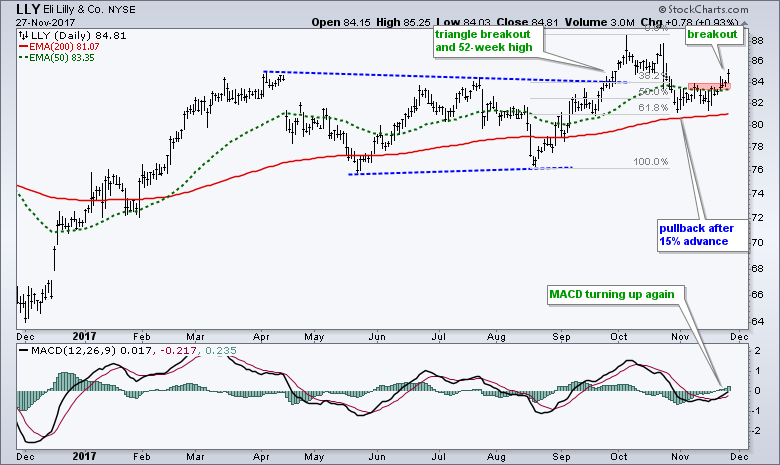
The next chart shows Eli Lilly (LLY) breaking out of a large triangle pattern and hitting a 52-week high in October. The stock fell back into the triangle consolidation, but this does not detract from the 52-week high and long-term uptrend. Notice that LLY surged some 15% from mid August to mid October and was entitled to a pullback. The decline to the 81 area retraced around 61.8% of that advance and this is part of a normal upward progression (two steps forward and one step backward). LLY looks like it is ending the pullback with a bounce above the mid October high. Assuming the long-term uptrend continues, I would expect new highs from LLY in the coming weeks.
Billy and Bobby Debate Tesla
Tesla (TSLA) is always an interesting stock. In addition to its cutting edge technology and eccentric leader, chartists can make the case for a bearish double top or an impending bounce off support. First, Bobby Bear argues that TSLA peaked in the 390 area in June and October to form a double top. The stock then broke below double top support with a gap down and sharp decline below 300. Tesla also broke its 200-day SMA (not shown) and is lagging the broader market since October.
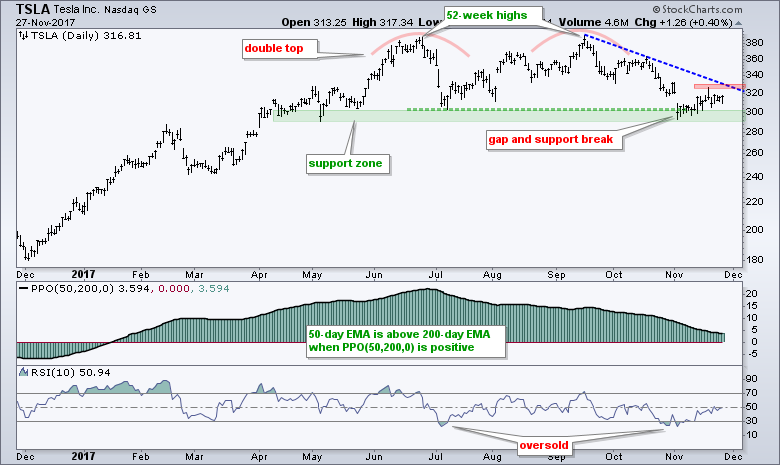
Billy Bull counters that the stock rebounded right after the gap and support break. Thus, the double top is not fully confirmed. In addition, support in the 300 area extends back to April with multiple touches and RSI dipped below 30 to become oversold in late October and early November. Thus, Tesla is poised to bounce off support and resume its uptrend. Chartists looking for a short-term breakout can watch for a close above the mid November high. I side with Bobby Bull because we are in a bull market and the long-term trend is up (new high in October and 50-day EMA above 200-day EMA). Furthermore, I think the decline from late September to early November is just a correction within the bigger uptrend.
ETF Master ChartPack - 300+ ETFs organized in a Master ChartList and in individual groups.
Follow me on Twitter @arthurhill - Keep up with my 140 character commentaries.
****************************************
Thanks for tuning in and have a good day!
--Arthur Hill CMT
Plan your Trade and Trade your Plan
*****************************************


