 |
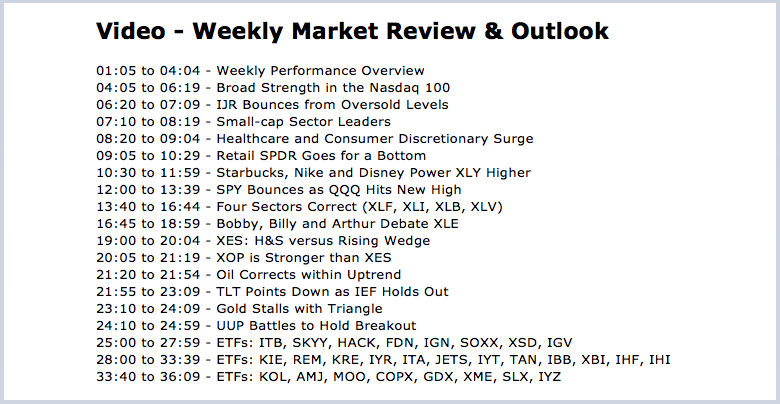
.... Broad Strength in the Nasdaq 100 .... IJR Bounces from Oversold Levels .... Small-cap Sector Leaders .... Healthcare and Consumer Discretionary Surge .... Retail SPDR Goes for a Bottom .... Starbucks, Nike and Disney Power XLY Higher .... SPY Bounces as QQQ Hits New High .... Four Sectors Correct (XLF, XLI, XLB, XLV) .... Bobby, Billy and Arthur Debate XLE .... XES: H&S versus Rising Wedge .... XOP is Stronger than XES .... Oil Corrects within Uptrend .... TLT Points Up as IEF Holds Out .... Gold Stalls with Triangle .... UUP Battles to Hold Breakout .... Note from Art's ChartList .... |
----- Art's Charts ChartList (updated November 17th) -----
Broad Strength in the Nasdaq 100
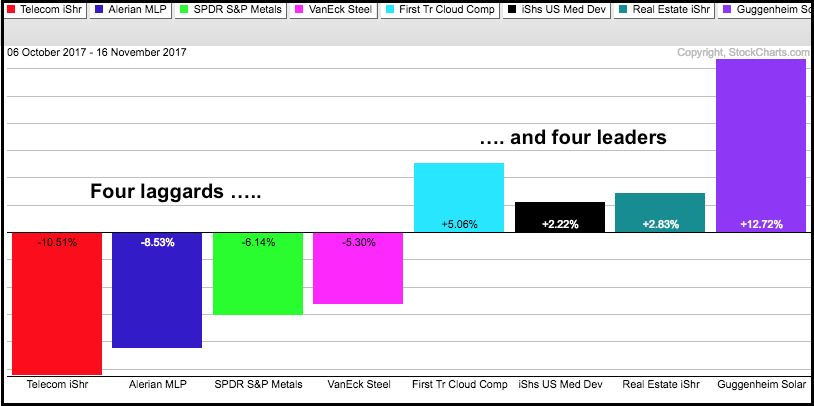
It has been a tale of two markets for some time, but these two markets are not equally divided. Even though there are pockets of weakness in the stock market, the pockets of strength are bigger and these pockets are keeping the major index ETFs afloat. On the weak side, the Telecom iShares (IYZ) and MLP ETF (AMLP) hit new lows this week, while the Metals & Mining SPDR (XME) and the Steel ETF (SLX) broke below their September lows. On the strong side, we have the Home Construction iShares (ITB), Cloud Computing ETF (SKYY), Medical Devices ETF (IHI), REIT iShares (IYR) and Solar Energy ETF (TAN) hitting new highs this week. The Nasdaq 100 EW ETF (QQEW) also hit a new high and this reflects broad strength in the Nasdaq 100 and the technology sector.
Programming Note
I will be taking some vacation next week and Art's Charts will not be published from 20 to 24 November. I will return the week after Thanksgiving. Happy Turkey Day and happy Black Friday!
IJR Bounces from Oversold Levels
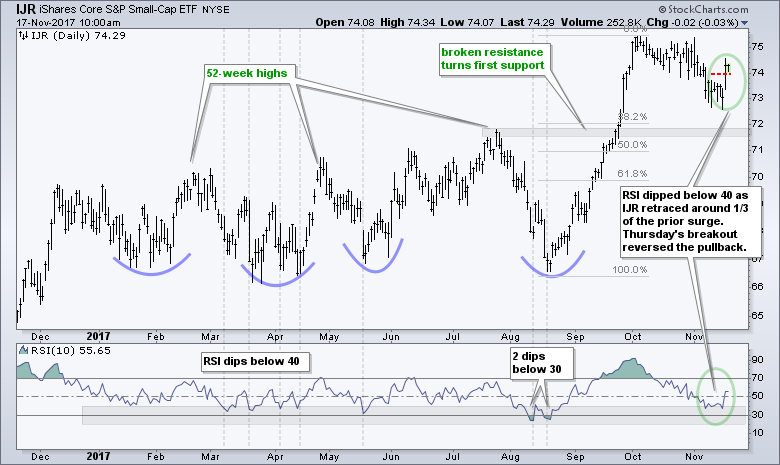
The biggest move so far this week came from small-caps as the S&P SmallCap iShares (IJR) surged 1.71% on Thursday. On the price chart, RSI(10) dipped into the oversold zone (<40) as IJR fell back to the 73 area. The ETF firmed in this area for five days and then surged above first resistance at 74. This is the first sign than the pullback is ending and the bigger uptrend is resuming.
Small-cap Sector Leaders
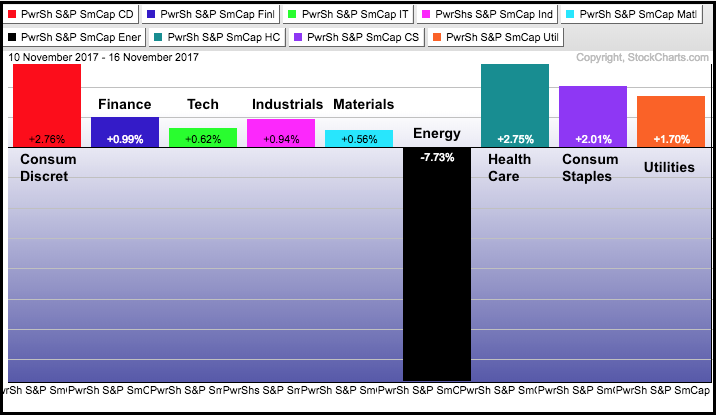
As with the S&P 500, the S&P Small-Cap 600 can be divided into nine sector ETFs and we can use these to identify the leaders and laggards. The PerfChart below shows week-to-date performance for the nine small-caps sectors. Notice that the SmallCap Consumer Staples ETF (PSCC) and SmallCap HealthCare ETF (PSCH) led the advance. The SmallCap Consumer Discretionary ETF (PSCD) and SmallCap Utilities ETF (PSCU) also performed well, but the SmallCap Energy ETF (PSCE) was hit hard.
Healthcare and Consumer Discretionary Surge
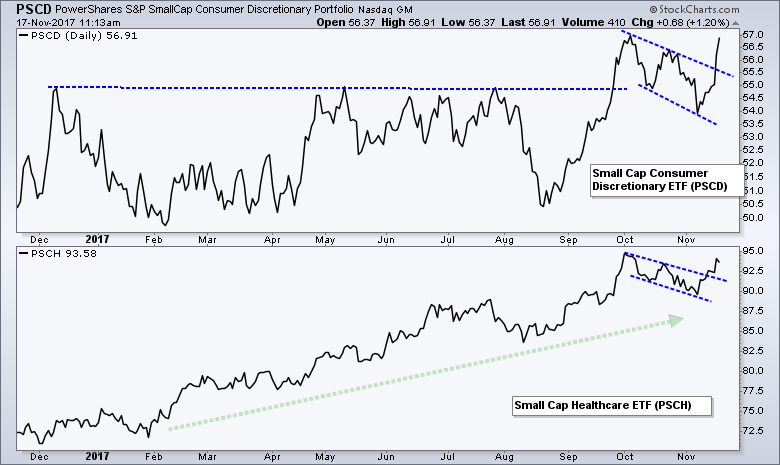
The chart below shows the SmallCap Consumer Discretionary ETF (PSCD) reversing and breaking out of a falling flag with a sharp move on Thursday. The SmallCap HealthCare ETF (PSCH) is much stronger overall because it sports a steady uptrend over the past year. PSCH broke out of a falling wedge with a surge the last few days. These ETFs trade relatively low volume so they may not be suitable for trading or investing. Nevertheless, we can chart them to identify strong and weak areas of the small-cap universe. You can also easily access their holdings at the PowerShares website.
Retail SPDR Goes for a Bottom
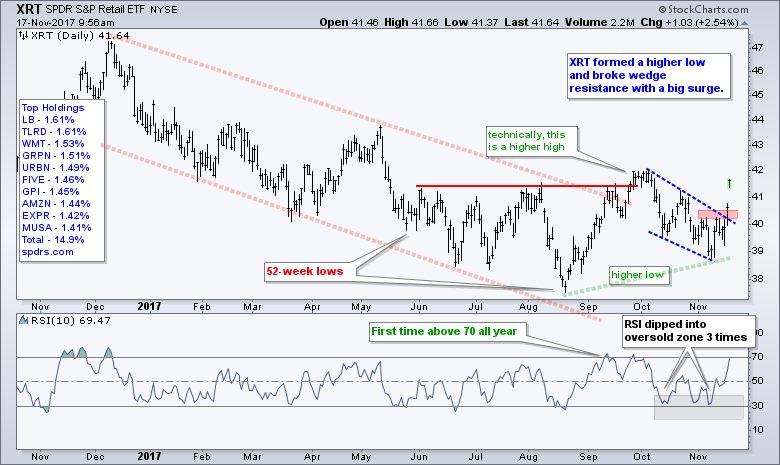
The Retail SPDR (XRT) is one of the weakest industry-group ETFs year-to-date with a 6.74% loss in 2017. This, however, is nowhere near the year-to-date loss for the Oil & Gas Equip & Services SPDR (XES), which is down around 30%. Yes, energy is still one of the weakest sectors in 2017. Returning to retail, strength in the SmallCap Consumer Discretionary ETF stems from strength in retail and this is reflected in XRT. Notice that XRT has been flat since late May with dozens of crosses at 40. Recently, the ETF exceeded the summer highs and pulled back with a falling wedge. XRT surged above wedge resistance this week and a higher low formed in early November. Thus, it looks like the trend is reversing and XRT could be headed for the mid 40s.
Before leaving this ETF, note that Wal-Mart (WMT) is the third biggest component and the stock was up 10.90% on Thursday. Even so, Wal-mart only accounts for 1.53% of the ETF and the top ten stocks account for just 14.90%. This is a very broad ETF with 89 stocks spread all across the retail spectrum. It is about as good of a litmus test as you will find for the retail sector as a whole (not just Amazon and Wal-mart).
Starbucks, Nike and Disney Power XLY Higher
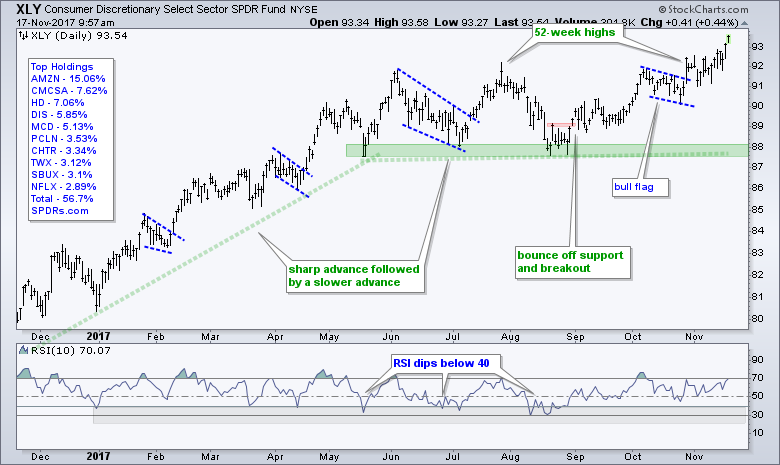
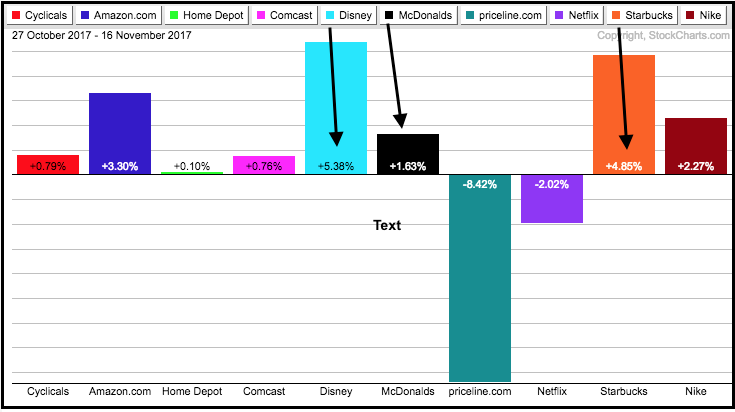
Let's not forget about our large-cap friends either. I am also seeing renewed strength in some beaten down names in the Consumer Discretionary SPDR (XLY). Note that XLY broke out of a bull flag in late October and hit a new high on Thursday. Netflix (NFLX), Amazon (AMZN), McDonalds (MCD) and Home Depot (HD) are leading this sector year-to-date. MCD, AMZN and HD hit new highs this week. Starbucks, Disney and Nike are lagging the sector, but all three are above water year-to-date. In fact, these three are actually leading the sector over the last three weeks. Thus, we are seeing some beaten down names come to life and this is positive for the sector. These stocks would be doing great if it were up to my spending habits. I love Nike products, ice vanilla lattes and ESPN.
SPY Bounces as QQQ Hits New High
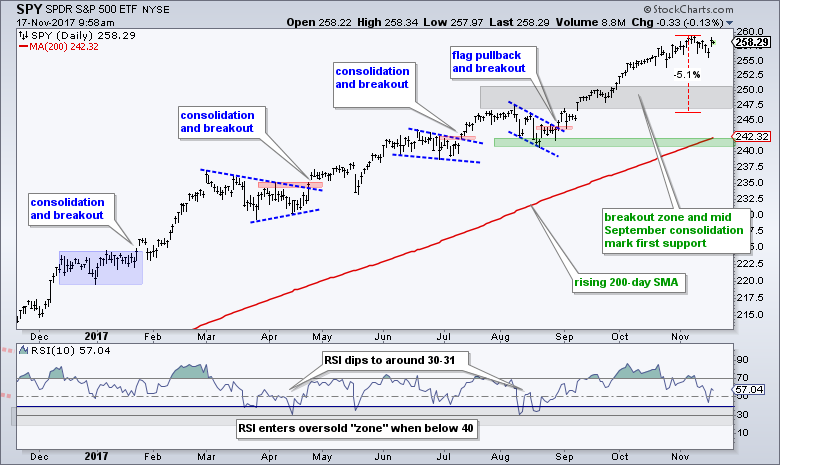
The S&P 500 SPDR (SPY) edge lower for five days and then popped on Thursday. This does nothing to the overall chart. The big trend is up with a 52-week high less than two weeks ago. The ETF remains extended after a 7% advance since mid August, but selling pressure remains muted. I am going to leave my pullback zone at 247-250, which represents a 3-5% pullback. While I am not sure if the pullback has started or not, I do know that SPY has yet to become short-term oversold and I prefer to wait for a pullback or a bullish continuation pattern to take shape.
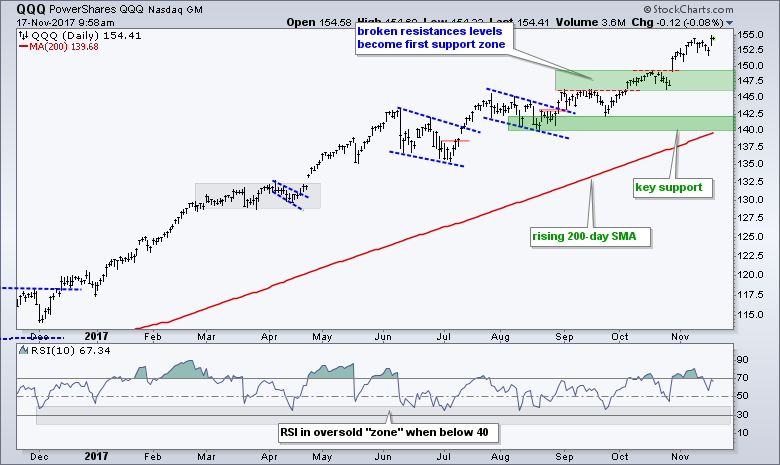
The Nasdaq 100 ETF (QQQ) remains the leader with a fresh new high this week. QQQ is now up around 10% since mid August and extended as well. The first pullback zone to watch is in the 146-149 area.
Four Sectors Correct (XLF, XLI, XLV, XLB)
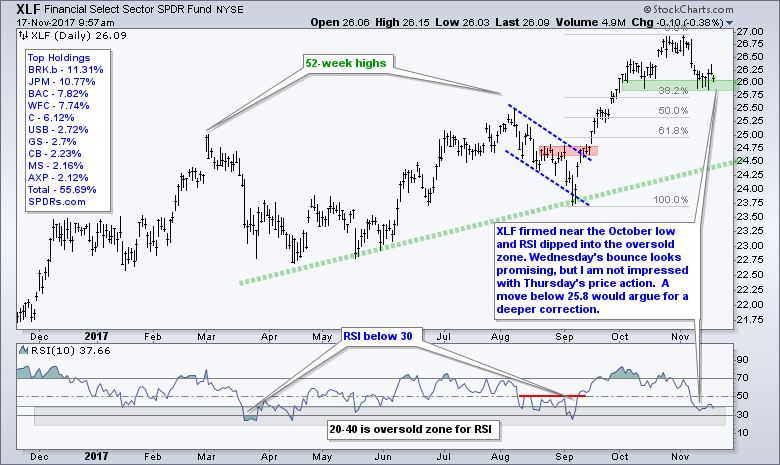
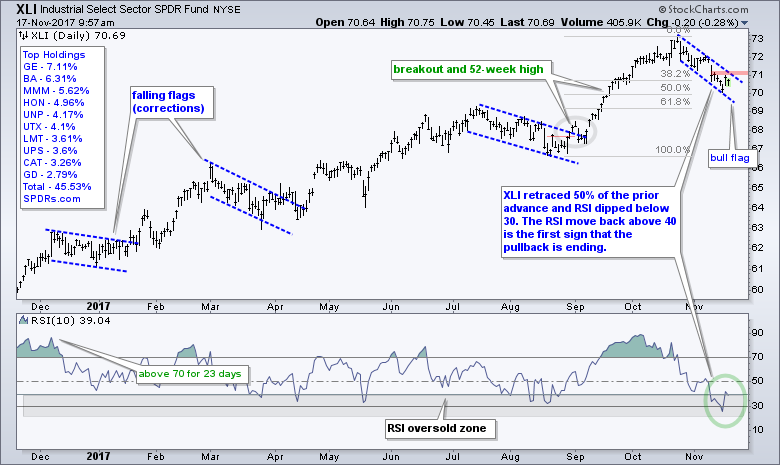
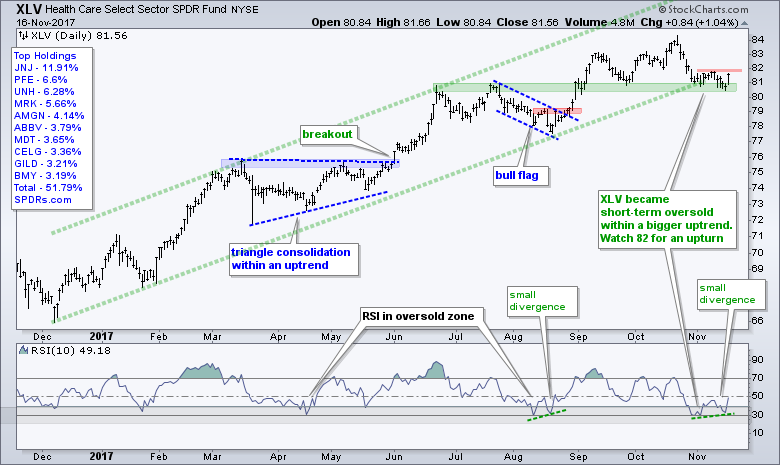
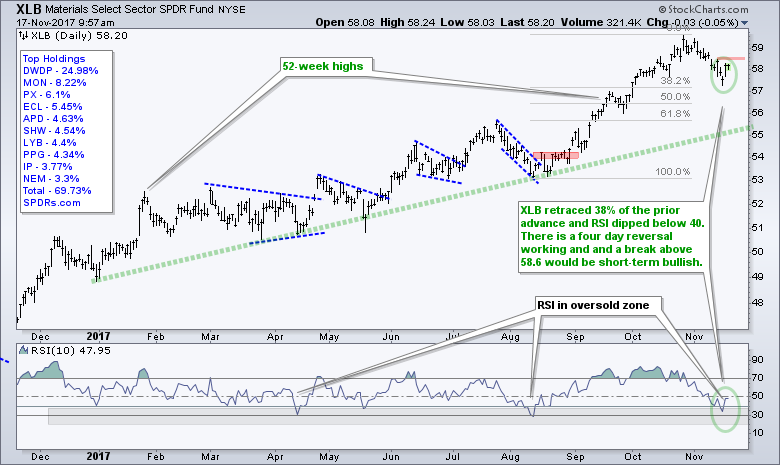
Even though the S&P 500 did not correct much over the last few weeks, four sector SPDRs corrected with 3-4% pullbacks. The next charts show the Financials SPDR (XLF), Industrials SPDR (XLI), Health Care SPDR (XLV) and Materials SPDR (XLB) hitting new highs a few weeks ago and then falling back in November. RSI(10) moved into the oversold zone for all four and all four bounced on Wednesday or Thursday. Breakouts in XLI and XLV would be positive for the broader market, as would a solid bounce of support for XLF.
Bobby, Billy and Arthur Debate XLE
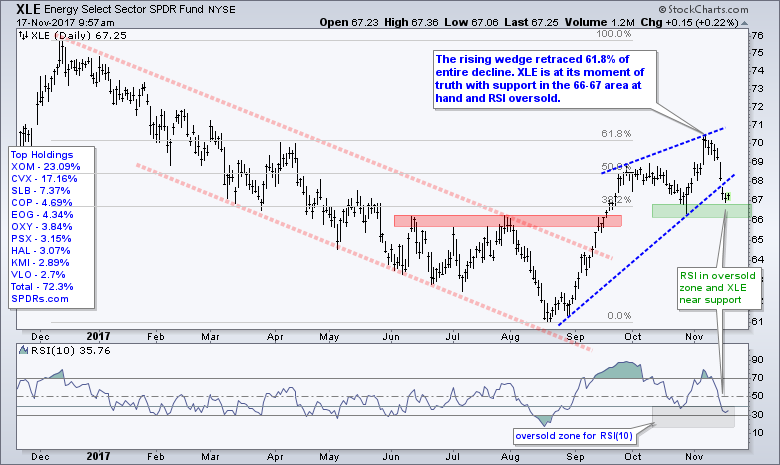
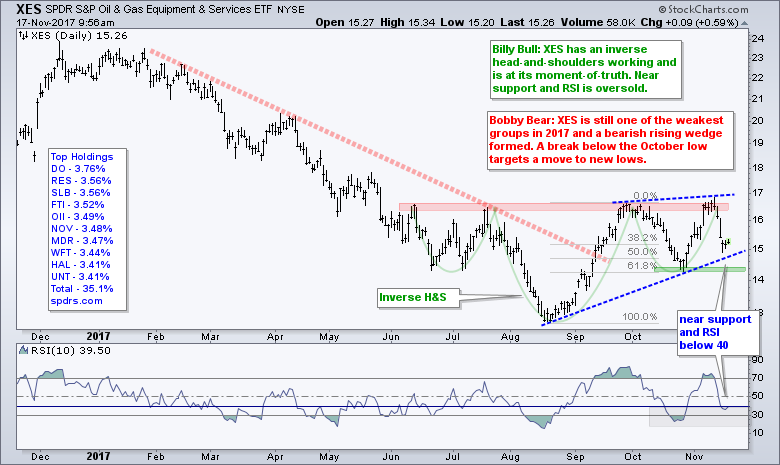
The Energy SPDR (XLE) and the Oil & Gas Equip & Services SPDR (XES) show a classic conundrum for technical analysis. Ten people look at a chart and you get eleven different assessments. Billy Bull sees a breakout with the September surge, a pullback and a surge above 70 to forge a higher high in early November. The sharp pullback over the last four days presents an opportunity because XLE is near support (66-67) and RSI is in the oversold zone.
Bobby Bear sees a reversal at the 61.8% retracement in early November and a wedge line break this week. Bobby does not expect support to hold because the wedge was just a counter-trend rally within a bigger downtrend. XLE is still down over 8% year-to-date and the worst performing sector this year.
Arthur Hill is trying to weigh the evidence and see that is really there. The advance from mid August to early November was explosive with a 15% gain. XLE broke the summer highs in the process and I think this qualifies for a trend reversal. Assuming the trend is up, this means the decline back to the 67 area created an opportunity because XLE is oversold within an uptrend. A close below 66 would throw cold water on this assessment.
XES: H&S versus Rising Wedge
The bullish case for the Oil & Gas Equip & Services SPDR (XES) is less clear because it did not break the resistance zone. A base could still be forming and the 14.5-15 support zone represents a moment-of-truth. Oil is still in an uptrend and this favors further upside in XES. Thus, this may be an opportunity with RSI moving into the oversold zone.
XOP is Stronger than XES
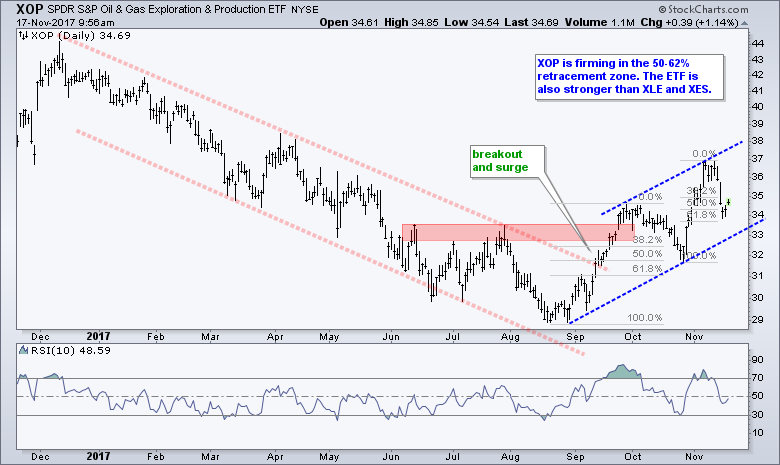
The Oil & Gas E&P SPDR (XOP) is stronger than XES because it broke the summer highs, took a step back with the 50% retracement to 32 and surged above the September high. The blue trend lines show a rising channel instead of a rising wedge. Moreover, XOP fell back to a potential reversal zone with a 50-61.8% retracement of the prior surge.
Oil Corrects within Uptrend
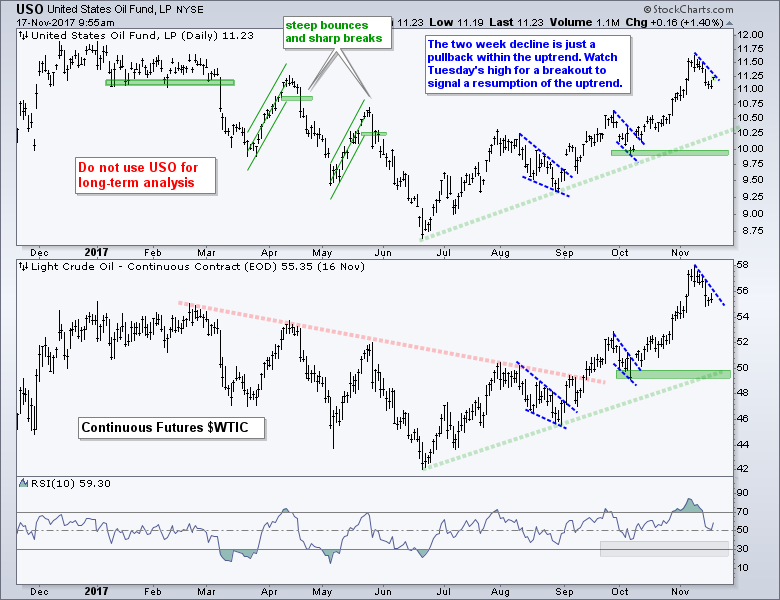
Oil fell back with a 3-4% decline over the last two weeks, but crude is entitled to a correction and the bigger trend is clearly up. Keep in mind that the Light Crude Continuous Contract ($WTIC) was up 15% from early October to early November and hit a 52-week high. Even though I am not sure how far a pullback will extend, I assume it is a mere pullback because of the bigger uptrend. Ideally, a move into the 30-40 zone for RSI(10) would set up a mean-reversion opportunity.
TLT Points Up, IEF Has yet to Confirm
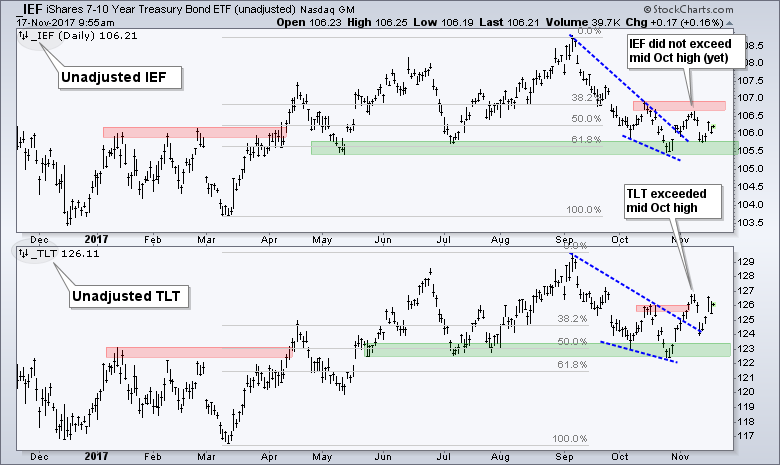
As noted in Thursday's commentary, there is a battle royal raging in the bond market. The unadjusted 7-10 YR T-Bond ETF (IEF) and 20+ YR T-Bond ETF (TLT) found support near the summer lows and bounced. TLT broke out, but IEF did not. Thus, TLT is pointing to higher Treasury bond prices and lower yields, but IEF has yet to confirm with a break of the red resistance zone. Watch this closely because a breakout in IEF could be positive for utilities, staples, REITs and gold, but negative for banks and brokers.
For more insight on the junk bond plunge, here is a link to an interview with Rick Rieder, global chief investment officer at BlackRock, discussing the future of the high-yield market.
Gold Stalls with Triangle
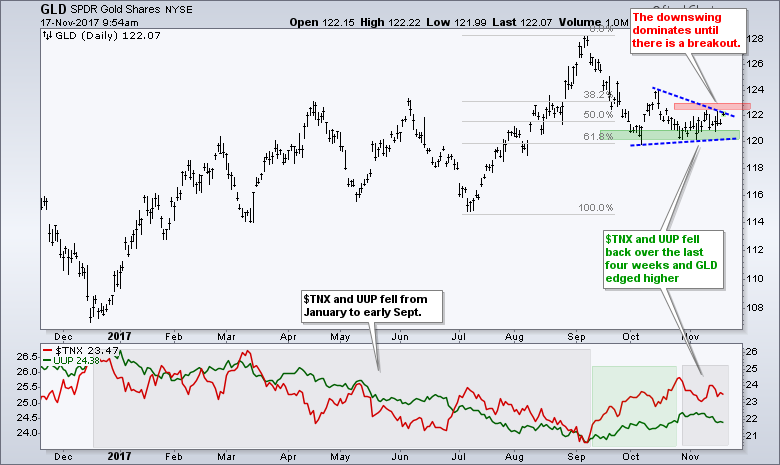
The Gold SPDR (GLD) has done nothing the last two weeks. GLD fell from mid September to mid October as the 10-yr T-Yield ($TNX) and US Dollar ETF (UUP) moved higher. The 10-yr Yield and Dollar fell a bit in November, but gold did not bounce much and remains quite subdued. GLD remains stuck in a triangle consolidation and a break below 120 would signal a continuation lower. On the upside, a break above 123 would be bullish for bullion. I will be taking my cues from the bond market. A breakout in IEF would signal lower yields and this would be bullish for gold.
UUP Battles to Hold Breakout
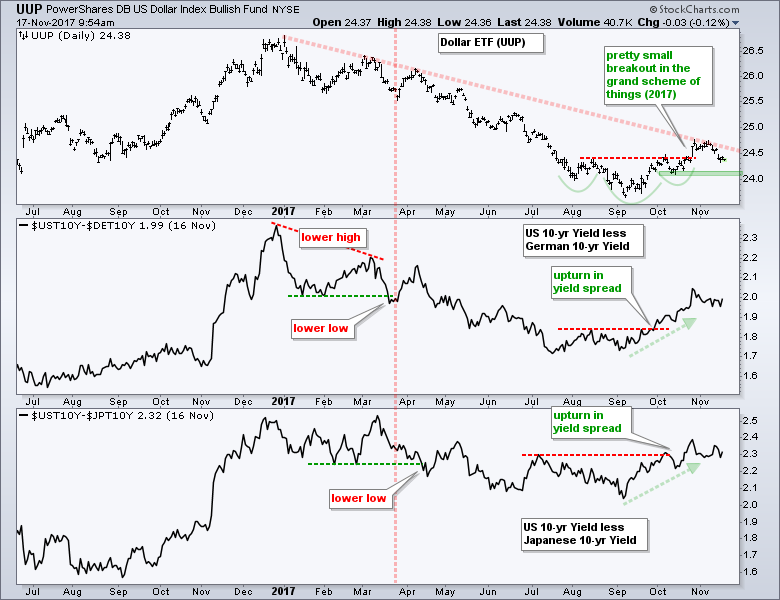
The US Dollar ETF (UUP) got a breakout in late October and then fell back over the last few weeks. This is not enough to negate the breakout, but price action since the breakout is hardly inspiring for Dollar bulls. A break below the October low would fully negate this small breakout and put the bigger downtrend in the Dollar back in play.
Notes from Art's ChartList
- The following bullet points are comments related to this week's update of the Art's Charts ChartList.
- The Home Construction iShares (ITB) hit a new high this week and continues to lead.
- The Retail SPDR (XRT) formed a higher low and broke wedge resistance with a big surge this week.
- For the second time in two months, the Cloud Computing ETF (SKYY) gapped up and surged to a new high.
- The Cyber Security ETF (HACK) came to life with a gap and surge off support.
- The on-again off-again uptrend is on-again as the Networking iShares (IGN) broke out with a surge the last five days.
- The Software iShares (IGV) consolidated with a flat flag over the last three weeks.
- The Broker-Dealer iShares (IAI) surged to new highs and then consolidated the last four weeks. A breakout at 58.5 would be bullish.
- The Insurance SPDR (KIE) fell back with a bull flag over the last four weeks and RSI moved into the oversold zone.
- The Mortgage REIT ETF (REM) shows signs of an upturn as RSI moved above 40 and the ETF broke 45 this week.
- The Regional Bank SPDR (KRE) bounced off the 50% retracement and breakout zone as RSI moved from oversold levels.
- The Airline ETF (JETS) reversed its downswing with a break above the Raff Regression Channel this week.
- The Transport iShares (IYT) hit the 61.8% retracement and breakout zone as RSI became oversold. And then surged on Thursday.
- The Biotech iShares (IBB) finally found support near the August low and RSI did the oversold double dip. The big trend is still up and this is still a mean-reversion opportunity. Just have an exit plan in place before trading!
- The Oil & Gas Equip & Services SPDR (XES) has a bullish inverse head-and-shoulders working or a bearish rising wedge.
- The Oil & Gas E&P SPDR (XOP) is stronger than XES and retraced 50-62% of the prior advance.
- The Agribusiness ETF (MOO) retraced 38% of its prior advance and RSI dipped below 30. The ETF then surged above the November trend line.
- The Copper Miners ETF (COPX) fell back toward its September low (support) and RSI dipped below 30 (oversold). The long-term trend is still up and JJC has a bullish wedge working the last five weeks.
- As with the Metals & Mining SPDR (XME) last week, the Steel ETF (SLX) broke down this week with a sharp decline below the September low.
- Oversold readings are usually useless in downtrends, but the Telecom iShares (IYZ) seems to bounce after RSI becomes oversold. Note that RSI just moved back above 30.
ETF Master ChartPack - 300+ ETFs organized in a Master ChartList and in individual groups.
Follow me on Twitter @arthurhill - Keep up with my 140 character commentaries.
****************************************
Thanks for tuning in and have a good day!
--Arthur Hill CMT
Plan your Trade and Trade your Plan
*****************************************

