- SPY Extends Extraordinary Run.
- Biotech ETFs Lead Healthcare Sector.
- Finance-Related ETFs Extend Breakouts.
- Copper ETN Pulls Back within Trend.
- Is Telecom Turning the Corner?
SPY Extends Extraordinary Run
The major index ETFs remain in strong uptrends, both short-term and long-term. The S&P 500 SPDR and Dow SPDR are up almost 6% year-to-date, while the S&P MidCap SPDR and S&P SmallCap iShares are up around 4.5% this year. Even though stocks "seem" ripe for a rest or a pullback, timing a correction is easier said than done.
SPY was ripe for a pullback in late September, late October, mid November, early December and mid January. SPY did, in fact, rest a bit, but we never saw much of a pullback. The last pullback that was more than 3% occurred in October-November 2016 (304 days ago). The pink line, which is the Zigzag set at 3%, only changes direction when there is a move in excess of 3%. In addition, the 10-day Rate-of-Change has not been below 3% since June 2016.
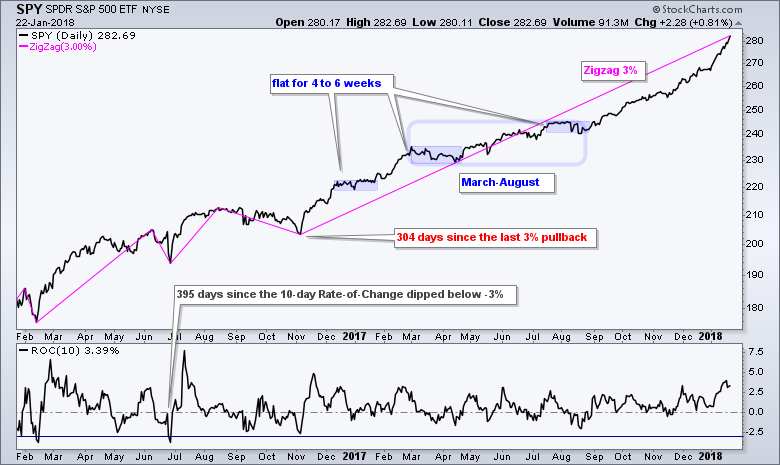
The three blue areas on the chart mark sideways consolidations that lasted four to six weeks. Keep in mind that corrections be based on price, time or both. For example, a pullback could retrace 38.2-61.8% of the prior advance, which would be a price correction. Alternatively, prices could move sideways for a few weeks and a flat consolidation could form. This would be a time correction. Sometimes we see a combination of the two with a falling flag or wedge.
I do not know when the next correction will occur. In addition, I do not know if it will be a price correction, a time correction or a combination of the two. There is even a third option: prices could simply continue higher at a slower and choppier pace, similar to the period from March to August 2017 (blue outline).
Four Big Sectors Show Internal Leadership
The High-Low Percent indicators measure Net New Highs as a percentage of total issues. Stocks recording new highs show strength and the sectors with the highest High-Low Percent numbers have the highest percentage of leaders. Furthermore, stocks recording new highs are in strong uptrends.
The chart below shows the High-Low Percent indicators for the nine sector SPDRs with the highest values at the top (strongest). The indicator is above +30 percent for the finance, technology, consumer discretionary and healthcare sectors. These are the four biggest sectors in the S&P 500 and they account for 65% the index.
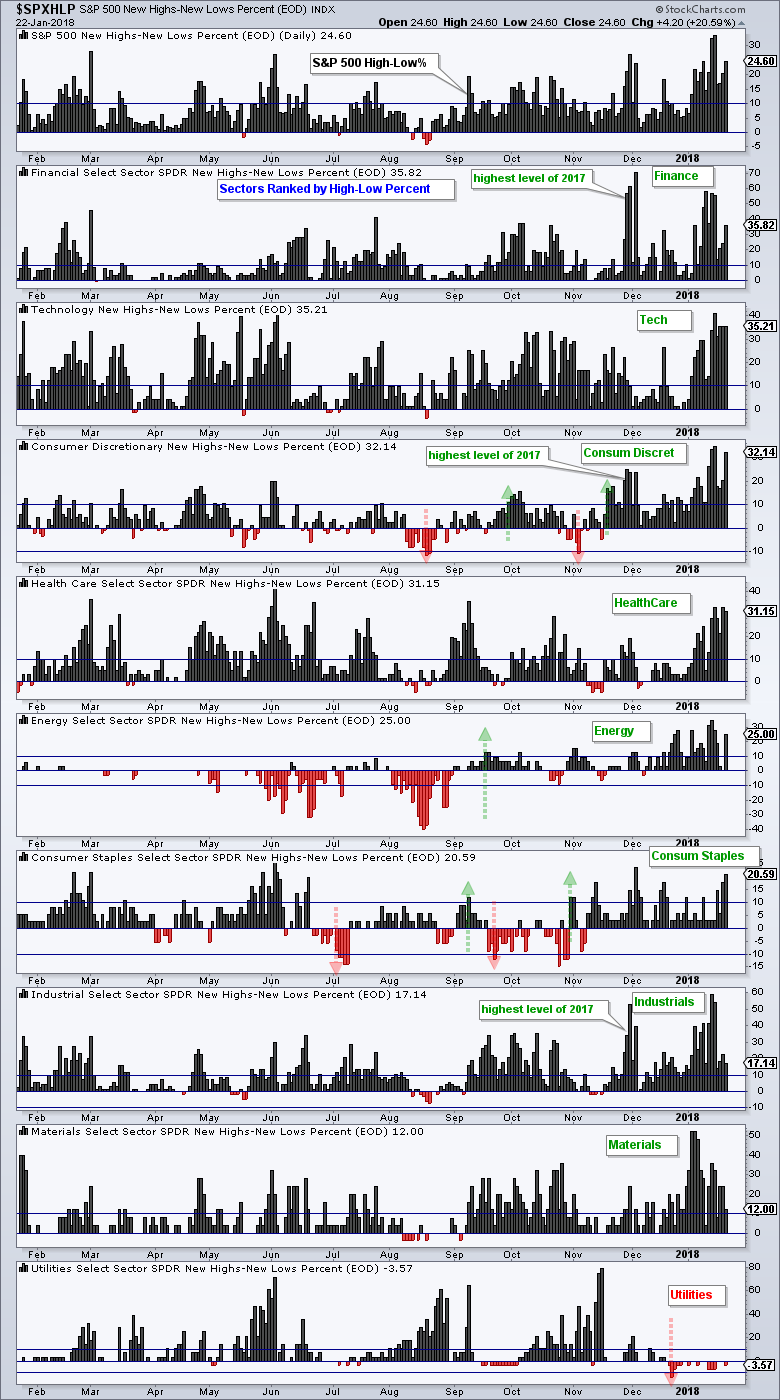
The market is clearly on solid footing when the four biggest sectors are leading in the new high category. In addition, note that finance, technology and consumer discretionary are part of the offensive side of the stock market (risk on). Industrials is the fourth offensive sector. XLI High-Low% ($XLIHLP) exceeded 50% last week and dropped to around 17% on Monday.
Biotech ETFs Lead Healthcare Sector
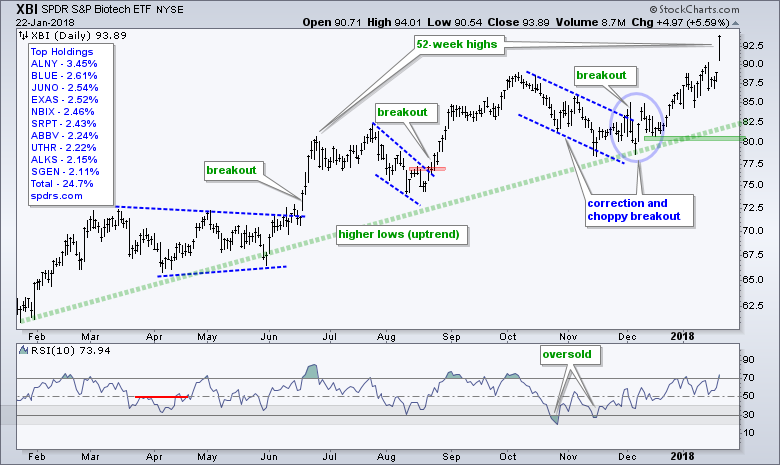
The Biotech iShares (IBB) and the Biotech SPDR (XBI) surged to new highs on Monday with outsized gains. XBI gained over 5%, which was the most since November 2016. IBB gained over 3%, which was the most since June 2017.
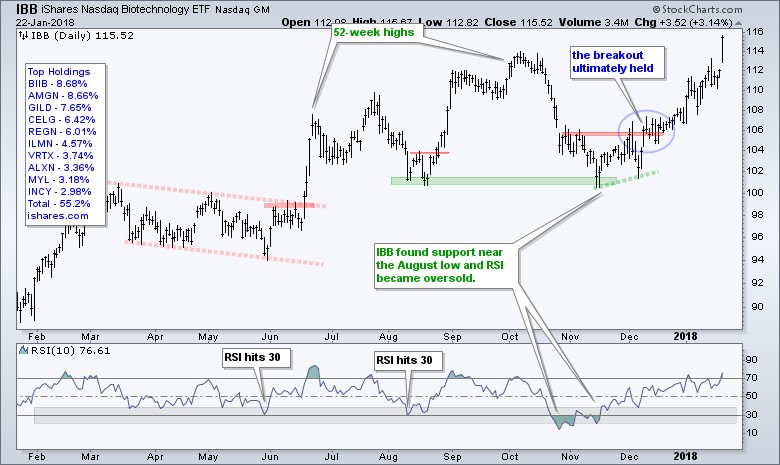
The new highs do not tell us much new because the long-term trends were already up and higher highs are expected in an uptrend. Notice that IBB and XBI recorded new highs throughout 2017. Both dipped from mid October to mid November, but these dips proved to be a correction within an uptrend, which is an opportunity.
Finance-Related ETFs Extend Breakouts
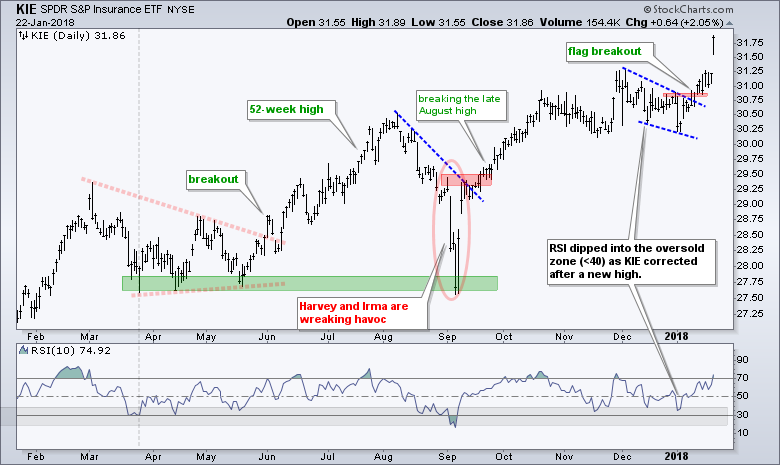
It was another big day for the Broker-Dealer iShares (IAI), Regional Bank SPDR (KRE) and Insurance SPDR (KIE). Note that all three broke out of corrective patterns earlier this year and all three hit closing 52-week highs on Monday.
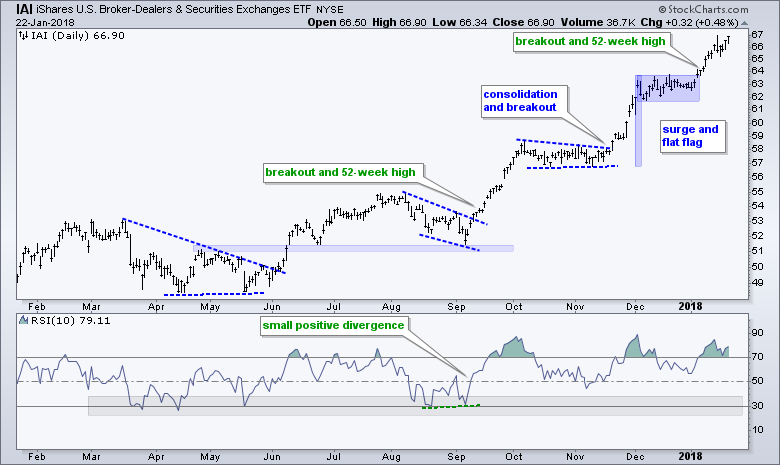
These three are interesting because they come from the same sector and they sport three different corrective patterns. IAI formed a flat flag and broke out on January 4th. KRE formed a triangle and broke out on January 9th. KIE formed a falling flag and broke out on January 9th.
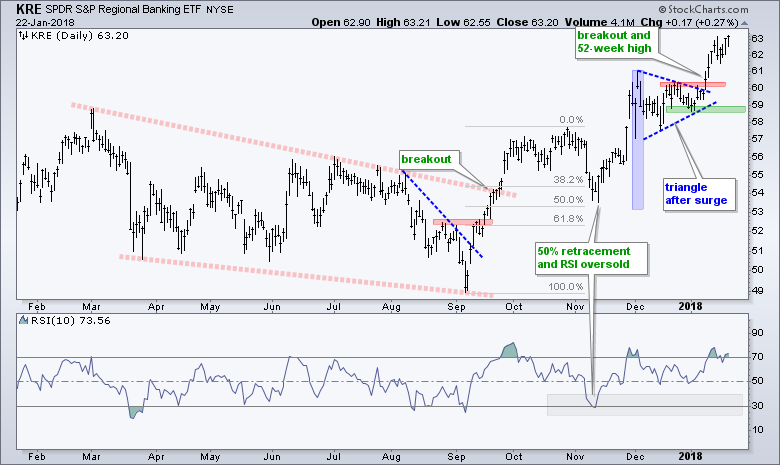
A corrective pattern represents a pause or pullback within the bigger trend. These three patterns were short-term consolidations that represented a rest within the uptrend. The breakouts ended the corrections and signaled a continuation of the uptrends.
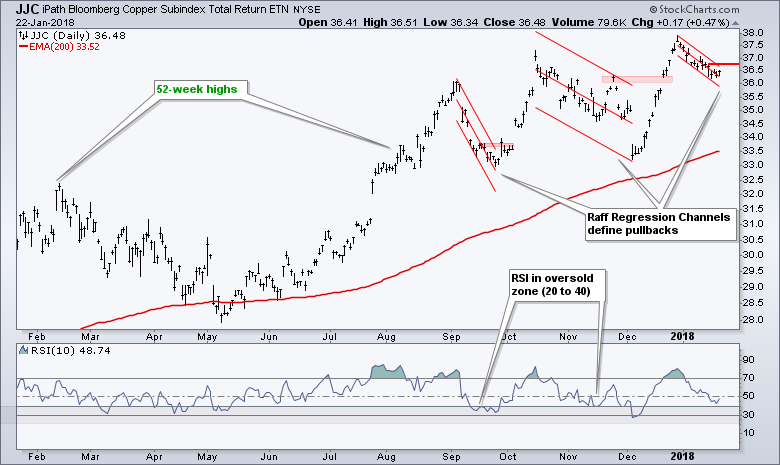
Copper ETN Pulls Back within Trend
The Copper ETN (JJC), the Aluminum ETN (JJU) and the Base Metals ETF (DBB) hit new highs at the end of 2018 and are in long-term uptrends. Note that DBB is divided into three equal parts: aluminum, copper and zinc.
Commodities (sans agriculture) have been on a tear the last six weeks with double digit gains in Palladium, Platinum, Oil and Natural Gas. The PerfChart below shows the six week Rate-of-Change for ten commodities. Gold and silver are underperforming the leaders, while soybeans and corn are actually down.
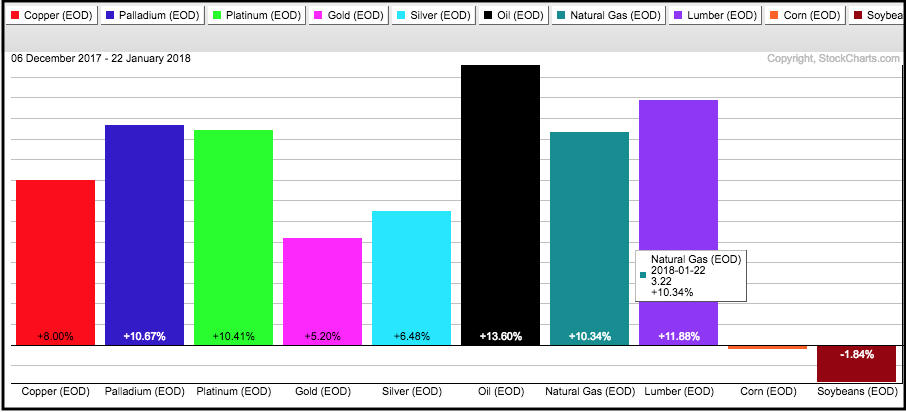
With industrial metals taking the lead, I am on the look out for bullish setups in the commodity related ETFs. JJC, in particular, hit a new high on 28-Dec and pulled back the last few weeks with a falling flag. I am using a Raff Regression Channel to define this pullback and a breakout at 36.8 would signal a continuation higher.
Is Telecom Turning the Corner?
Bottom picking is tricky business, especially in the stock market because the leaders tend to keep on leading. The Telecom iShares (IYZ) is certainly not a leading industry and the long-term trend is still down.
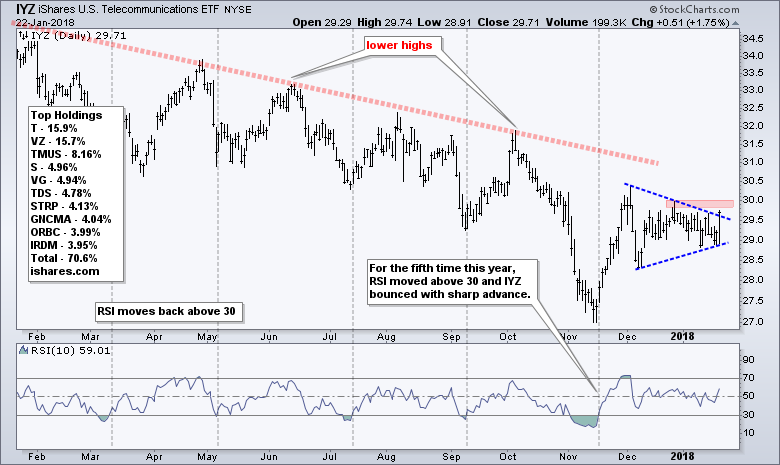
There are, however, some early signs of strength appearing as the ETF surged and then corrected with a triangle. This triangle represents a rest after the surge and an upside breakout at 30 would be bullish. IYZ surged 1.75% on Monday so a breakout could be in the making.
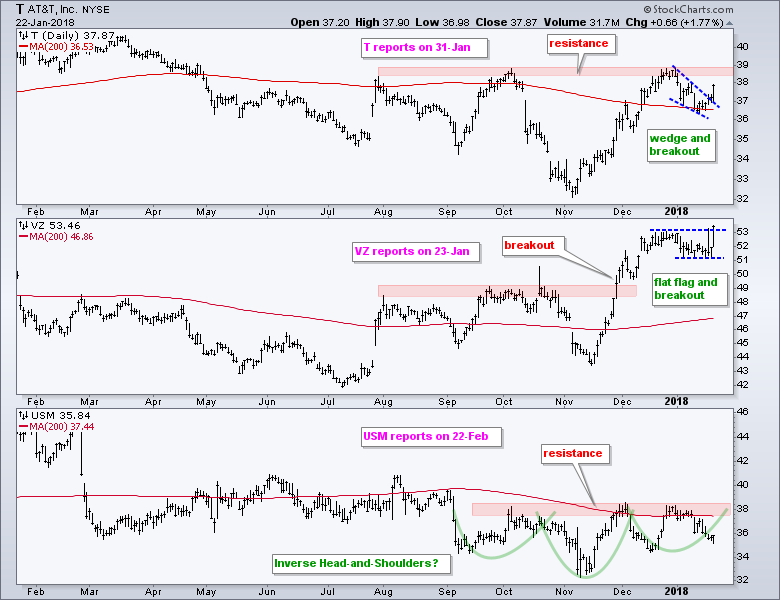
The next chart shows the top three component stocks: T, VZ and USM. AT&T (T) reports earnings next week and has a falling wedge breakout in play. Verizon (VZ) reports today and just broke out of a flag consolidation. US Cellular (USM) reports on 22-Feb and has an inverse head-and-shoulders working.
Plan Your Trade and Trade Your Plan.
- Arthur Hill, CMT
Senior Technical Analyst, StockCharts.com
Book: Define the Trend and Trade the Trend
Twitter: Follow @ArthurHill


