- Pow, Straight to the Moon!
- Group Leaders and Laggards.
- Strategy Going Forward.
- Fresh Highs for SPY and QQQ.
- A Tough Week for Small-Caps.
- Eight of Ten Sector SPDRs Hit New Highs.
- XLU and IYR Drop out of Oversold Watch.
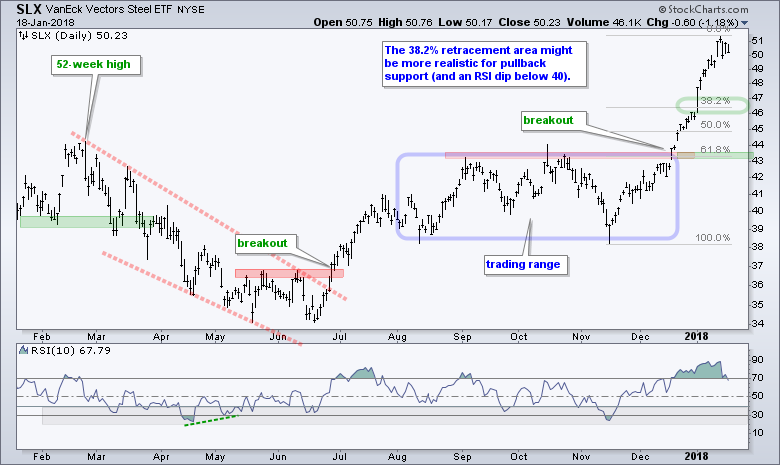
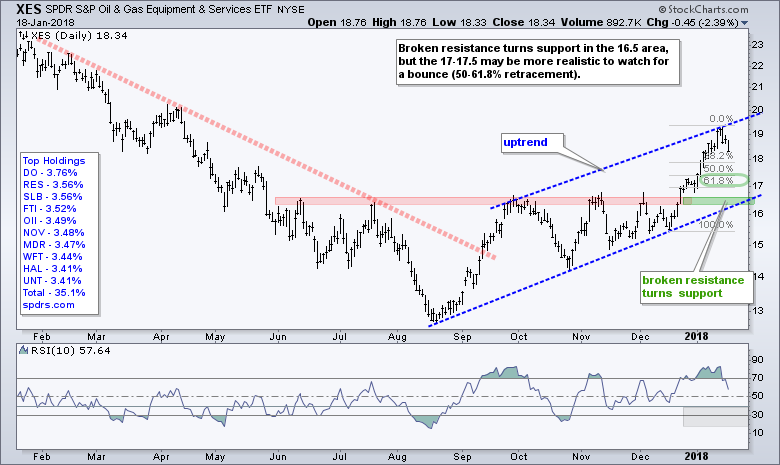
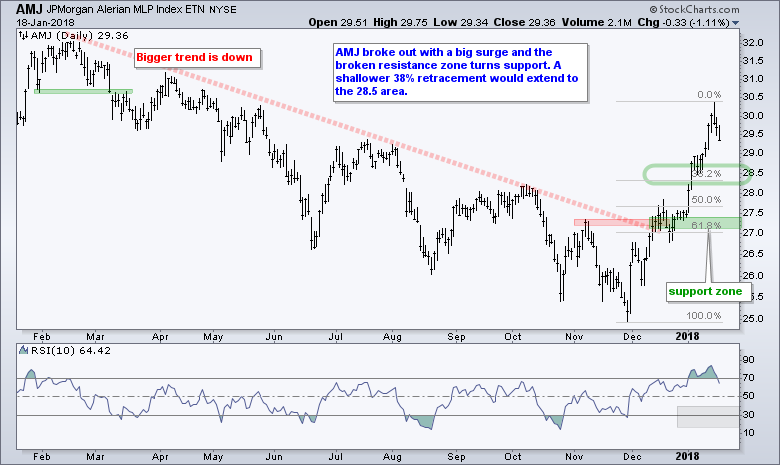
- Pullbacks Zones to Watch (XME,SLX,COPX,XES, AMJ).
- Money Continues to Move out of Safe-haven Bonds.
- Watching the Raff Channel in Gold.
- Notes from the Art's Charts ChartList.
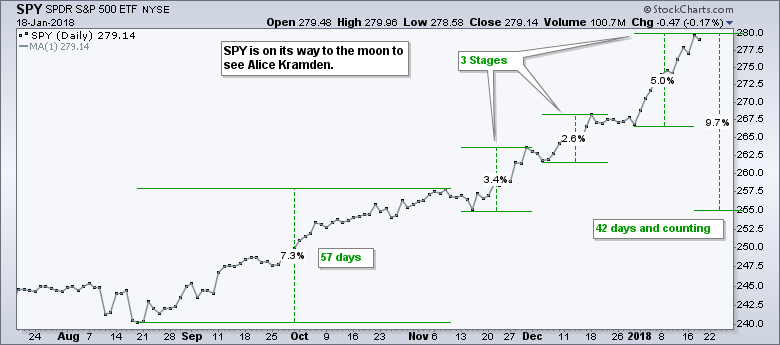
Pow, Straight to the Moon!
tocks are in the middle of a moonshot with three short-term stages visible on the SPY chart. The first began in mid November, the second in early December and the third on January 2nd. After a mild correction in early November, SPY took off with a 9+ percent advance over the last 42 days (and counting). Notice that this advance is even sharper than the move from mid August to early November (7.3% in 57 days).
Group Leaders and Laggards
Participation in this advance is broad with almost all industry group ETFs moving higher (sans utilities and REITs). Overall, I count at least 16 industry group ETFs that are up 10% or more the last nine weeks. The Metals & Mining SPDR (XME) and the Retail SPDR (XRT) are leading this charge with gains of 25 and 20 percent, respectively.
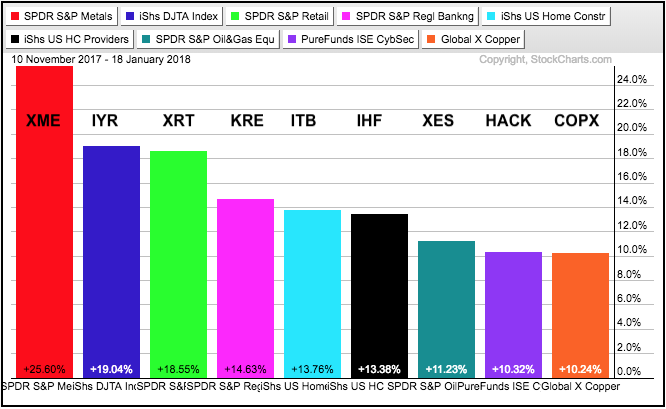
The PerfChart above shows the industry group leaders, as measured by Rate-of-Change, over the last nine weeks. In contrast, the PerfChart below shows the industry group laggards because they are only up between five and ten percent. Overall, another 27 industry group ETFs are up between five and ten percent, which ain't shabby either.
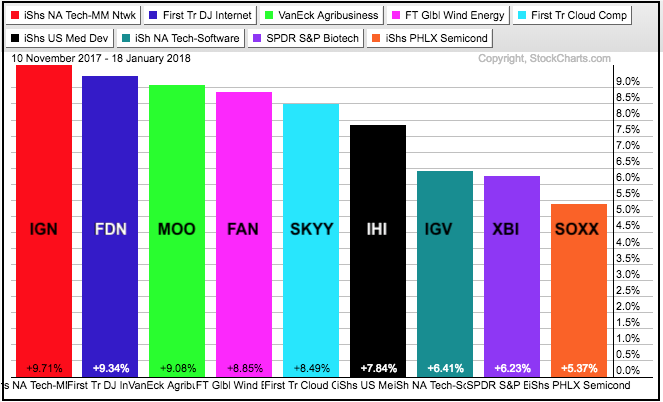
Despite paltry five to ten percent gains, all nine of these ETFs in the PerfChart above hit new highs this week. Thus, they are all in long-term uptrends and clearly participating.
Notice that the Biotech SPDR (XBI) and the Semiconductor iShares (SOXX) show the smallest gains. These two were leaders in 2017 with the biggest gains (40-43%). I am not concerned that XBI and SOXX are up less because this does not detract from their trends, which are clearly up and clearly strong.
Strategy Going Forward
The consensus is that the market is extended and ripe for a correction, but the market rarely takes the consensus path. Trend followers and momentum players remain active because they buy new highs and chase the biggest movers.
Correction players, such as myself, are waiting for pullbacks or consolidations and identifying key levels to watch. The last correction opportunities were very short and they occurred in mid November, early December and late December. See Thursday's System Trader article for an idea. Yes, a little patience is required.
Today, I am going to highlight some techniques to identify potential reversal levels on a pullback, should we get one. I will focus on the Metals & Mining SPDR (XME), Oil & Gas Equip & Services SPDR (XES), Steel ETF (SLX), Copper Miners ETF (COPX) and Alerian MLP ETF (AMJ).
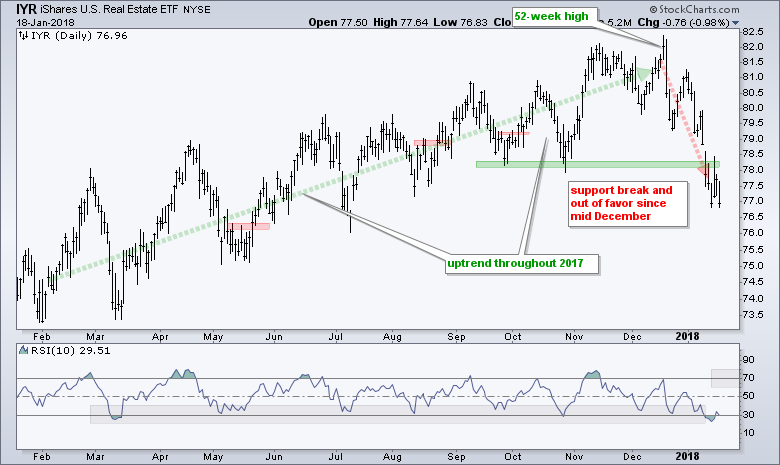
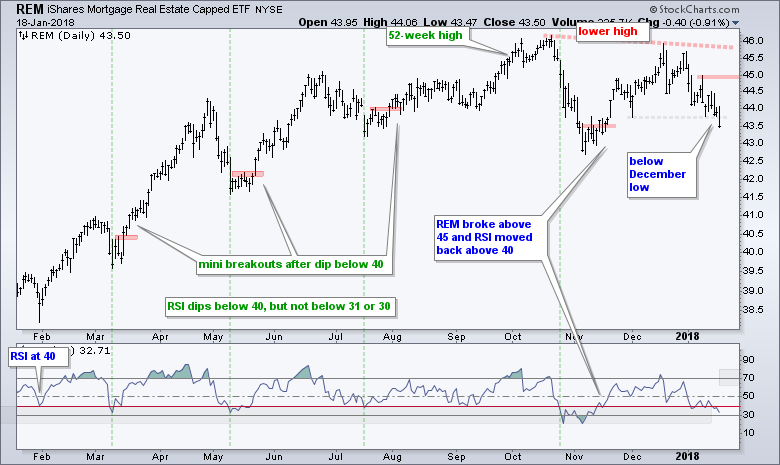
I will also focus on three ETFs that are no longer on the "watch for correction list". These are the Utilities SPDR (XLU), the REIT iShares (IYR) and the Mortgage REIT ETF (REM).
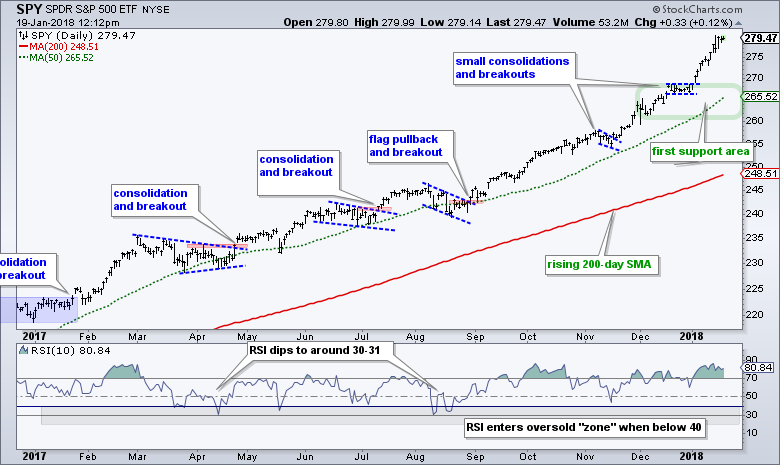
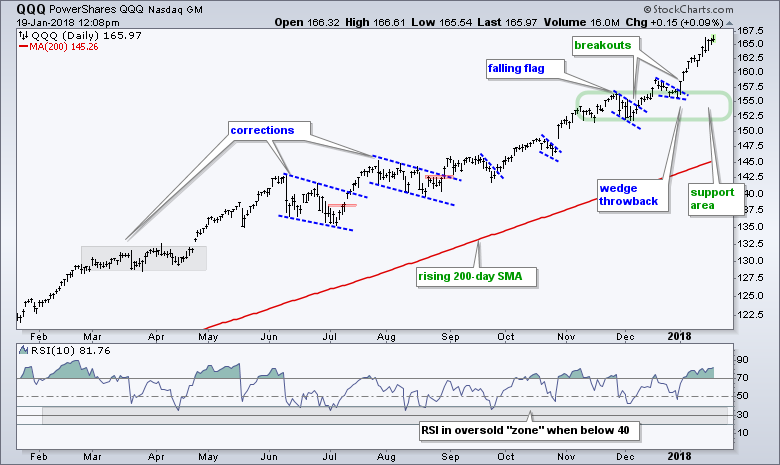
Fresh Highs for SPY and QQQ
The S&P 500 SPDR (SPY) recorded a closing high on Monday, an intraday high with the surge on Tuesday and another closing high on Wednesday. So much for Tuesday's intraday reversal. There is really not much we can do on the analysis front because SPY is near a new high, in a strong uptrend and in uncharted territory. Ditto for QQQ, which hit a new closing high on Thursday. The green ovals mark support zones to watch if/when we get a pullback.
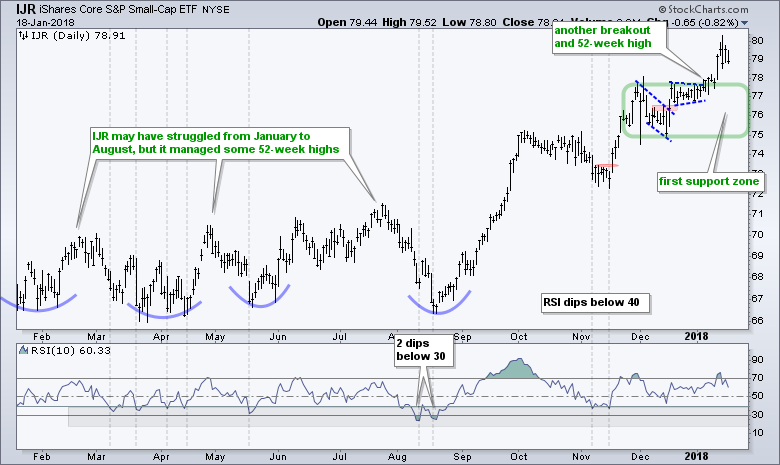
A Tough Week for Small-Caps
Small-caps are struggling a bit, but what else is new. As noted last week, small-caps go through bouts of outperformance and bouts of underperformance. The S&P SmallCap iShares (IJR) closed at a new high on Monday, and then fell back on Tuesday and Thursday. This is just a little short-term noise and not enough to affect even the short-term trend, which is up after the pennant breakout in early January. While a close below 77 would negate this breakout, I would not get too bearish because pullbacks will present opportunities and the green zone marks a big support area.
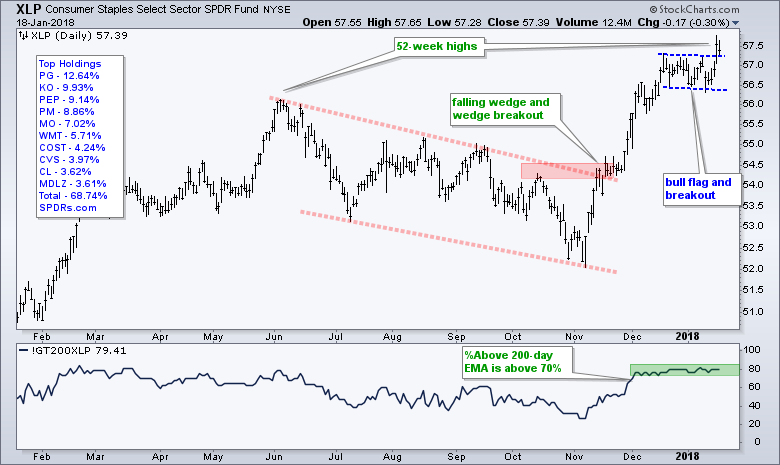
Eight of Ten Sector SPDRs Hit New Highs
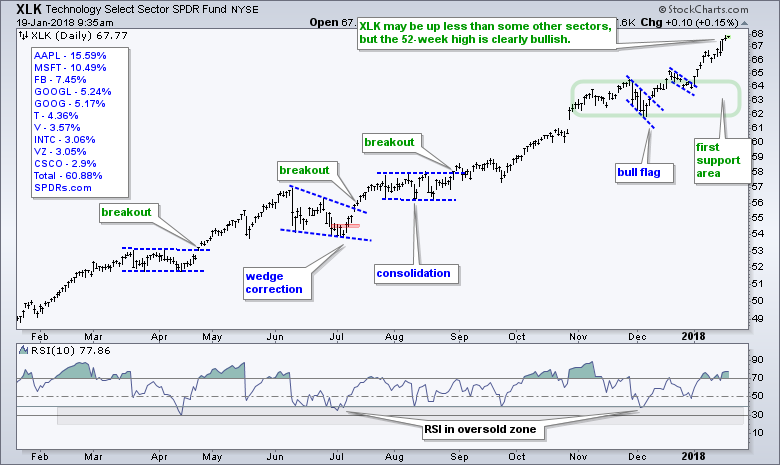
The Utilities SPDR and the Real Estate SPDR are the two lagging sectors, and they account for just 5.3% of SPY. Hardly a big drag on the broader market. More importantly, the other eight sector SPDRs hit new highs this week and are in clear uptrends. The Consumer Staples SPDR (XLP) joined the party with a flag breakout over the last few days. In addition, note that seven of the eight leaders are up more than 10% from their November lows. The Technology SPDR (XLK) is the only one up less than 10%, but it recorded a 52-week high on Thursday and is clearly not slacking on the price chart.
XLU and IYR Drop out of Oversold Watch
My basic strategy is to look for short-term oversold conditions when the long-term trend is up. The long-term trends turned down for the Utilities SPDR (XLU) and REIT iShares (IYR) so I am no longer looking for short-term oversold conditions in these two. I am not looking for short-term overbought conditions either. It is a personal choice, but I am not interested in bearish setups during a bull market.
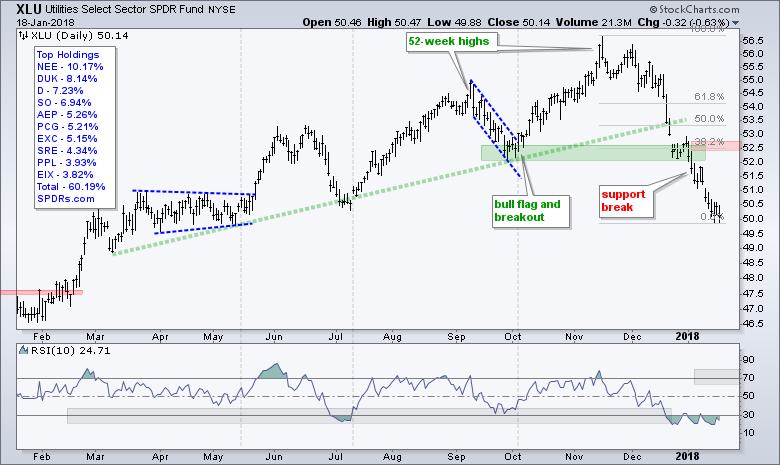
Technically, however, we can reverse the logic and look for RSI to move into the 60-80 zone for short-term overbought conditions in a downtrend. Broken support also turns into a resistance zone. Adding the 38% retracement, I would expect an oversold bounce to fizzle in the 52.5 area. The next chart shows IYR breaking below its September-October lows.
I am also removing the Mortgage REIT ETF (REM) from my oversold watch because it formed a lower high in December and fell sharply this year. REM is clearly out of favor.
Pullbacks Zones to Watch (XME,SLX,COPX,XES, AMJ)
The Metals & Mining SPDR (XME), Steel ETF (SLX) and the Copper Miners ETF (COPX) are in the midst of major breakouts with big surges the last nine weeks. These three also recorded 52-week highs and are in long-term uptrends. Chasing at this stage does not look like a good idea so I have these on my oversold watchlist.
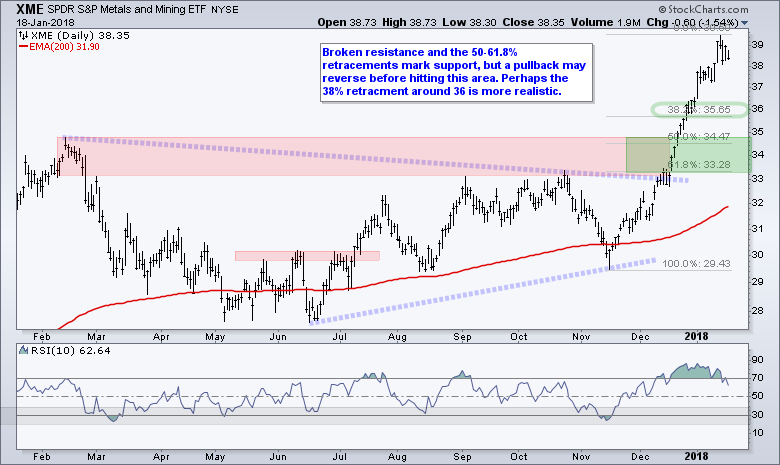
There are three things chartists can use to identify pullback areas that may produce a reversal. First, the Fibonacci Retracements Tool can be used to measure retracements based on the prior advance. Second, chartists can look at broken resistance levels because they sometimes turn into support on a pullback. Third, chartists can use RSI and look for a dip to the low 30s.
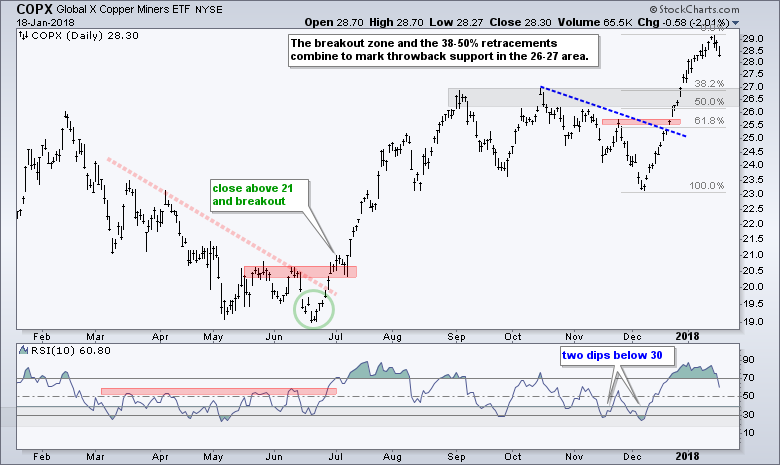
Keep in mind that technical analysis is part science and part art, the other art. In other words, I am making educated guesses on the reversal areas. Given the strength of the overall market, I suspect that these pullbacks will be on the shorter side. This means a retracement may extend to the 38.2% level instead of the 61.8% level.
The charts above show these techniques in action and the first levels to watch should we get a pullback. The next chart shows the Oil & Gas Equip & Services SPDR, which is a little different because it has yet to record a 52-week high. The ETF surged 25% in four weeks and is ripe for a pullback. The 50-61.8% retracement zone marks my first area to watch (17-17.5).
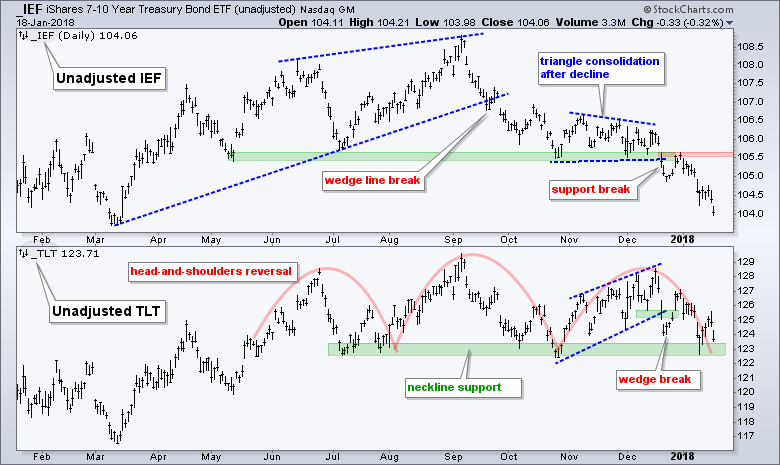
Money Continues to Move out of Safe-haven Bonds
The 7-10 YR T-Bond ETF (IEF) fell sharply the last two days and recorded a nine month low in the process. The 20+ YR T-Bond ETF (TLT) remains above neckline support, but I expect TLT to follow IEF and break down at some point. A break down would confirm the head-and-shoulders pattern taking shape and target a move to the March low. Money is clearly moving out of safe-haven bonds and this money could find its way into riskier assets, such as stocks.
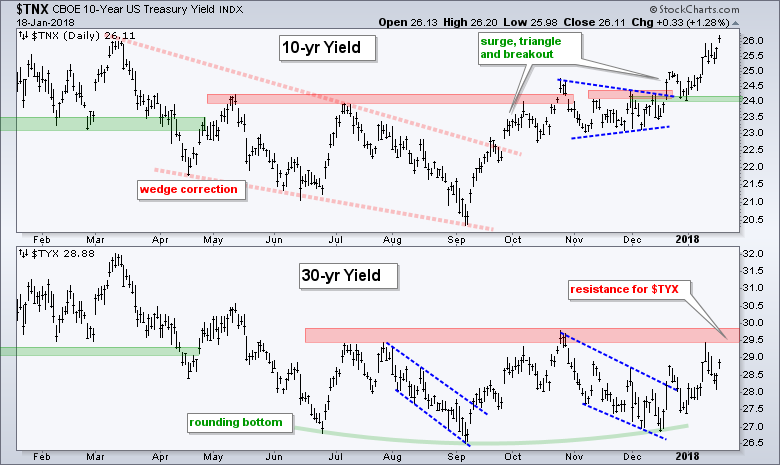
The next chart shows the 10-yr T-Yield ($TNX) nearing its March high after a move from 24 to 26 (2.4% to 2.61%). The 30-yr T-Yield ($TYX) sports a rounding bottom and a breakout at 29.5-30 (2.95-3%) would call for higher long-term yields. Such a move could be positive for the Dollar and negative for gold.
Watching the Raff Channel in Gold
The next chart shows the Gold SPDR (GLD) breaking out of a wedge with a sharp surge in December. One can make the case for a long-term uptrend with the 52-week high in early September, the higher low in December and the wedge breakout in late December.
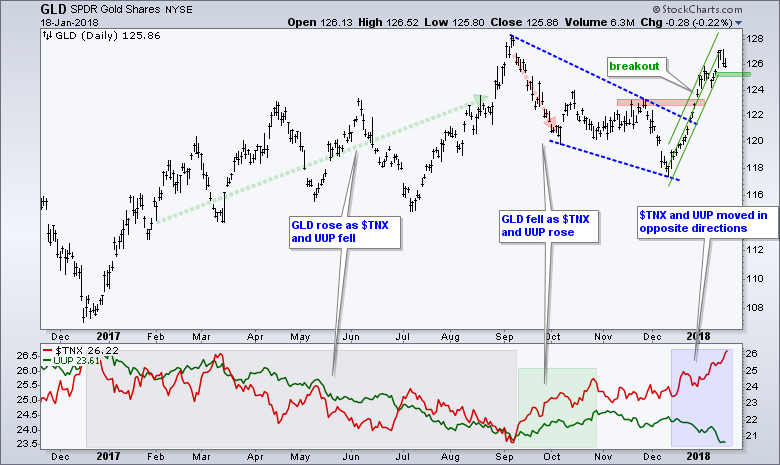
GLD is prone to sudden reversals and I would be concerned with rising yields, which are usually negative for gold. The green lines mark a Raff Regression Channel with support at 125. A close below this level would reverse the four week upswing.
Notes from the Art's Charts ChartList
- The Cloud Computing ETF (SKYY), Cyber Security ETF (HACK), Internet ETF (FDN), Networking iShares (IGN) and Software iShares (IGV) hit new highs again this week.
- The Semiconductor iShares (SOXX) and Semiconductor SPDR (XSD) rejoined the tech rally with 52-week highs this week.
- The Insurance SPDR (KIE) is struggling this week, but the flag breakout is holding.
- The Mortgage REIT ETF (REM) remains weak overall and moved below its December low. REITs are out of favor overall.
- The Regional Bank SPDR (KRE) also struggled this week, but hit a new high on Tuesday and the triangle/pennant breakout remains in play.
- Broken resistance turns support in the 16.5 area for the Oil & Gas Equip & Services SPDR (XES), but the 17-17.5 area may be more realistic to watch for a bounce (50-61.8% retracement).
- The Alerian MLP ETF (AMJ) broke out with a big surge and the broken resistance zone turns first support (watch this area on a pullback).
- The breakout zone and the 38-50% retracements combine to mark throwback support in the 26-27 area for the Copper Miners ETF (COPX).
- The Metals & Mining SPDR (XME) and Steel ETF (SLX) surged some 30% and are ripe for a pullback. I am watching the 38% retracement are and RSI for a dip below 40.
- The long-term trend is clearly down, but the Telecom iShares (IYZ) is forming a triangle and a breakout at 30 would be bullish.
Plan Your Trade and Trade Your Plan.
- Arthur Hill, CMT
Senior Technical Analyst, StockCharts.com
Book: Define the Trend and Trade the Trend
Twitter: Follow @ArthurHill
