- Cyber Security ETF Surges to New High.
- Two Cyber Security Stocks to Watch.
- Finisar Bounces off Key Retracement.
- Win Some and Lose Some (AYI, BLL).
Cyber Security ETF Surges to New High
The Cyber Security ETF (HACK) lagged the broader market from June to mid November, but caught fire and broke out to new highs. Overall, the big pattern at work is an inverse head-and-shoulders of the continuation variety. This means it is just a big consolidation after an advance. The neckline breakout ended the consolidation and signaled a resumption of the overall uptrend.
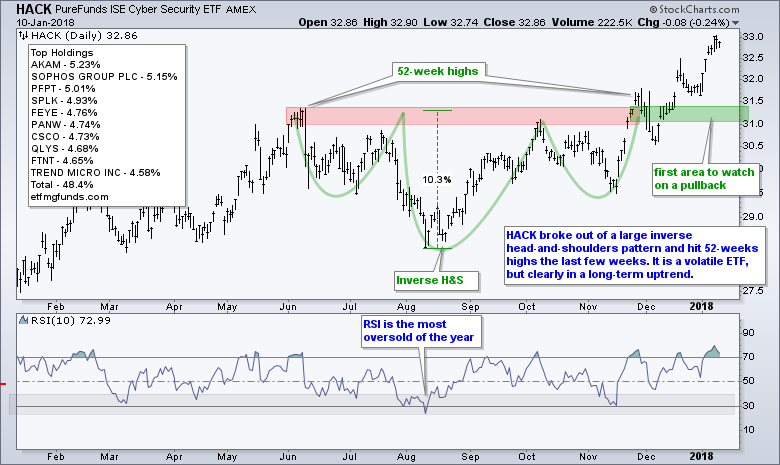
The height of the pattern is around 10% and this can be applied to the breakout zone for a rough target. I am not a big fan of these measured price targets, but they give you a rough idea of the possibilities. A 10% advance from the breakout zone would target a move to the 34-35 area. The main takeaway from this chart is the cyber-security industry is strong and I am looking at stocks within this group for bullish setups. Here is a list of the top ten stocks (US): AKAM, PFPT, SPLK, FEYE, PANW, CSCO, QLYS, FTNT, SYMC, IMPV
Two Cyber Security Stocks to Watch
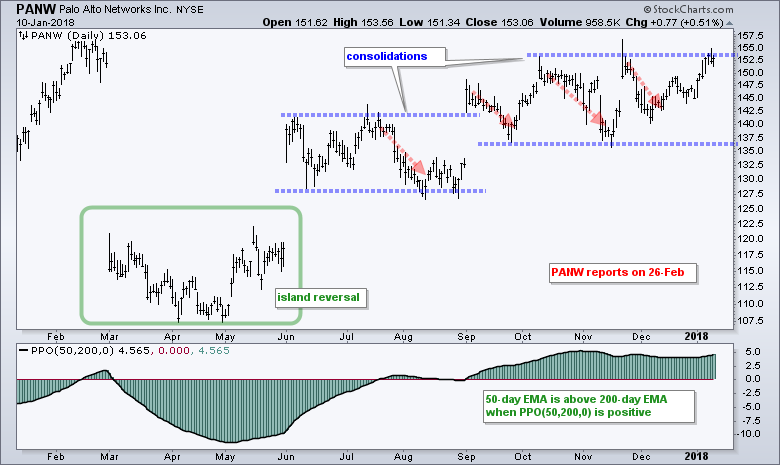
Palo Alto Networks (PANW) is on the verge of hitting a fresh 52-week high. The stock forged an island reversal from February to June, consolidated, broke out with a gap and consolidated again. The red arrow-lines show the pullbacks within the uptrend since July. It would be nice to see another pullback, but I am not sure if it will happen. The trend since May looks pretty strong and a move above 158 would forge a 52-week high.
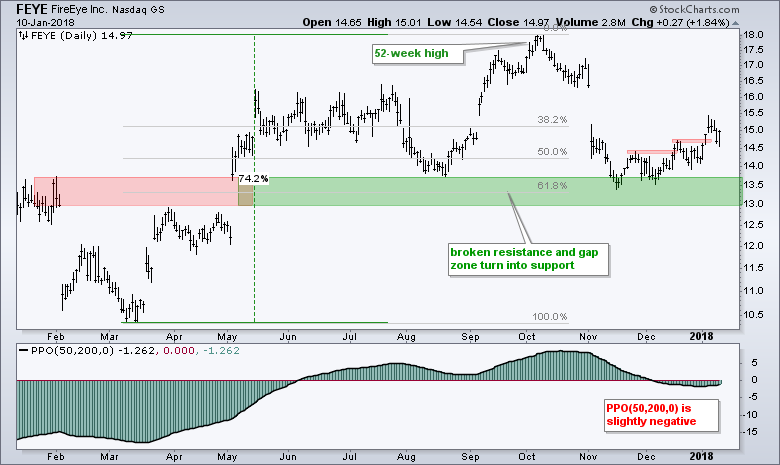
FireEye (FEYE) is one of the more volatile and riskier plays with a 75% advance from March to October and a 25% decline into mid November. Despite this double-digit decline, the stock retraced around 61.8% of the prior advance and returned to broken resistance, which turned into support. FEYE firmed from mid November to early December and then started working its way higher the last five weeks. The bigger trend may still be up and it may be resuming with this recent bounce. A close below 14 would argue for a re-evaluation of this bullish thesis.
Finisar Bounces off Key Retracement
I highlighted three stocks (FNSR, LITE, IIVI) involved in VSCELs in Art's Charts in mid December and would like to follow up on FNSR now that the dust has settled a little.
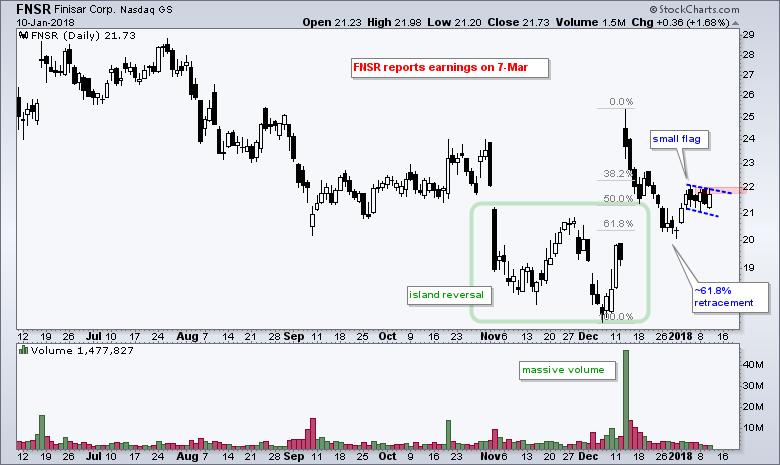
I do not usually feature stocks in long-term downtrends, but Finisar (FNSR) caught my eye with the island reversal and high volume surge on December 13th. The stock jumped because Apple made an investment to insure supply of VSCELs, vertical-cavity surface-emitting lasers.
Narratives are always nice for justification, but the chart is what really counts. I like the price action because FNSR retraced around 61.8% of the December surge and then bounced with a gap on January 2nd. The stock then formed a small bull flag the last five days and a break above 22 would be bullish.
Win Some and Lose Some (AYI)
I featured Acuity Brands (AYI), Vulcan Materials (VMC) and Martin Marietta (MLM) on January 2nd because these three stocks were laggards in strong sectors. It looked as if they were basing and could make a run in 2018. Year-to-date, VMC and MLM are up 2.5-3%, but AYI is down around 10%. It would be nice to ignore the bad calls, but losing trades are all part of the process and we must deal with them sooner or later.
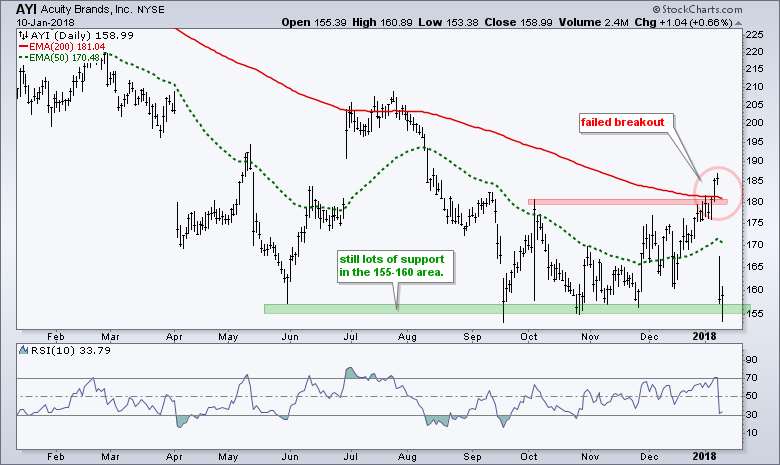
AYI appeared to break out with good volume on January 5th with a move above the October high and the 200-day EMA. This breakout failed as the stock gapped down on Tuesday after an earnings/sales miss. There are two takeaways here. First, I wrote about AYI on January 2nd and they reported earnings on January 9th. There is always a risk when taking positions ahead of earnings. Second, diversification and position sizing are important. A diversified portfolio with relatively small positions (5% or less) would have lessened the blow.
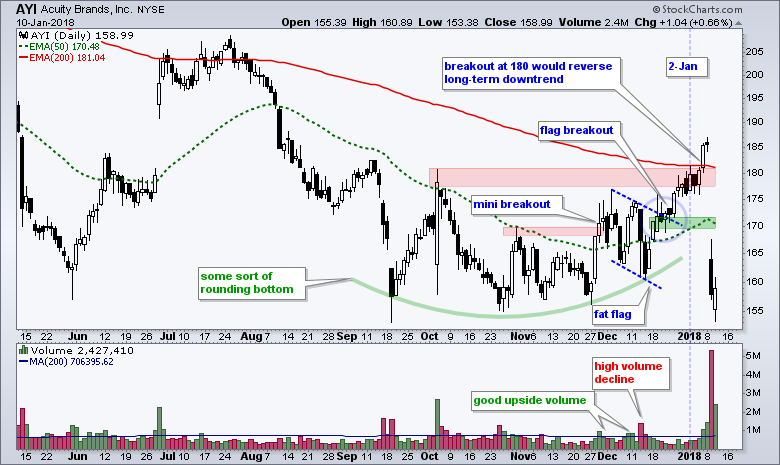
So now what? I cannot make the case for a long-term uptrend after the failed breakout. The 50-day EMA is still below the 200-day EMA, and the 200-day EMA is sloping down. More importantly, my bullish thesis for the stock was clearly proven wrong with the gap down. There is, however, always a silver lining if you look hard enough. The stock seems to have support in the 155-160 area so there are two options. First, chartists could hold out for a successful support test and set a stop on a close below 155. Second, chartists could simply sell and move on to the next setup. The first option seems hopeful, while the second seems realistic.
The next chart shows another failed pick, Ball Corp (BLL). This stock was featured on December 4th as it surged off support and broke back above the 50-day EMA. This breakout did not hold as the stock gapped down a few days later. The stock went on to break double top support and this support break turned into resistance this week.
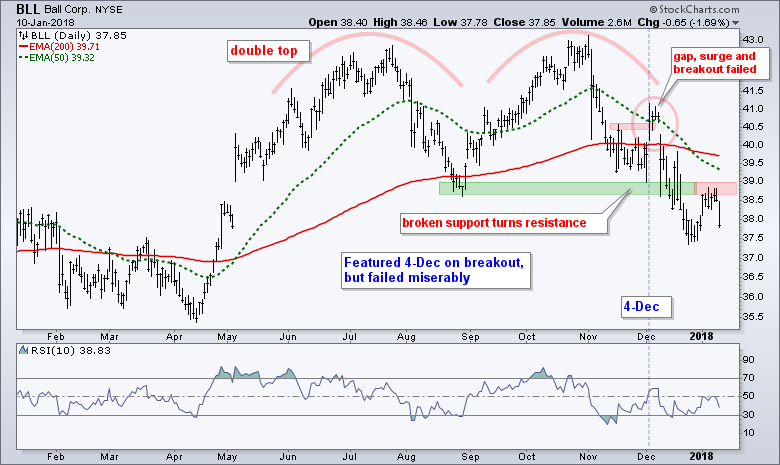
The first exit is often the best exit. BLL clearly failed with the gap down and the initial reason for the trade was proven wrong at this stage. Hopeful chartists could have held out for support in the 38.7-39 area, but this level also failed to hold. The support break was then tested with a throwback bounce and held with Wednesday's downturn.
We must continually study the chart after taking a position and re-evaluate to see if our initial thesis holds water. There are three possible exits: when the initial thesis is proven wrong, when the profit target is reached or when the stop-loss is triggered. Holding a position when proven wrong expends valuable mental energy and ties up capital that could be better used in a new position. It is hard, but we must be able to admit defeat, learn from the post-mortem and move on to the next trade. And last, but not least, plan your trade before entering and trade according to your plan after entering.
ETF Master ChartPack - 300+ ETFs organized in a Master ChartList and in individual groups.
Follow me on Twitter @arthurhill - Keep up with my 140 character commentaries.
Thanks for tuning in and have a good day!
--Arthur Hill CMT
Plan your Trade and Trade your Plan


