- A Change in Market Regime.
- Be Careful with the Price Relative.
- Small-caps are Just Getting Started.
- Animal Spirits Find IJR.
- SPY "Overbought" Period Hits Day 70.
- Seven of Ten Sector SPDRs Hit New Highs.
- Two Small-cap Sectors to Watch.
- 7-10 YR T-Bond ETF Extends Breakdown.
- Gold Stalls after Breakout.
- Oil Extends Uptrend.
- Notes from Art's Charts ChartList.
Art's Charts ChartList - Updated 12-Jan-18 (click here)
A Change in Market Regime
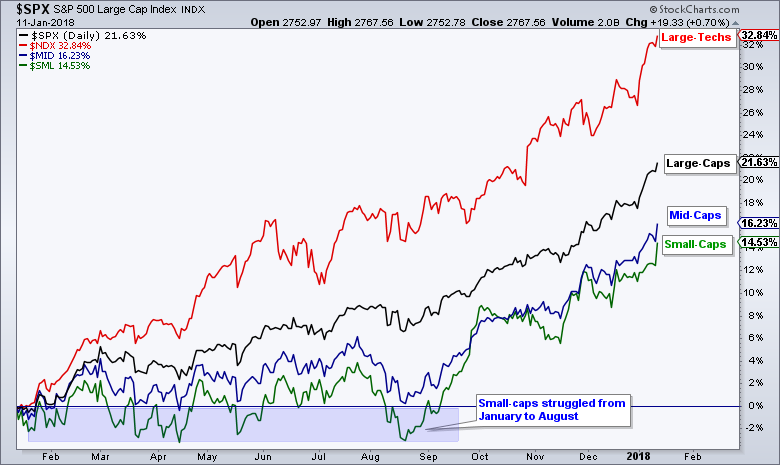
As the chart below shows, the S&P 500 and large-caps have been on a tear the past year with the S&P 500 (black) outperforming the S&P Mid-Cap 400 (blue) and the S&P Small-Cap 600 (green). The Nasdaq 100 (red) is blowing away these three with a 30+ percent gain over the past year. Small-caps and mid-caps, however, are not performing badly because they are up 14.53% and 16.23%, respectively. They are simply underperforming large-caps over the past year.
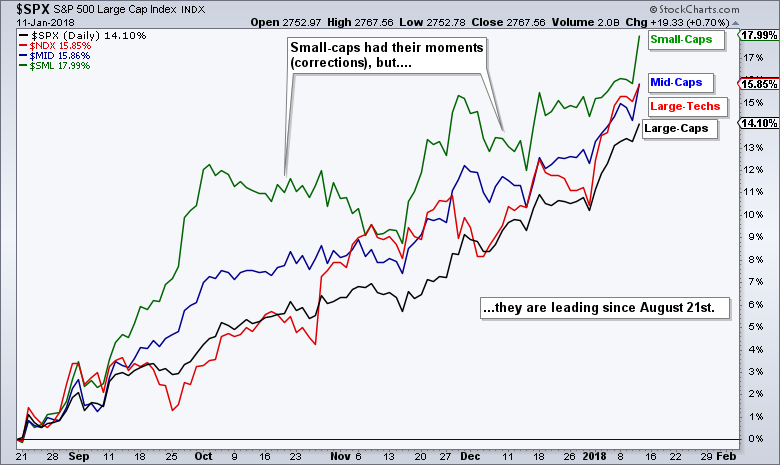
This picture changes when we look at performance since August 21st. I picked this date because it marked a major low in the stock market and a regime shift in the performance metrics. Notice that the S&P Small-Cap 600 is outperforming with an 18% gain, which is 2 percentage point higher than the nearest two (S&P Mid-Cap 400 and Nasdaq 100). The S&P 500 is up 14%, but this is much less than the S&P Small-Cap 600. Thus, I think the nature of the market changed in August and this change could extend further into 2018.
Be Careful with the Price Relative
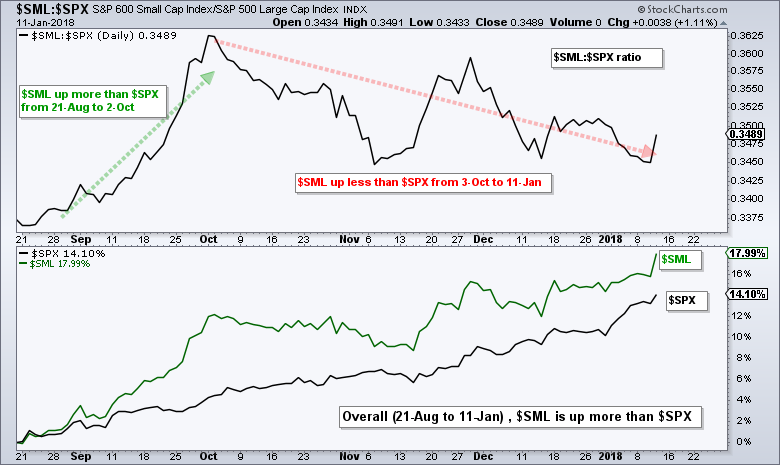
Many of us use the price relative (ratio chart) to compare performance, but it does not always capture the entire picture. The chart below shows the price relative ($SML:$SPX) in the top window and the individual performance lines in the lower window. Even though $SML is up 18% and clearly outperforming $SPX, the price relative has been declining since October. This is because $SML was up much more than $SPX from August to October and up less than $SPX from October to January.
As the price relative shows, the S&P Small-Cap 600 seems to swing from outperforming to underperforming and back to outperforming. In addition, the S&P Small-Cap 600 is more volatile than the S&P 500 because small-caps have higher betas. Thus, we can expect small-caps to go through periods of underperformance, even during a bigger period of outperformance. With the recent breakout in the S&P SmallCap iShares (IJR), small-caps may be about to embark on another period of outperformance.
Small-caps are Just Getting Started
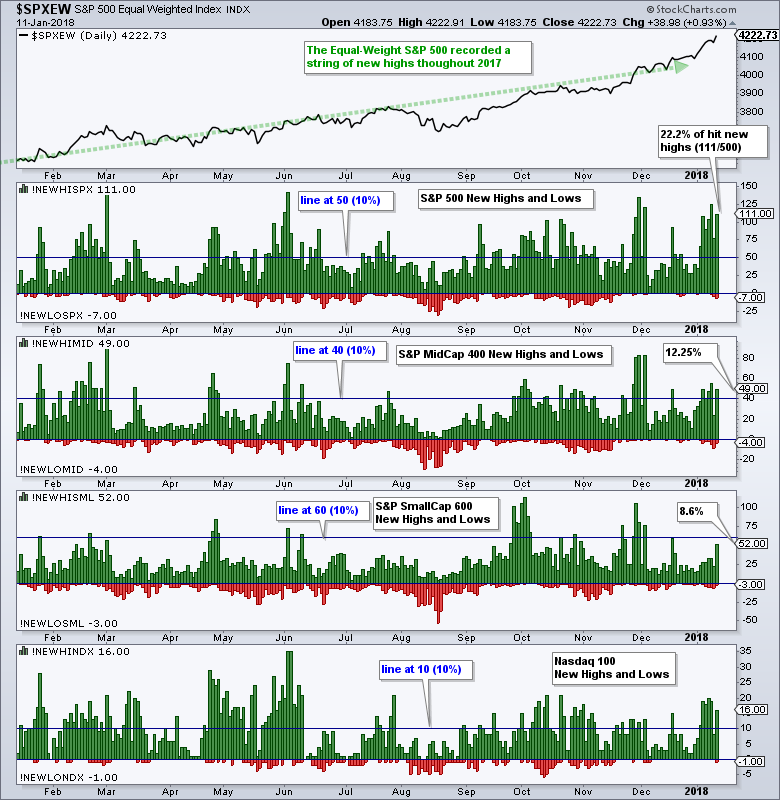
The S&P 500 and Nasdaq 100 have been producing stocks with new highs on a consistent basis since November 2017, but the S&P Small-Cap 600 and S&P Mid-Cap 400 have been lagging in this category. The S&P 500 is still leading the charge with new highs exceeding 100 (20% on index) four of the last six days. The S&P Mid-Cap 400 and the S&P Small-Cap 600, on the other hand have been less consistent. Mid-caps have not cracked the 15% threshold (>60 new highs) since early December and small-caps have not cracked the 10% threshold (>60 new highs). I would expect this to change if animal spirits are on the horizon this year. In other words, if small-caps and mid-caps continue to lead, I would expect new highs to expand and this is where the new leadership might be found.
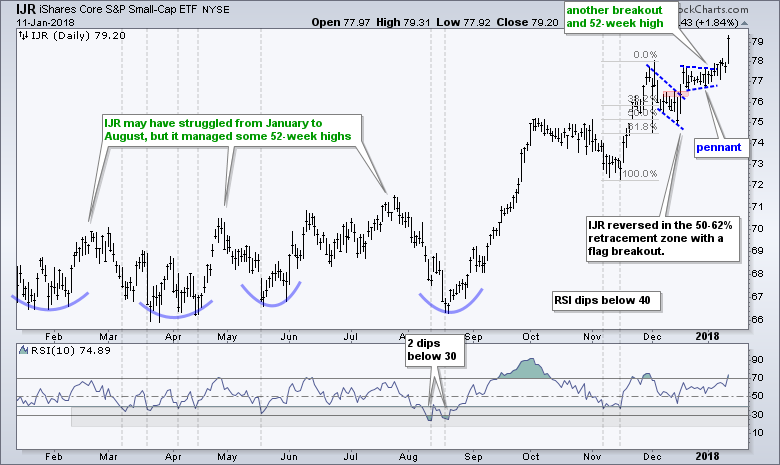
Animal Spirits Find IJR
I noted the pennant in IJR in the weekly report on Friday and featured the breakout in Art’s Charts on Tuesday. Small-caps caught some animal spirits on Thursday with the biggest 1-day advance since September 27th. The rest period (pennant) has clearly ended and the bigger uptrend is resuming.
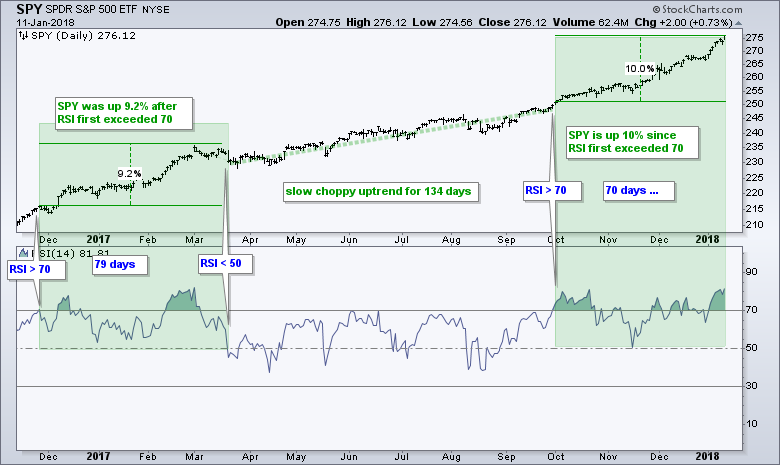
SPY "Overbought" Period Hits Day 70
I will stick with this SPY chart and RSI(14) because they illustrate some important points that we need to keep in mind when analyzing charts. Note that this chart first pointed featured in the weekly report on December 15th, about a month ago. First, RSI can become overbought (>70) and remain near 70 for extended periods. Second, multiple overbought readings are typical in strong uptrends. Third, overbought is a deceptive term because it implies an impending pullback. While there will be a pullback at some point, overbought is not useful for timing such a pullback (and neither are negative divergences). I would suggest that a pullback could start when and if RSI dips below 50. Since first moving above 70 on October 2nd, SPY is up another 10% and RSI has not dipped below 50 (70 days and counting).
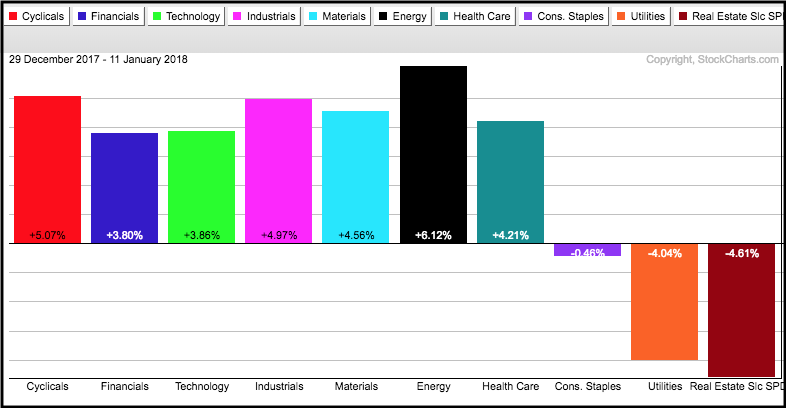
Seven of Ten Sector SPDRs Hit New Highs
With the exception of utilities and REITs, the sector SPDRs and the equal-weight sectors are off to the races and within strong uptrends. XLY, XLK, XLI, XLF, XLB, XLV and XLE hit new highs and all seven are up sharply since mid August. The Real Estate SPDR (XLRE) and the Utilities SPDR (XLU) are the only two sectors trading below their 200-day SMAs. The Consumer Staples SPDR (XLP) remains near a 52-week high, but stalled out over the last few weeks as money moved into the offensive side of the stock market. In fact, the sector PerfChart below sums up 2018 quite well: RISK ON. The defensive consumer staples sector is down slightly and seriously underperforming, while interest rate sensitive utilities and REITs are out of favor.
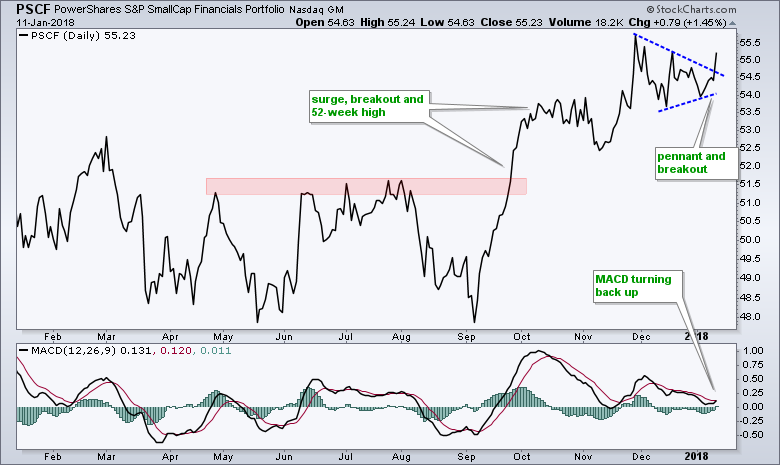
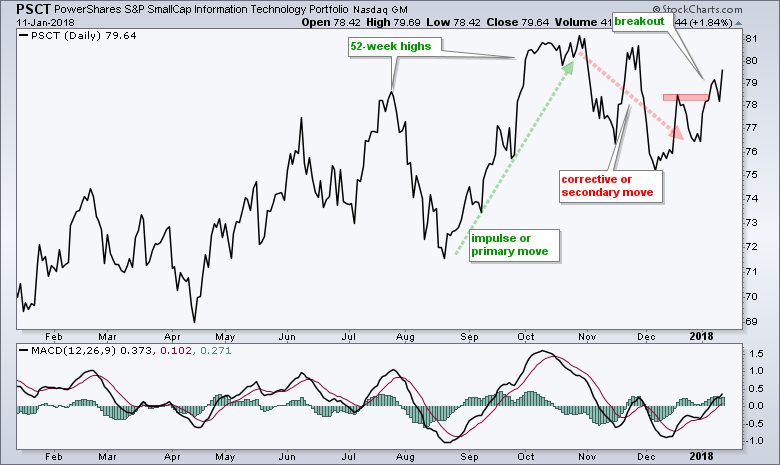
Two Small-cap Sectors to Watch
I realize that the small-caps sector ETFs have thin volume and may not be suited for trading, but they can still be analyzed to find strengthening areas of the market. We can also use these to see if the rally in small-caps is broadening and if we can expect more new highs. According to iShares.com, the top sectors in IJR are industrials (19.27%), finance (16.11%), consumer discretionary (15.34%), technology (14.16%) and healthcare (13.77%). These five represent an astounding 78.65% of IJR. The SmallCap Financials ETF (PSCF) and the SmallCap Technology ETF (PSCT) are lagging somewhat, but may be poised to play a little catchup as they break out of corrective patterns.
7-10 YR T-Bond ETF Extends Breakdown
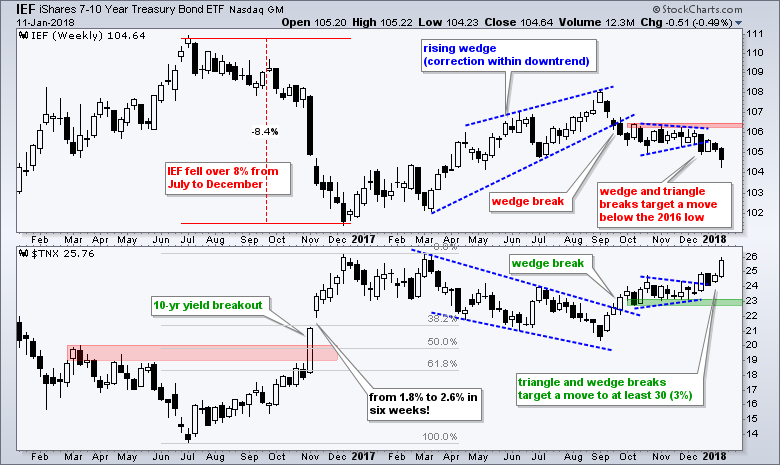
The weekly chart for IEF shows a sharp decline (8.4%), a rising wedge corrective advance and a wedge break in August. The ETF then formed a triangle and broke triangle support four week's ago. Using the measured move technique, we can estimate a similar decline (8.4%) from the wedge high, and this would target a move to around 99. Applying similar logic to the 10-yr T-Yield ($TNX), we can expect a move to the 3% area in 2018. Such a move would likely further weigh on utilities and REITs.
Gold Stalls after Breakout
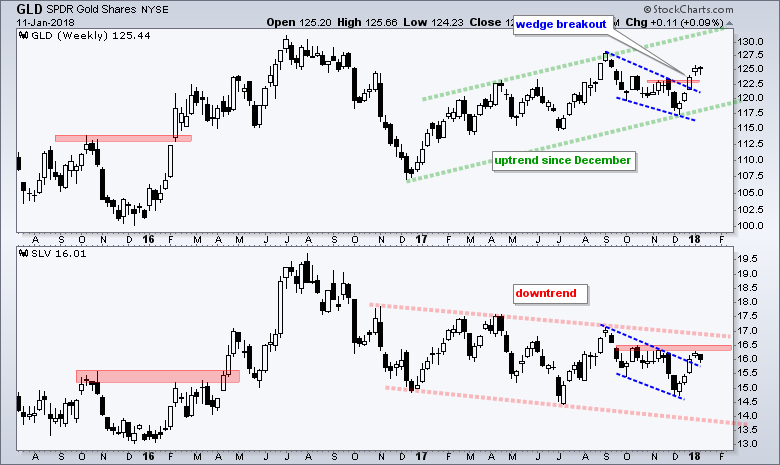
The Gold SPDR (GLD) broke the wedge line and exceeded the November high with a surge in December. This breakout is holding as gold stalled just above the resistance level. Chartists looking for a play can turn to the daily chart and wait for RSI(10) to dip into the oversold zone (30-40). The second chart shows the Silver ETF (SLV) trending lower as gold trends higher. SLV broke out of a falling channel in December but has yet to exceed the red resistance zone.
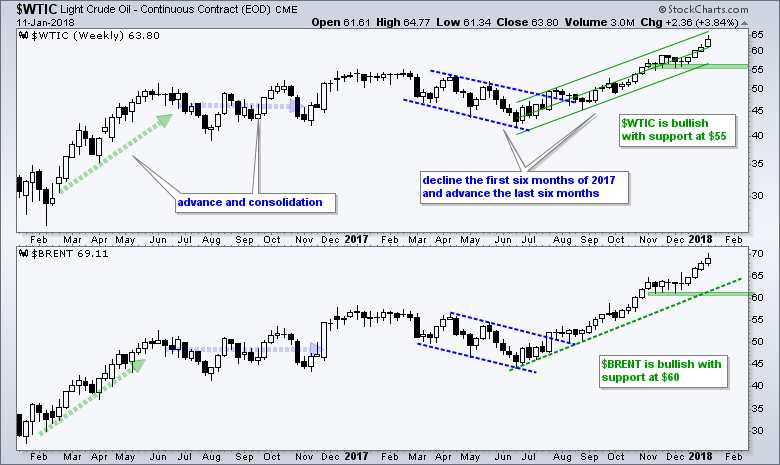
Oil Extends Uptrend
The Light Crude Continuous Contract ($WTIC) and the Brent Crude Continuous Futures ($BRENT) moved higher for the fourth consecutive week. Both are now up around 50% from their summer lows and in clear uptrends. The Raff Regression Channel and November lows mark support in the 55-56 area for $WTIC. The June trend line and November lows mark support in the 60-61 area for $BRENT.
Notes from Art's Charts ChartList (click here)
- The Retail SPDR (XRT) held the breakout zone (45) and hit a 52-week high with a big surge the last two days.
- Tech remains strong with new highs in the Cloud Computing ETF (SKYY), Internet ETF (FDN), Cyber Security ETF (HACK), Networking iShares (IGN) and Software iShares (IGV) this week.
- The Semiconductor SPDR (XSD) and Semiconductor iShares (SOXX) may be lagging a little because they are not at new highs, but both are in clear uptrends and very close to hitting new highs.
- The Broker-Dealer iShares (IAI) extended its breakout and hit a 52-week high this week.
- The Insurance SPDR (KIE) joined the party with a flag breakout this week. RSI also moved from the oversold zone this week.
- The Mortgage REIT ETF (REM) formed a big symmetrical triangle within an uptrend and RSI dipped into oversold territory twice. This is a tough call because REITs are out of favor.
- The Regional Bank SPDR (KRE) broke out of its pennant formation with a three day surge and hit a 52-week high.
- The REIT iShares (IYR) broke its September-October lows and remains out of favor as the 10-yr T-Yield ($TNX) rises.
- The iShares Aerospace & Defense ETF (ITA), Airline ETF (JETS) and Transport iShares (IYT) hit new highs this week and powered the industrials sector to a new high.
- A golden cross triggered in the Oil & Gas Equip & Services SPDR (XES) as the 50-day EMA moved above the 200-day EMA. I consider this observable information, as opposed actionable.
- The Gold Miners ETF (GDX) bounced off trading range support in December and reversed the downswing with a breakout three weeks ago.
- The Telecom iShares (IYZ) formed a big bearish engulfing six weeks ago and then trading inside this range the last five weeks. Watch 30 for an upside breakout and 28.8 for a downside break.
ETF Master ChartPack
300+ ETFs organized in a Master ChartList and in individual groups.
Follow me on Twitter @arthurhill
Keep up with my 140 character commentaries.
Thanks for tuning in and have a good day!
--Arthur Hill CMT
Plan your Trade and Trade your Plan


