- New Highs in Major index ETFs (again).
- SPY: As Boring as Boring Gets.
- Materials SPDR Breaks Out of Bullish Pennant.
- REIT SPDR Springs a Bear Trap.
- XLI Forms Bullish Pennant.
- Some Groups are Already Correcting.
- ITB, IYT and SOXX Move into Corrective Mode.
- TLT Holds Neckline Support (for now).
- Oil Hits Another New High.
- Gold Surges as Dollar Free Falls.
- Notes from the Art's Charts ChartList.
 New Highs in Major index ETFs (again)
Close-only charts filter daily noise and allow chartists to focus on the underlying trends. Of the four price points on each bar (open, high, low, close), the close is by far the most important. In addition, many indicators are based solely on the closing prices (MACD, RSI, Moving Averages, Slope).
The chart below shows four major index ETFs that represent the broad market: the EW S&P 500 ETF (RSP), the S&P 500 SPDR (SPY), the S&P MidCap SPDR (MDY) and the S&P SmallCap iShares (IJR). All four recorded new closing highs this week and all four are in uptrends, both short-term and long-term. Simply put, there are simply no signs of selling pressure or price weakness on these charts.
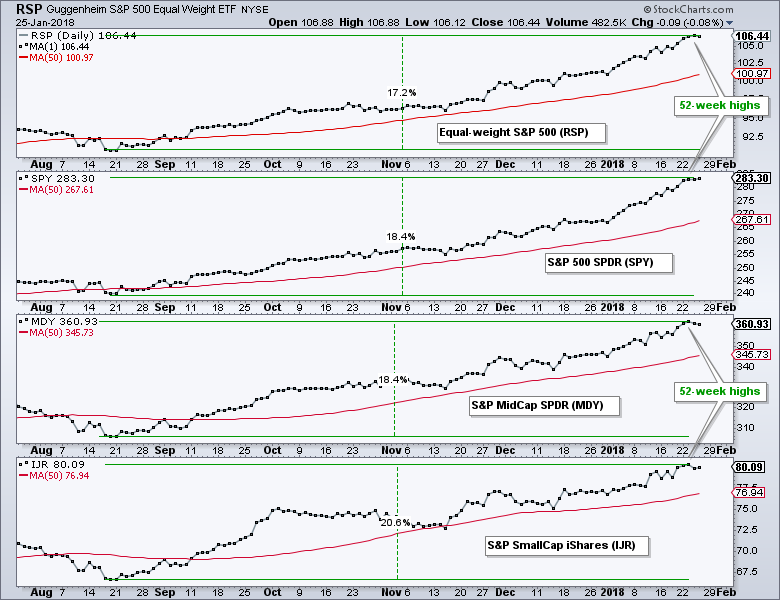
The green lines show the percentage gains from the mid-August low to the January high. The EW S&P 500 ETF is up the least, but it is still incredibly strong with a 17.2% gain. SPY and MDY are up around 18.4% and in the middle of the pack. The S&P SmallCap iShares is up over 20% and leading since mid-August. The red lines mark the rising 50-day moving averages for reference.
SPY: As Boring as Boring Gets
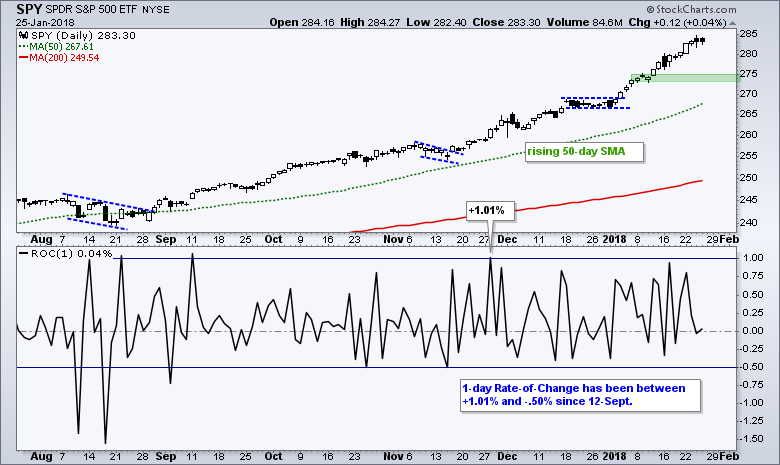
The S&P 500 SPDR (SPY) recorded new closing highs 13 of the last 17 trading days, including Monday, Tuesday and Thursday this week. Note that we have seen 17 trading days in January.
SPY hit these new highs with a string of daily gains that were less than 1%. In fact, 1-day Rate-of-Change has been between +1.01% and -.50% since September 12th. Talk about boring.
There is an old adage on Wall Street: Never Short a Dull Market. I would also add the following: Never Short a Bull Market and Expect Bullish Resolutions in a Bull Market.
Nobody knows when the next pullback will occur or what form it will take. I am, however, working under the assumption that a pullback will present an opportunity, not a threat. For now, I am watching the 273-275 area for support should we see a pullback.
IJR Holds Breakout
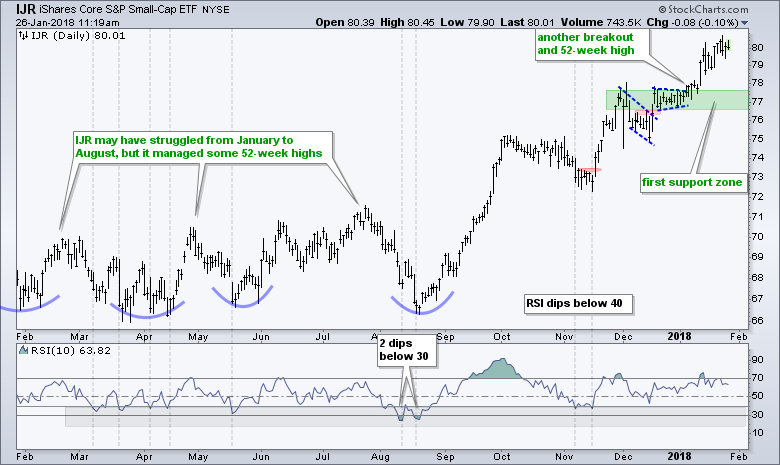
The S&P SmallCap iShares (IJR) is still outperforming SPY since mid-August, but underperforming in 2018 (up less). I am not concerned with some relative weakness because the trend is clearly up and the ETF hit a 52-week high this week. The last signal was the pennant breakout and it is holding. I am using the pennant range to mark a support zone in the 77 area.
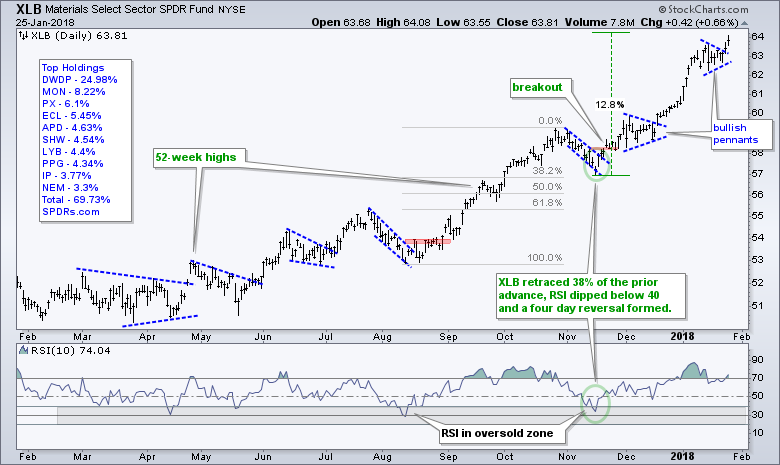
Materials SPDR Breaks Out of Bullish Pennant
Seven of the ten sector SPDRs hit new highs at some point this week. Participation in the broad market advance, therefore, remains broad. Of note, Vulcan Materials (VMC) and Martin Marietta (MLM) led a two-day surge in the Materials SPDR (XLB). These two stocks were featured in Art's Charts on Thursday. One day does not make for a winning trade, but they are off to the right start.
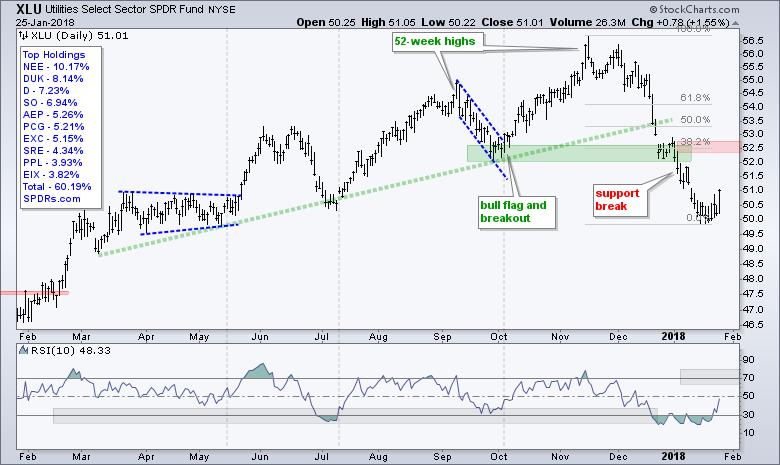
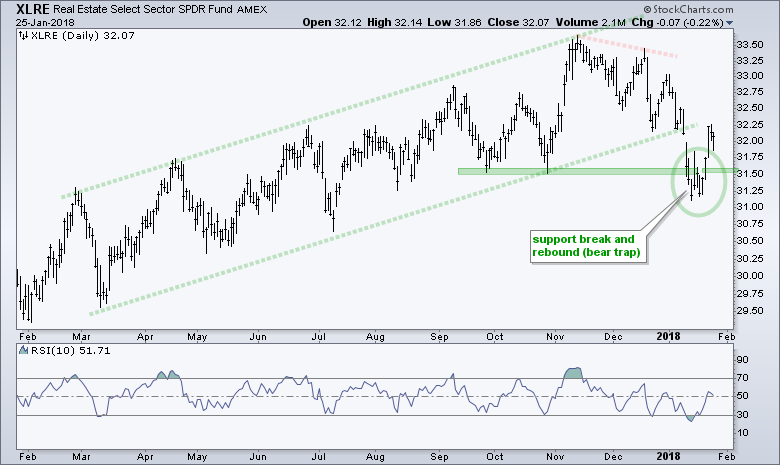
REIT SPDR Springs a Bear Trap
The beaten down Utilities SPDR (XLU) and Real Estate SPDR (XLRE) bounced this week. The first chart shows XLU breaking down and broken support turning into resistance in the 52.5 area. This is where I would expect this bounce to hit headwinds. Note that XLU bounced on Thursday along with the 20+ YR T-Bond ETF (TLT), which was up .82%.
The next chart shows XLRE springing a bear trap as it broke support and immediately rebounded. I am not interested in bottom picking for utilities, but the move in REITs is interesting because it started last week (well before TLT bounced). Perhaps there is something more behind the move in REITs. XLRE needs to hold 31.5 for this bear trap to remain bullish.
XLI Forms Bullish Pennant
One sector actually corrected over the last eight days. The Industrials SPDR (XLI) hit a new high last week and then edge lower with a pennant taking shape. This is a short-term bullish continuation pattern and a breakout at 80 would signal a continuation higher.
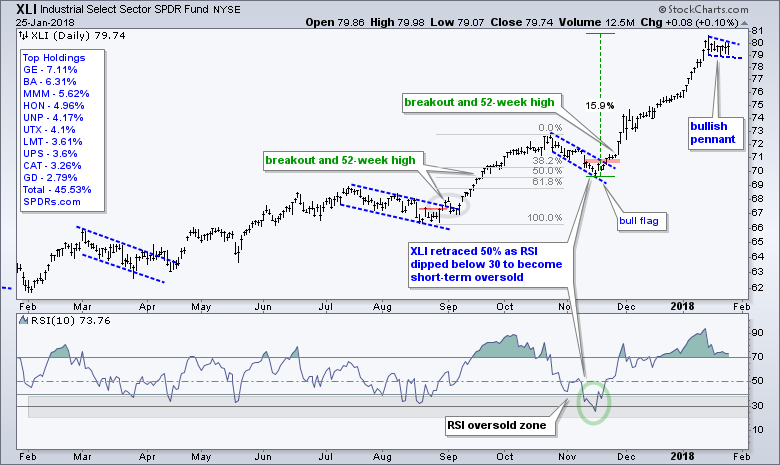
The XLB pennant breakout is currently bullish and an XLI breakout would also be bullish. I would, however, exercise some caution because these are short-term patterns and both ETFs are up double digits since mid-November. Big gains do not guarantee a pullback, but chartists should plan their trade and be prepared should a corrective pullback unfold.
Some Groups are Already Correcting
Even though the major index ETFs have yet to correct, we are seeing mild corrections in a number of industry group ETFs over the last eight days. The table below shows the industry group ETFs sorted by the 8-day Rate-of-Change. Three are down more than 4%, four are down more than 3%, two are down more than 2% and six are down more than 1%.
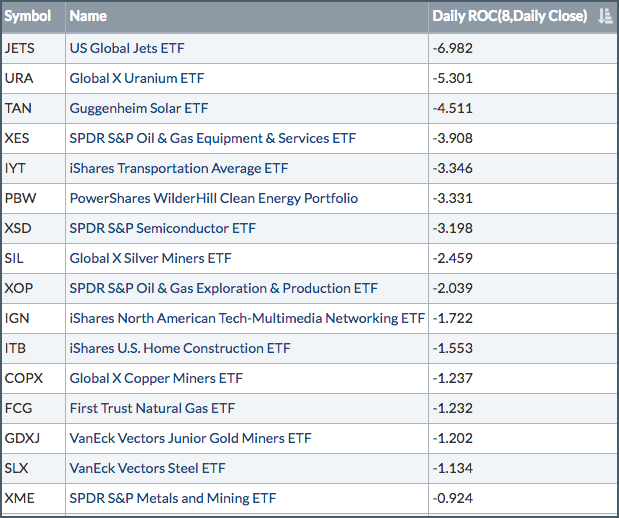
These declines are still quite modest and a 1-2% decline does not really count as a correction. This weakness, however, is more pronounced when we consider that the S&P 500 SPDR is up 2% over the same period. Thus, parts of the market are starting to diverge. The broader market would become vulnerable to a correction should more groups join the correction.
ITB, IYT and XSD Move into Corrective Mode
Even though the broader market shows no signs of a correction, several industry group ETFs may have started corrections and I will highlight a few of these charts. Note that I covered correction targets for XES, XME, SLX, COPX and AMJ in last week's commentary.
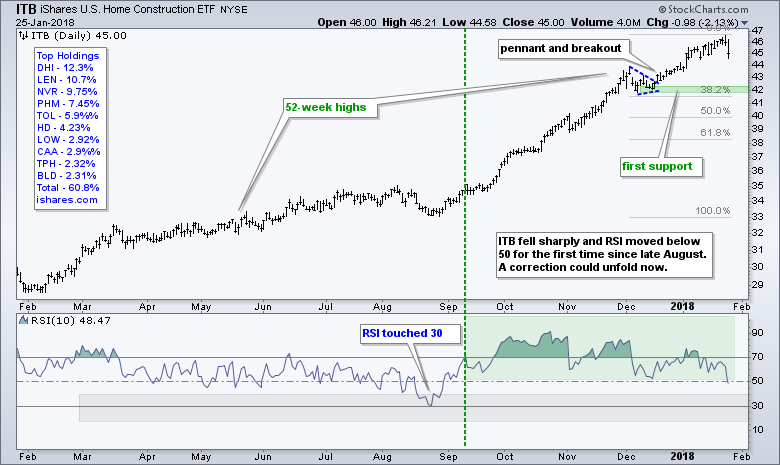
The Home Construction iShares (ITB) fell over 2% the last two days and RSI(10) move below 50 for the first time since late August. ITB is up around 30% since RSI first moved above 70 and this move below 50 means momentum is turning.
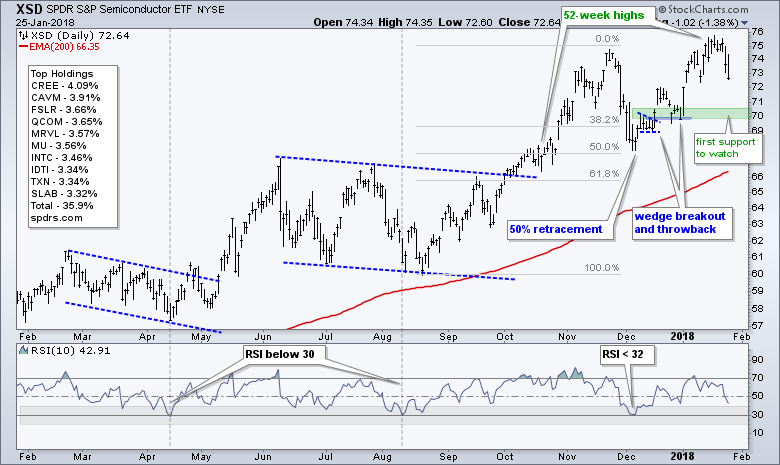
The Semiconductor SPDR (XSD) peaked last week and fell sharply the last two days. The big trend is clearly up after the recent 52-week high, but it looks like a correction is unfolding. The green zone marks first support in the 70 area.
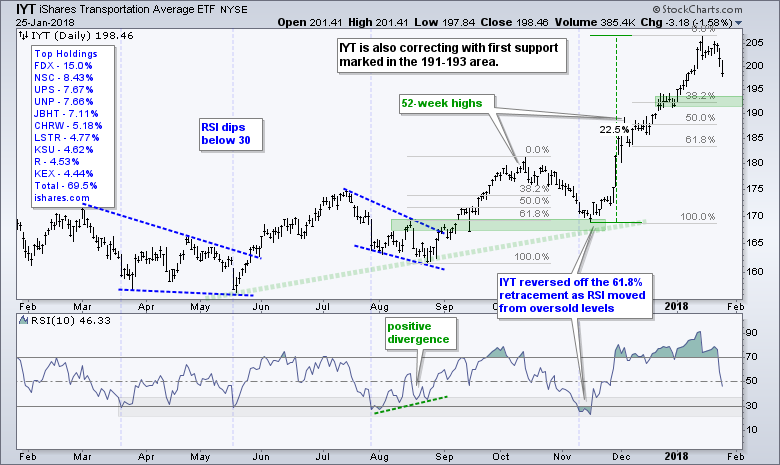
The Transport iShares (IYT) also peaked last week and fell over the last eight days. The ETF was up over 20% from mid-November to mid-January so a correction is perfectly normal. The small consolidation at the end of December and the 38% retracement mark the first support zone to watch.
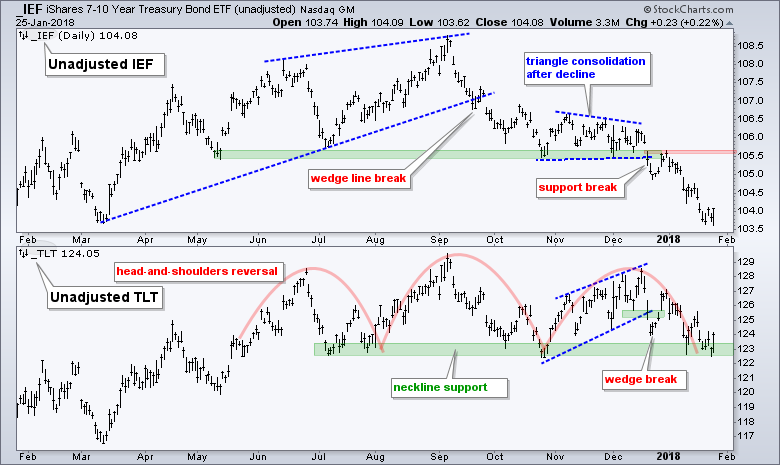
TLT Holds Neckline Support (for now)
The 7-10 YR T-Bond ETF (IEF) remains in a clear downtrend, but the 20+ YR T-Bond ETF (TLT) held neckline support with a bounce on Thursday. I am still bearish on Treasury bonds because IEF is clearly in a downtrend. TLT remains with a big head-and-shoulders reversal working and a break below neckline support would complete the pattern.
Oil Hits Another New High
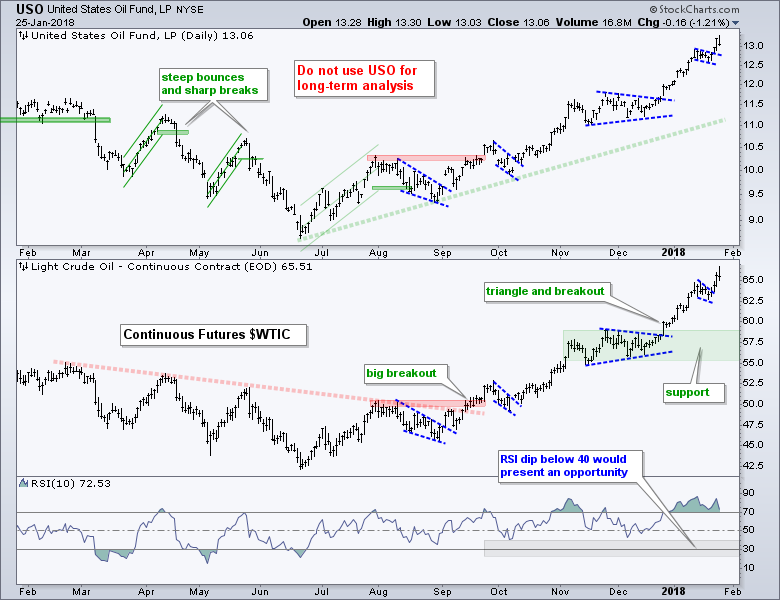
The Light Crude Continuous Contract ($WTIC) broke out of a small flag pattern this week and moved above $65 on Wednesday-Thursday. The uptrend is strong and oil is up around 18% from its early December low. I will leave first support in the 55-58 area for now.
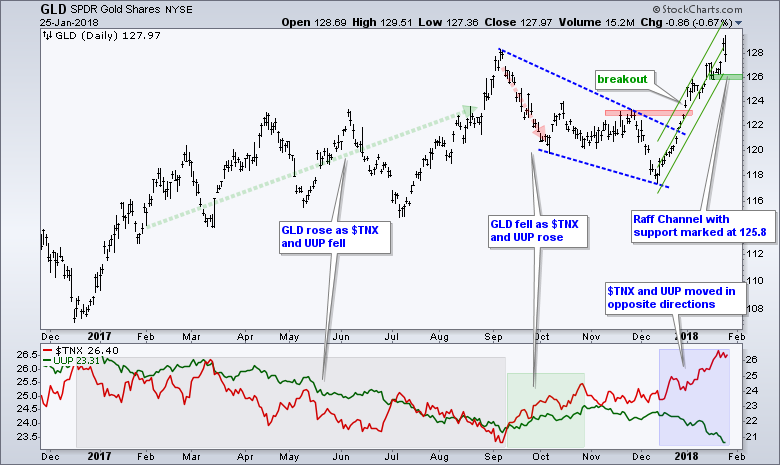
Gold Surges as Dollar Free Falls
The US Dollar ETF (UUP) is down around 8% since mid-December and the Gold SPDR (GLD) is up around 8%. In addition, UUP hit a 52-week low and GLD recorded a 52-week high. It all sounds Dollar bearish and gold bullish. The Raff Regression Channel and 18-Jan low mark upswing support at 125.80, a break of which would reverse the short-term upswing.
Notes from the Art's Charts ChartList
- The Home Construction iShares (ITB) fell sharply on Thursday and RSI moved below 50 for the first time since late August. A correction could unfold now.
- The Raff Channel, broken resistance and the early January consolidation mark upswing support in the 45-46 area for the Retail SPDR (XRT).
- SKYY, FDN, SOXX and IGV hit new highs this week to power the technology sector.
- The Networking iShares (IGN) fell back over the last eight days, but the overall trend remains up. Broken resistance in the 49 area turns first support.
- The Semiconductor iShares (SOXX) hit a new high this week, but fell back on Wednesday-Thursday. First support is set in the 175 area.
- The Mortgage REIT ETF (REM) remains on the "do not touch list" with the lower high and decline over the last six weeks.
- KRE, IAI and KIE hit new highs this week to power the finance sector.
- The REIT iShares (IYR) got a big oversold bounce and perhaps negated the support break (bear trap). The ETF needs to hold 78 to keep this bear trap alive.
- The Airline ETF (JETS) reversed its upswing with a gap down and close below the early January low.
- The Solar Energy ETF (TAN) is in the midst of a correction the last eight days and RSI is almost in the oversold zone (20-40).
- The Transport iShares (IYT) is also correcting over the last eight days with first support marked in the 191-193 area.
- The Biotech iShares (IBB) and Biotech SPDR (XBI) are leading in January with new highs and double digit moves since early December (the November dip was your friend).
- The Medical Devices ETF (IHI) and HealthCare Providers ETF (IHF) hit new highs and helped power the Health Care SPDR (XLV) to a new high as well.
- The Oil & Gas Equip & Services SPDR (XES) remains on correction watch with first support set in the 17-17.5 area.
Plan Your Trade and Trade Your Plan.
- Arthur Hill, CMT
Senior Technical Analyst, StockCharts.com
Book: Define the Trend and Trade the Trend
Twitter: Follow @ArthurHill
