- VIX Disconnnet Signals Caution.
- Charting Past Occurrences.
- Correction Targets for the S&P 500.
- More Industry Groups Join Correction.
- 3 Semiconductor Stocks to Watch.
 VIX Disconnet Signals Caution
The S&P 500 Volatility Index ($VIX) usually moves opposite the S&P 500, but this is not the case in 2018. One would normally expect the VIX to decline or stall when the S&P 500 surges, as it did here in January. Instead, the VIX rose along with the S&P 500 and this could foreshadow a correction in the coming weeks. Let's look at the evidence.
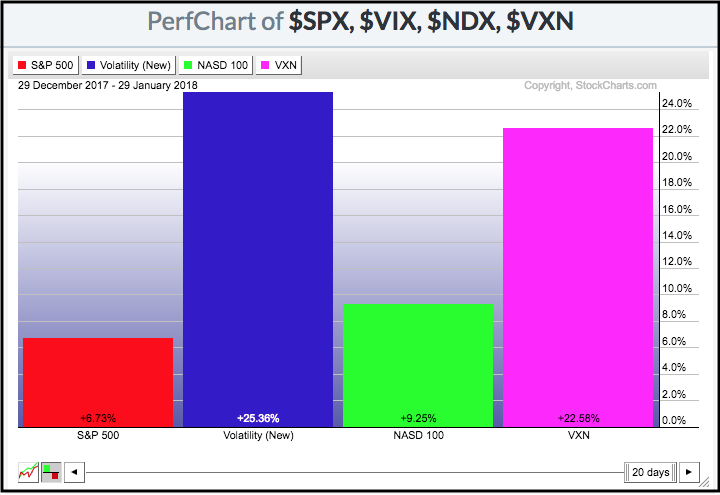
The PerfChart below shows just how pronounced this disconnect is. The S&P 500 is up 6.73% year-to-date and the VIX is up 25.36%. $VIX is also at its highest closing level since mid-August. Similarly, the Nasdaq 100 is up 9.25% this year and the Nasdaq 100 Volatility Index is up 22.58%. Clearly, something is amiss in January and this could lead to a corrective period.
The chart below shows the VIX in the top window, the 10-day Rate-of-Change for the VIX (blue) and the 10-day Rate-of-Change for the S&P 500 (black). The red vertical lines show when the 10-day ROC was positive for $VIX and $SPX for at least five consecutive days. In other words, this inconsistency lasted for at least a week.
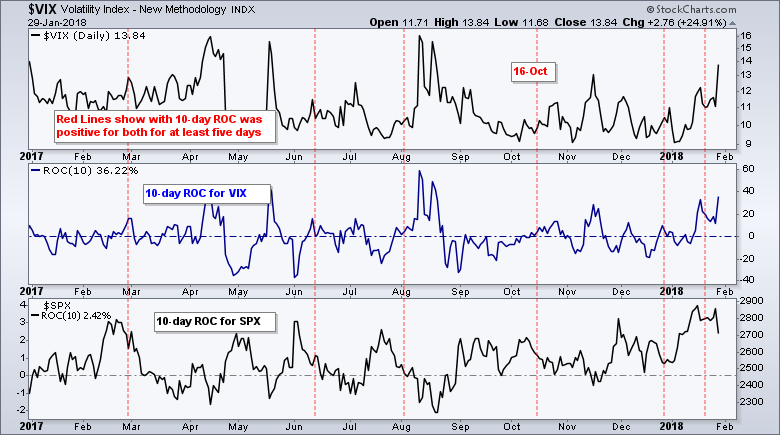
There were five occurrences in 2017, one on 13-April-2016 and one on 22-January. In addition, note that the 10-day ROC has been positive for $SPX and $VIX for ten days in a row now and this last occurred on 25-October-2017.
Charting Past Occurrences
Now let's put these five day runs on the S&P 500 chart to see how the market performed going forward. The first four occurrences foreshadowed corrections that lasted three to six weeks (red shading). The mid-October occurrence led to four weeks of flat trading and the late December occurrence foreshadowed a moon shot in January.
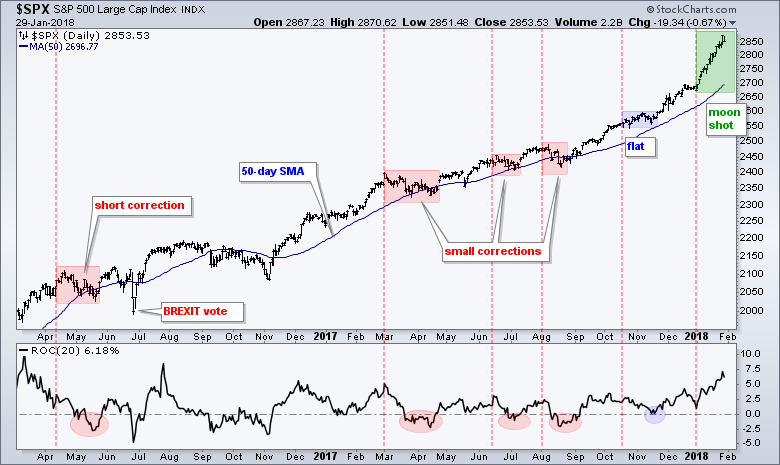
The indicator window shows the 20-day Rate-of-Change. Notice that the 20-day ROC dipped into negative territory the first four times and this confirms the corrective periods (red ovals). The 20-day ROC touched the zero line on the fifth occurrence (blue oval) and is currently above 6% on the December occurrence.
Even though the late December occurrence did not result in a correction, the prior five did result in corrections (four pullbacks and one flat). Given the extended nature of the stock market and the most recent occurrence on 22-Jan, I think the odds favor a correction sooner rather than later.
Correction Targets for the S&P 500
The S&P 500 is up over 10% since mid-November and up around 18% since mid-August. A normal correction could retrace 50% of the most recent surge and the S&P 500 could pull back to the rising 50-day SMA. Assuming this moving average edges higher over the next week or two, we could see a pullback to the 2720-2750 area.
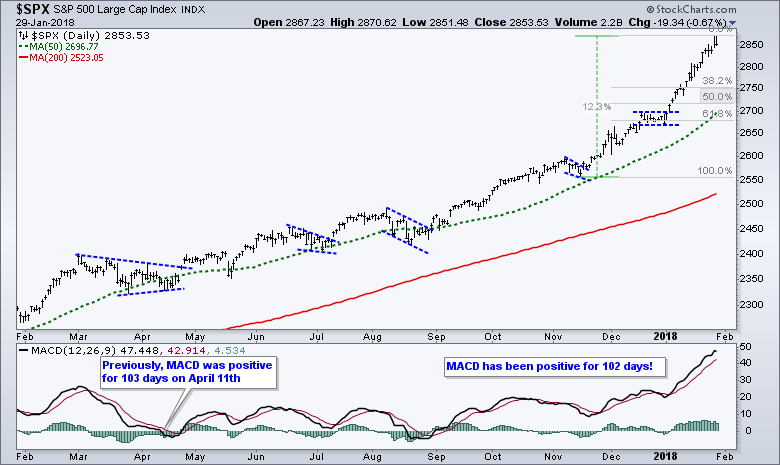
The indicator window shows yet another superlative to describe this bull market. MACD has been positive for 102 days now. This means the 12-day EMA has been above the 26-day EMA. Note that MACD was positive for 103 days from November 11th to April 11th. It has also been 49 days since RSI(14) was below 50.
More Industry Groups Join Correction
In Friday's commentary, I noted that several industry group ETFs were undergoing some sort of correction and underperforming the S&P 500. The S&P 500 is up 2.42% over the last ten trading days, but 21 of my 50 industry group ETFs are down during this timeframe. The table below shows the list for reference.
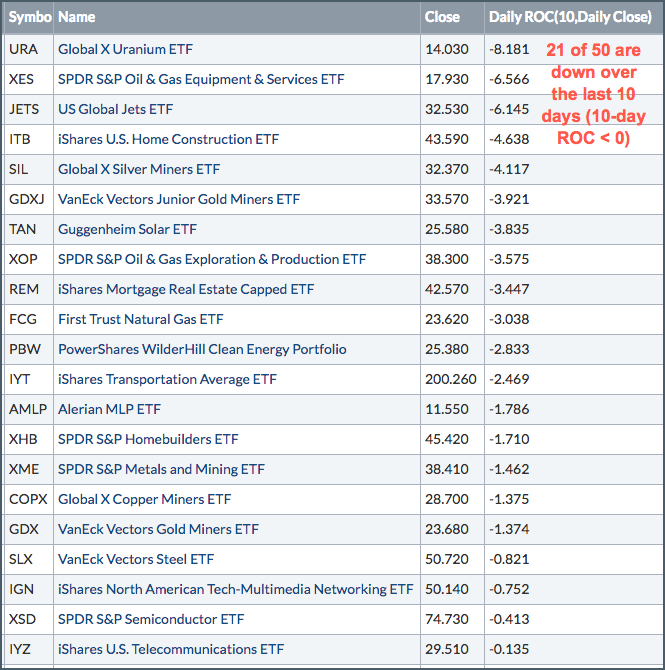 It appears that more industry groups are joining the correction and this means the broader market is vulnerable to a setback, even the large-cap S&P 500. Also note that the EW Energy ETF (RYE) and Energy SPDR (XLE) are down modestly over the last ten days. The Industrials SPDR (XLI), Materials SPDR (XLB) and EW Materials ETF (RTM) are down fractionally.
3 Semiconductor Stocks to Watch
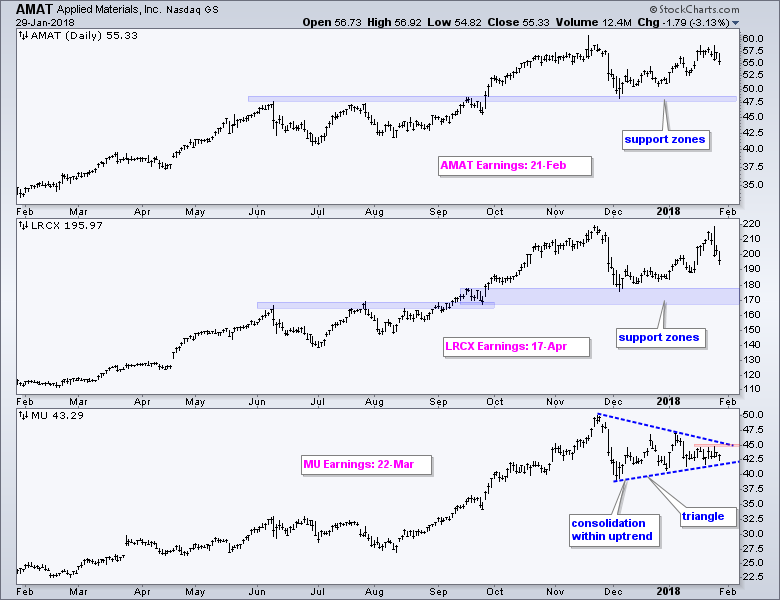
In this CNBC video, Paul Meeks, chief investment officer and portfolio manager with Sloy, Dahl & Holst, discusses the technology sector outlook with Brian Sullivan. Meeks likes Micron (MU), Applied Materials (AMAT) and Lam Research (LCRX). He also talks REITs and Airlines, but these are not his specialty.
The chart below shows all three stocks hitting new highs in November and then stalling the last two months. I am not going to draw out double tops because we are in a bull market and reversals are the exception, not the norm. Instead, I would be watching the support zones in AMAT and LRCX if we get a pullback in the broader market. MU has a triangle working and a breakout a 45 would be bullish.
Plan Your Trade and Trade Your Plan.
- Arthur Hill, CMT
Senior Technical Analyst, StockCharts.com
Book: Define the Trend and Trade the Trend
Twitter: Follow @ArthurHill


