- Go Long a Volatile Market?
- Setting Correction Targets for S&P 500.
- Leaders and Laggards During the Rebound.
- Scanning for Percent from High.
- Semis, Housing and Transports Lag.
 "Never short a dull market" is an old Wall Street saying. Even though we cannot build a strategy on a saying, there is usually some truth to be found.
The stock market, as measured by the S&P 500, was quite dull from early September to mid January. The key benchmark advanced some 15% during this timeframe and the daily Rate-of-Change remained between +1% and -1% for over 90 days.
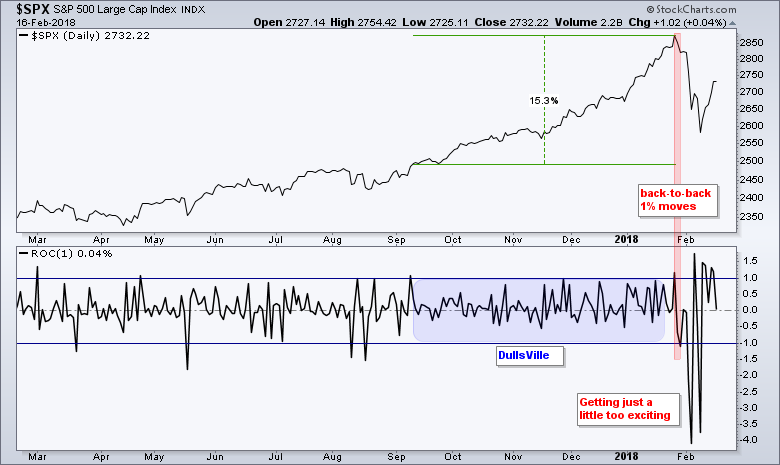 The fireworks started when the index broke the deadlock by advancing over 1% on January 26th and falling over 1% on January 30th (red area). This small uptick in action led to a series of massive moves over the next few weeks as the index plunged over 3.5% twice and advanced over 1% four times.
We are clearly seeing an uptick in volatility and I think we can now use the inverse of the old Wall Street saying. Never go long a volatile market. I am not predicting a crash or bear market here and I do not advocate short positions (or inverse ETFs). However, I think the volatile swings suggest that the S&P 500 is in the midst of a correction and this correction has yet to run its course.
Programming Note!
I will be on MarketWatchers Live with Tom Bowley today (20-Feb) at 12PM Eastern. Click here!
Setting Correction Targets for S&P 500
Before putting out a correction target, I must put out a few disclaimers. First, this is just an educated guess based on some basic Dow Theory. Second, nobody knows how long the correction will last and what shape it will take. It could be a price correction that retraces a portion of the last bull run. We could witness a time correction where prices move sideways. Or….it could be a combination of both price and time.
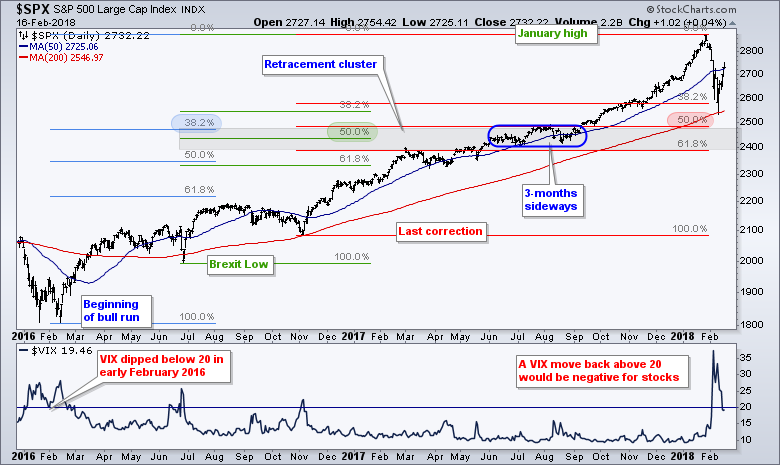
The first and most obvious target is a retest of the February low and rising 200-day SMA in the 2550 area. The second target is lower and would result in a break of the 200-day SMA. The 2400-2500 area is marked by a retracement cluster and the summer trading range (three months).
Even though I use the Fibonacci Retracements Tool to measure correction targets, there is some Dow Theory behind the length of a correction. Charles Dow suggested that a correction usually retraces between one third and two thirds of the prior move. Fifty percent is the base case because it is in the middle.
The Fibonacci Retracements Tool shows the 38.2%, 50% and 61.8% retracements. Technical analysis is not an exact science so we can get a pretty good idea of where the 33.3% and 66.6% retracements are using the Fibonacci Retracements Tool.
Leaders and Laggards During the Rebound
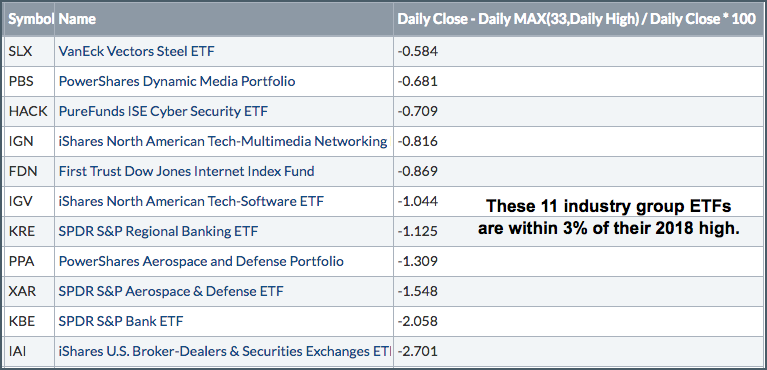
The stock market bounced sharply this past week and the S&P 500 is now around 5% from its January high. I ran a scan of industry group ETFs to see which were closest to their 2018 highs and which were furthest. This is a way to measure chart strength or weakness. ETFs closest to their 2018 highs show chart strength, while ETFs furthest from their 2018 highs show chart weakness.
The image below shows five ETFs within 1% of their 2018 highs and four within 2%. These are the groups holding up the best right now. Of note, we are seeing strength in steel, media, cyber security, networking, internet, software and regional banking.
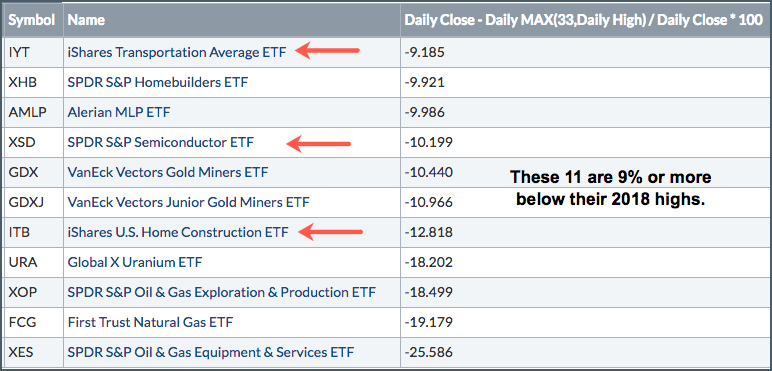
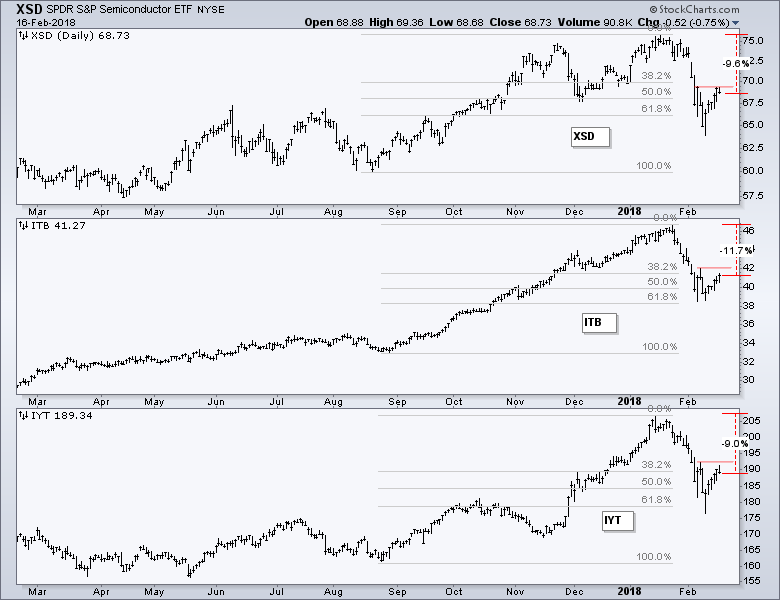
The next image shows the laggards because they remain 9% or more below their 2018 highs. Notice that this group includes the Semiconductor SPDR (XSD), the Home Construction iShares (ITB) and the Transport iShares (IYT).
Scanning for Percent from High
The text below shows sample scan code using the S&P 500 as the universe. I am just ranking by the percentage below the 33 day high, which covers 2018.
[group is SP500]
Rank by [[[close - max(33,high)] / close] * 100]
Semis, Housing and Transports Lag
The next chart shows three of the laggards during the six day rebound. The red areas mark the highs from February 6th and 7th. Notice that the Semiconductor SPDR (XSD), Home Construction iShares (ITB) and Transport iShares (IYT) did not clear these highs. In contrast, the S&P 500 SPDR (SPY) and Nasdaq 100 ETF (QQQ) moved above these corresponding highs. The shallow bounce shows some relative weakness in all three.
Plan Your Trade and Trade Your Plan.
- Arthur Hill, CMT
Senior Technical Analyst, StockCharts.com
Book: Define the Trend and Trade the Trend
Twitter: Follow @ArthurHill


