- Rubber Band Rebound.
- A Bearish Breadth Thrust.
- High-Low Percent Indicators Weaken.
- %Above Indicators Remain Bullish.
- Weight of the Evidence.
- SPX Clears 50-day as VIX Falls.
- Small-caps Take the Internal Lead.
- Scan Code for Top ROC.
- Tech-Related Industry Groups Lead.
- Notes from the Art's Charts ChartList.
 Rubber Band Rebound
Stocks rebounded sharply this week with the S&P 500 almost recouping the prior week's loss. The index closed at 2762 last week and is currently in the 2731 area. Thus, another 31 points or 1.2% is needed to fully make up for last week's 5.16% loss.
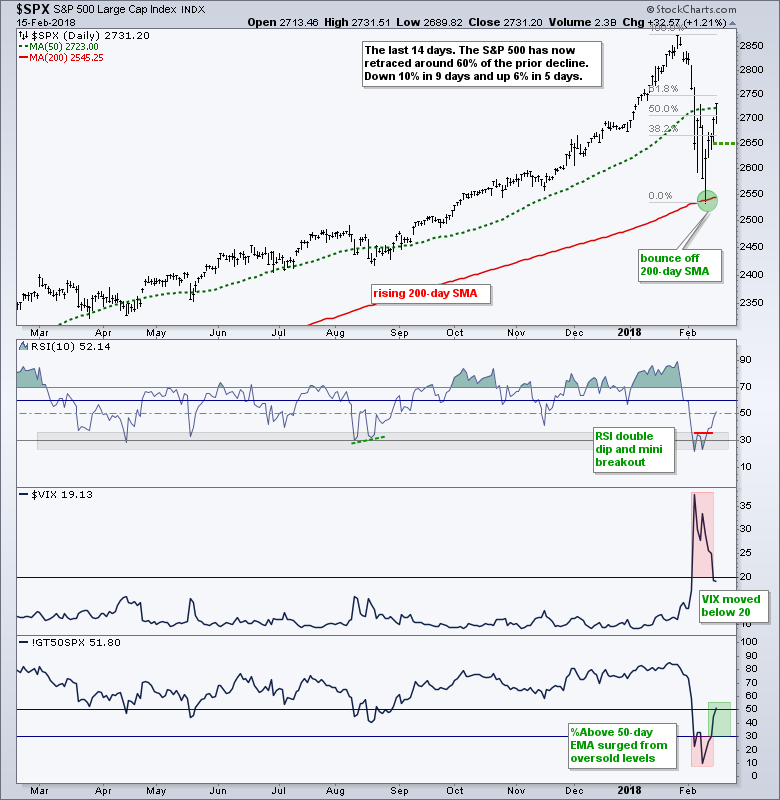
A sharp rebound after an even sharper decline is normal. Keep in mind that the S&P 500 was down around 12% from the January 26th intraday high to the February 9th intraday low. With a 4.26% rebound week-to-date, the index recaptured the 50-day SMA with a strong close on Thursday.
Is the correction over? I try my best to follow a price-breadth model that defines the path of least resistance for the broader market. The path of least resistance was unequivocally up from March 2016 to early February 2018. The February decline pushed several indicators into bear mode, but the model has yet to turn fully bearish. Thus, it is still a bull market.
As noted on Tuesday, new lows surged during the February decline. Overall, there were at least 114 new lows within the S&P 1500 (7.6%). This means 7.6% of stocks in the S&P 1500 are in strong downtrends and they will weigh on the broader market. A similar expansion of new lows occurred in July 2015 and this foreshadowed a corrective period that lasted several months.
At this point I think the 10+ percent plunge in stocks and surge in new lows signaled the start of a corrective period and I do not think this correction has run its course. "Think" is the key word here because I am speculating. At best, we could see choppy price action and a sideways correction (consolidation). At worst, we could see a test of the February low or even a break to new lows.
A Bearish Breadth Thrust
Greg Morris writes the "Dancing with the Trend" blog and he advocates rules-based models to make the decisions for us. Models are not perfect, but they are often more reliable decision makers than humanoids.
I also subscribe to the theory that we need a model and we need to build a strategy around our model. I use breadth indicators and price analysis of the S&P 500 to define the broad market environment (bull market or bear market). Let's see where these indicators stand.
The first breadth indicator is the 10-day EMA for AD Percent for the S&P 500, S&P Mid-Cap 400 and S&P Small-Cap 600 (S&P 1500). I use this to detect a bullish breadth thrust (> +30%) or a bearish breadth thrust (< -30%). This indicator group is net bullish/bearish when two of the three trigger signals.
The chart below shows two of the three triggering bullish signals in early March 2016 (S&P MidCap 400 and S&P SmallCap 600 triggered). The S&P 500 triggered on June 30th. The bullish signal lasted almost two years as all three triggered bearish signals in early February.
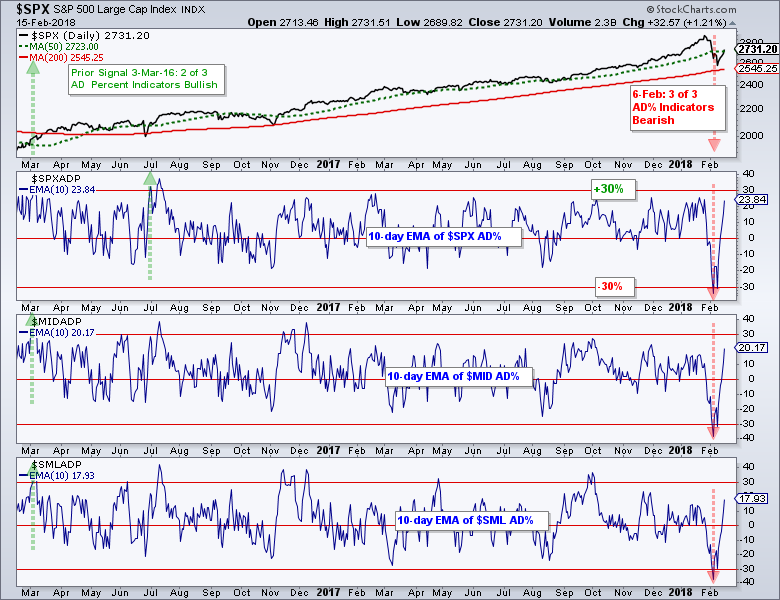
These indicators rebounded sharply the last five days with two of the three surging above +20%. This surge is impressive, but still short of the threshold required for a bullish signal (> +30%). Thus, the group remains net bearish.
High-Low Percent Indicators Weaken
The High-Low Percent indicators provide a rough measure of stocks in strong uptrends versus stocks in strong downtrends. This indicator triggers bullish when High-Low Percent exceeds +10%, which suggests that more than 10% of stocks are in strong uptrends. This signal remains until High-Low Percent moves below -10%, which suggests that more than 10% of stocks are in strong downtrends.
The chart below shows two of the three High-Low Percent indicators triggering bullish in late March 2016. All three remained on bullish signals until the S&P MidCap 400 triggered bearish with a move below -10% last week. The S&P 500 and S&P SmallCap 600 managed to hold above -10% and did not trigger signals. Thus, two of the three High-Low Percent indicators remain on bullish signals and the indicator is net bullish.
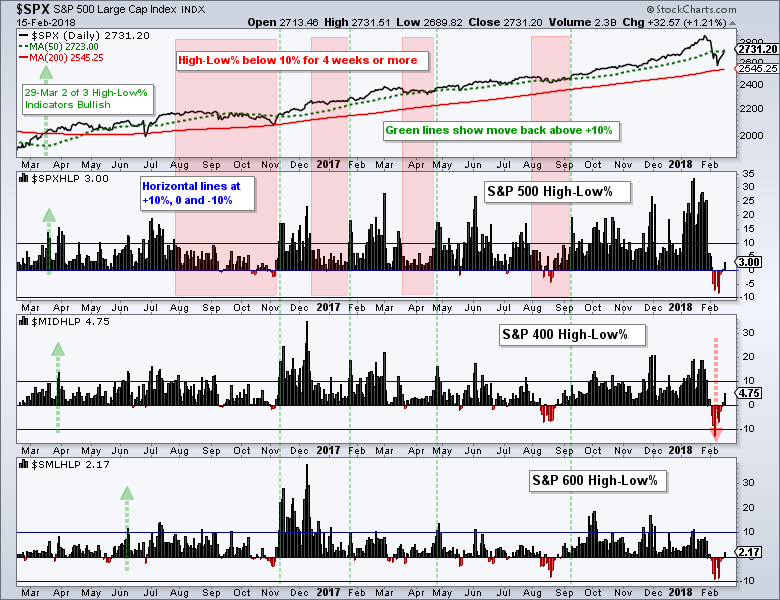
The red shading shows when S&P 500 High-Low% ($SPXHLP) stayed below 10% for an extended period (greater than four weeks). These periods also coincided with corrections or sideways price movement in the S&P 500. The corrections ended when High-Low Percent moved back above +10% (green lines).
%Above Indicators Remain Bullish
The final indicator trio is the percentage of stocks above the 200-day EMA for the S&P 500, S&P Mid-Cap 400 and S&P Small-Cap 600. This indicator triggers bullish with a move above 60% and bearish with a move below 40%. Two of the three triggered bullish in mid March 2016 and all three remain bullish right now.
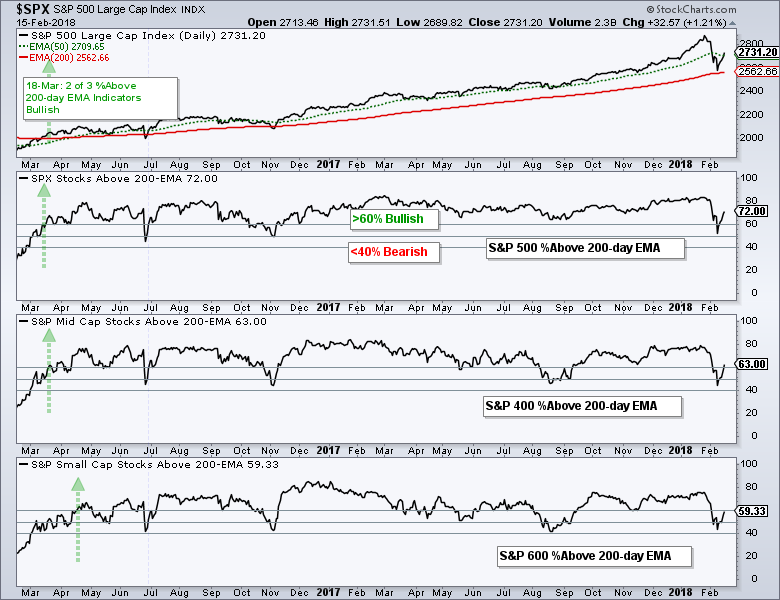
This is a lagging indicator for two reasons. First, the 200-day EMA is a long-term moving average and moving averages are lagging indicators. Second, the bullish and bearish thresholds are set just above and below 50% to reduce whipsaws.
With this week's rebound, S&P 500 %Above 200-day EMA (!GT200SPX) moved above 70%, Mid-Cap %Above 200-day EMA (!GT200MID) moved above 60% and Small-Cap %Above 200-day EMA (!GT200SML) neared 60%. The cup is still have full for this indicator trio.
Weight of the Evidence
There are three breadth indicators and three indexes for a total of nine indicators. Four of the nine triggered bearish signals and five of the nine remain on bullish signals. There is clearly some weakness within the market, but it is not yet enough to warrant a bear market environment. Nevertheless, four bearish signals is perhaps enough to suggest a choppy environment until more stocks recover.
SPX Clears 50-day as VIX Falls
The next chart shows reason to think the correction ended. The S&P 500 Volatility Index ($VIX) moved back below 20, RSI bounced twice from oversold levels and S&P 500 %Above 50-day EMA (!GT50SPX) moved back above 50%. Throw in a close above the 50-day SMA and the cup is suddenly looking half full. I will consider this week's reversal bullish as long as it holds and re-evaluate on a close below 2650.
Small-caps Take the Internal Lead
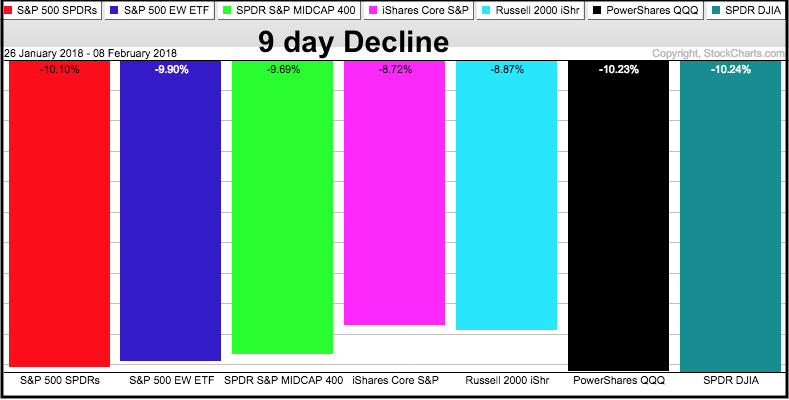
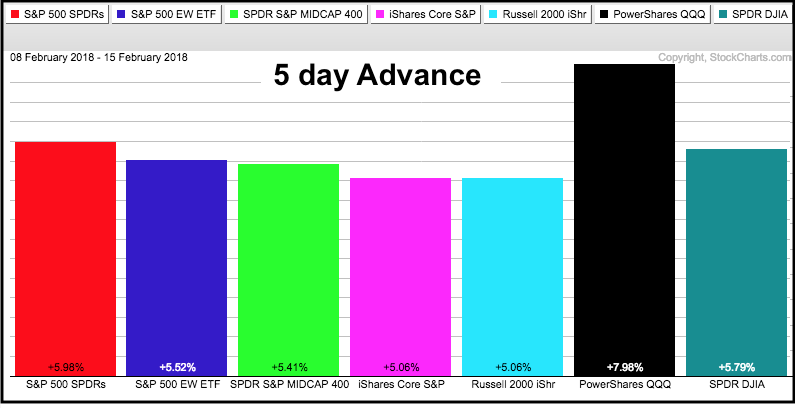
As shown above, the major index ETFs are down between three and five percent since the January peak (14 trading days). Even though small-caps are lagging in other breadth metrics, they are showing some relative strength over the last three weeks.
Consider the following. 68 stocks (12.4%) in the S&P 500 are positive over the last 14 days. 75 stocks (18.75%) in the S&P Mid-Cap 400 are up and 133 stocks (22.16%) in the S&P Small-Cap 600 are up. These numbers are fascinating because they point to strength in small-caps. 22% of small-caps managed to gain when the broader market fell.
The image below shows the top 19 stocks in the S&P 500. These are ranked by the 14-day Rate-of-Change, which extends from January 26th to February 15th.
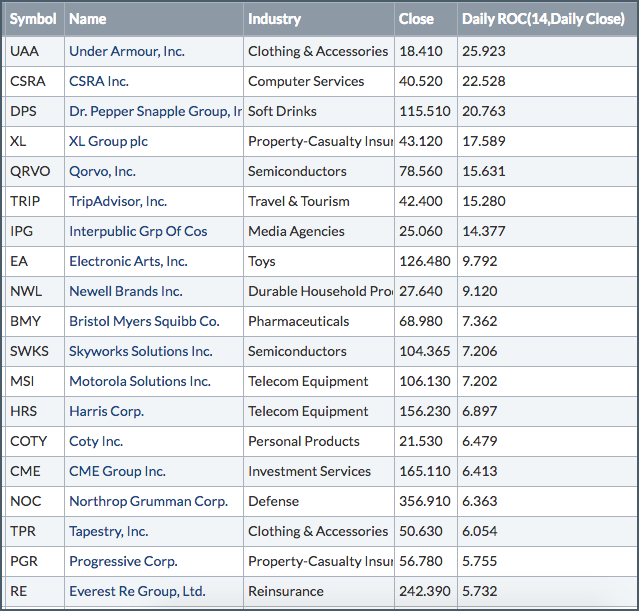
Clearly, the majority of stocks are still down during this period, but there are pockets of strength to be found. At the very least, these stocks are showing absolute and relative strength during a volatile period.
Scan Code for Top ROC
The scan code for the Rate-of-Change rank is shown below. Note that the scan engine ignores any text to the right of two forward slashes (//). The code below ignores the S&P 500 and S&P Mid-Cap 400, and focuses on the S&P Small-Cap 600. The last line using the "Rank by" function to sort the results.
// [group is SP500]
// [group is SP400]
[group is SP600]
AND [ROC(14) > 0] // 14-day Rate-of-Change is greater than 0
Rank by ROC(14) // Rank results by 14-day Rate-of-Change
Tech-Related Industry Groups Lead
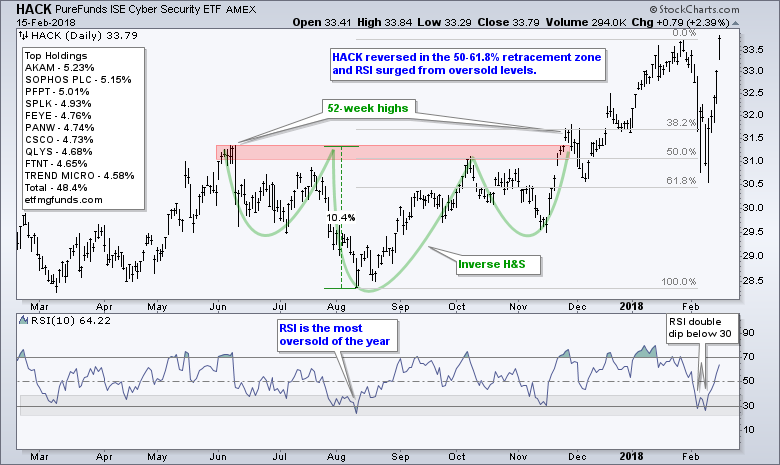
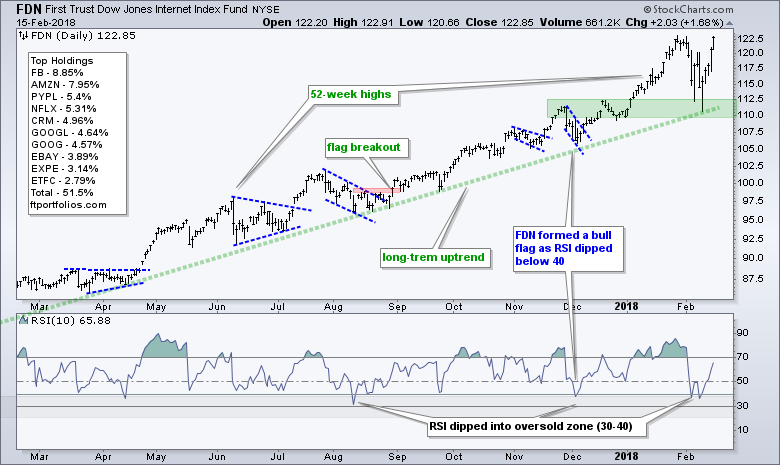
All sectors are in the red over the last 14 trading days, and only three industry group ETFs are up (FDN, IGN and HACK). The Networking iShares (IGN) and Cyber Security ETF (HACK) hit new highs this week, while the Internet ETF (FDN) is very close to a 52-week high.
Notes from the Art's Charts ChartList
Last week we saw a number of industry group ETFs trading in retracement zones and with RSI in the oversold zone. Many of these ETFs surged this week and broke above last week's high.
The model would have bought when these charts were ugly and oversold (pullbacks in long-term uptrends). The humanoid, which I have been known to resemble, may not have had the guts. Buying ugly charts is hard, but pullbacks within uptrends usually resolve to the upside. Nevertheless, my broad market outlook is mixed right now and I don't mind being on the sidelines.
- The Home Construction iShares (ITB) is firming in the 50-61.8% retracement zone, but this week's bounce was one of the weaker bounces.
- The Retail SPDR (XRT) firmed in the 50-61.8% retracement zone and then broke above last week's high. RSI also got an oversold bounce.
- After one of the shallowest pullbacks, the Internet ETF (FDN) reversed and surged towards a 52-week high.
- The Networking iShares (IGN) reversed in the 38-50% retracement zone and surged to a new high.
- The Semiconductor iShares (SOXX) reversed at the 50% retracement as RSI bounced off the 30 area twice.
- The Broker-Dealer iShares (IAI) found support in the flag zone and 50-61.8% retracement zone, and then surged above last week's high.
- The Regional Bank SPDR (KRE) found support in the middle of the triangle and near the 50% retracement, and then broke above last week's high.
- The iShares Aerospace & Defense ETF (ITA) had one of the shallowest pullbacks as RSI almost hit 30. The ETF surged this week with a break above last week's high.
- The Solar Energy ETF (TAN) found support near the top of the Aug-Sep consolidation and reversed in the 38-50% retracement zone. RSI surged out of oversold territory.
- The Copper Miners ETF (COPX) reversed near the 61.8% retracement as RSI surged out of oversold territory.
- The Metals & Mining SPDR (XME) surged off broken resistance and the 61.8% retracement as RSI moved out of oversold territory.
BusinessInsider Interview with Jim Chanos: Among other things, Chanos discusses Treasury yields, TSLA, VRX and Enron, China property, tax reform and Silicon Valley.
Plan Your Trade and Trade Your Plan.
- Arthur Hill, CMT
Senior Technical Analyst, StockCharts.com
Book: Define the Trend and Trade the Trend
Twitter: Follow @ArthurHill


