- Bulls, Bears and Fishermen.
- Long-term Picture Still Bullish.
- Rising SMAs for the S&P 500.
- A Short-term Bullish Pattern for SPY.
- Small-caps Show some Short-term RS.
- Lots of Little Consolidations.
- Oil Extends Bounce off Support.
- Energy Stocks are Not Impressed.
- Gold Miners Not Impressed Either.
- Notes from the Art's Charts ChartList.
 Something for Everyone
You can see whatever you want to see when looking at a chart and the current market has something for everyone: bulls, bears and fishermen.
The bulls can point out the parade of 52-week highs in January, the successful test of the 200-day SMA in the S&P 500, the high-volume reversals on February 6th and 9th, and the move back below 20 in the S&P 500 Volatility Index ($VIX).
The bears can point out that the VIX remains above its 2017 highs, the bearish breadth thrust in early February, the shooting star candlesticks over the last few days, short-term resistance near a Fibonacci number and the low volume bounce.
I remain in the correction camp and this means I favor a fishing trip. Nick Radge, the Chartist from Australia, gets credit for saying there are times to be bullish, times to be bearish and times to go fishing. I have yet to see enough bearish evidence to warrant a bear market, but the sharp decline in early February ushered in this correction and I have yet to see enough evidence that the correction has ended (see last week's report for details)
Nobody knows how a correction might unfold or when it will end. We could see a multi-month sideways range for the S&P 500 (2550 to 2850). We could see a retest of the February low in the coming weeks or months. It is even possible that the correction ended with the first test of the 200-day SMA. Yes, I can hear the collective gasp from here.
Being in the correction camp means I am preparing for a few more weeks or even months of frustration without much sustained direction. There may be some decent swings and the current upswing may even have further room to run. However, I will not return to a fully bullish stance until a see evidence that the correction has ended.
Long-term Picture Still Bullish
The long-term evidence still supports an uptrend for the S&P 500 (bull market). The index hit a 52-week high in late January, the 50-day SMA is above the 200-day SMA, price is above the 200-day SMA and both SMAs are rising.
The last "decent" correction occurred in October-November 2016 and I drew the Fibonacci Retracements Tool from this low. The February decline retraced between 38.2% and 50% of this advance, which is actually quite normal for a correction. Think two steps forward (2100 to 2870) and one step backward (2870 to 2530).
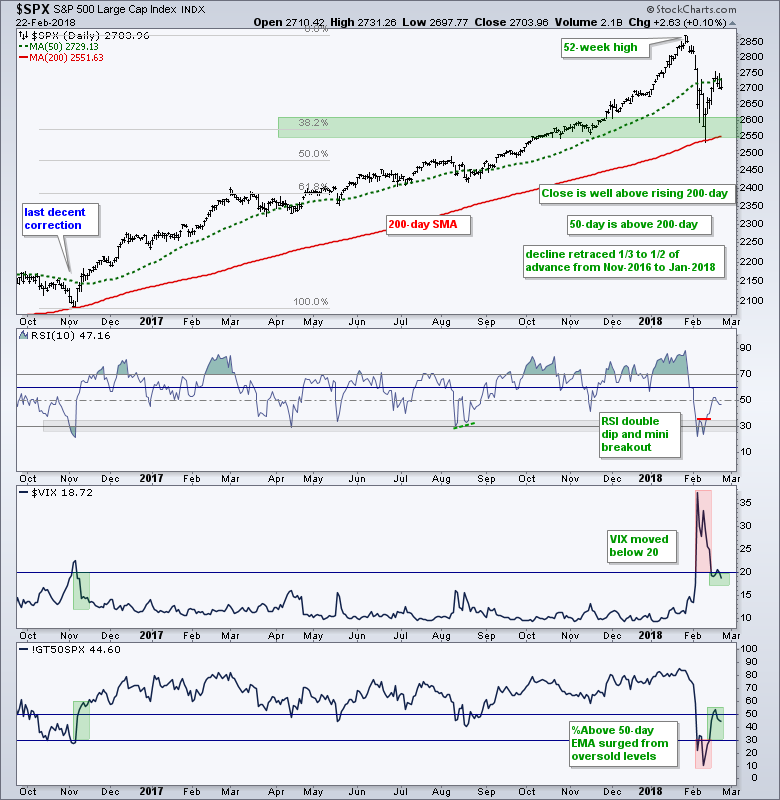
Short-term, the evidence also favors the bulls. RSI dipped below 30 twice and broke out. The S&P 500 Volatility Index ($VIX) dipped below 20 three of the last five days, and closed below 20 on Thursday. The S&P 500 %Above 50-day EMA (!GT50SPX) surged from oversold levels and remains near 45%.
Rising SMAs for the S&P 500
How can we tell if a moving average is rising or not? StockCharts users can plot moving averages and ignore the price plot for a clean view of the moving average.
The chart below shows the 5-day SMA (green) turning up on February 13th and the 50-day SMA (red) turning up on February 9th. Even though the S&P 500 stalled the last few days, the 5-day SMA is still creeping higher.
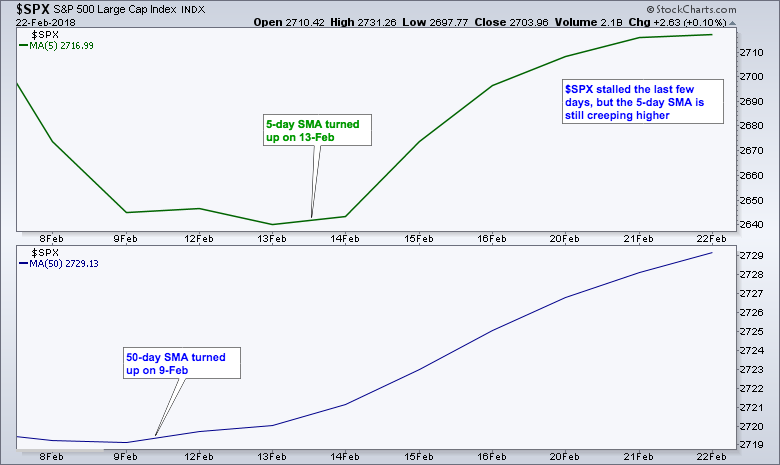
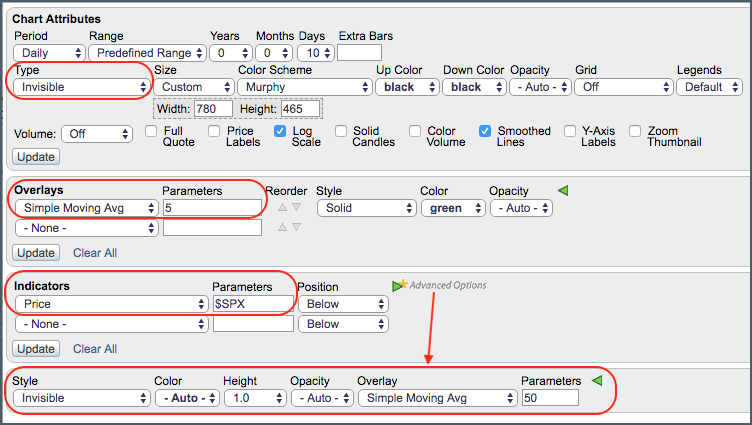
The chart above isolates the 5-day SMA in the top window and the 50-day SMA in the bottom window by choosing "invisible" for the S&P 500 plot. The image below shows these settings in SharpCharts.
A Short-term Bullish Pattern for SPY
I hate to get this short-term in a weekly report, but there are some bullish patterns taking shape in some major index ETFs and sector ETFs. Moreover, coordinated breakouts would be bullish for the broader market.
First, SPY is in a short-term uptrend and setting up with a bullish flag over the last five days. The chart below shows 30-minute bars and an 8.8% surge from February 9th to 16th. The market is entitled to a rest after such a surge and falling flags are typically bullish continuation patterns.
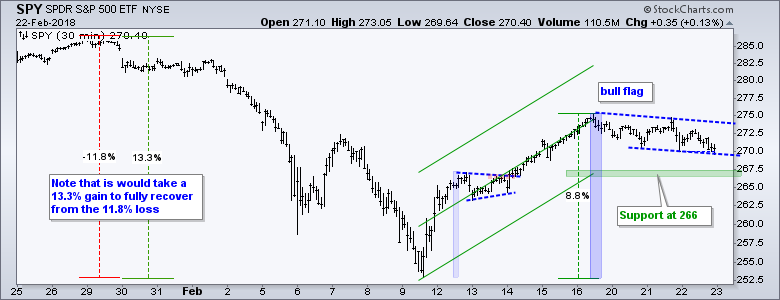
A move above 274 would break the upper line and signal a continuation of the prior advance. Given the size of the prior move, a breakout would suggest a challenge to the late January highs, perhaps even a new high. I will judge the strength of any advance once it gets here.
The lower line of the Raff Regression Channel marks upswing support at 266. A move below this level would reverse the short-term upswing and suggest that the correction is extending.
Small-caps Show some Short-term RS
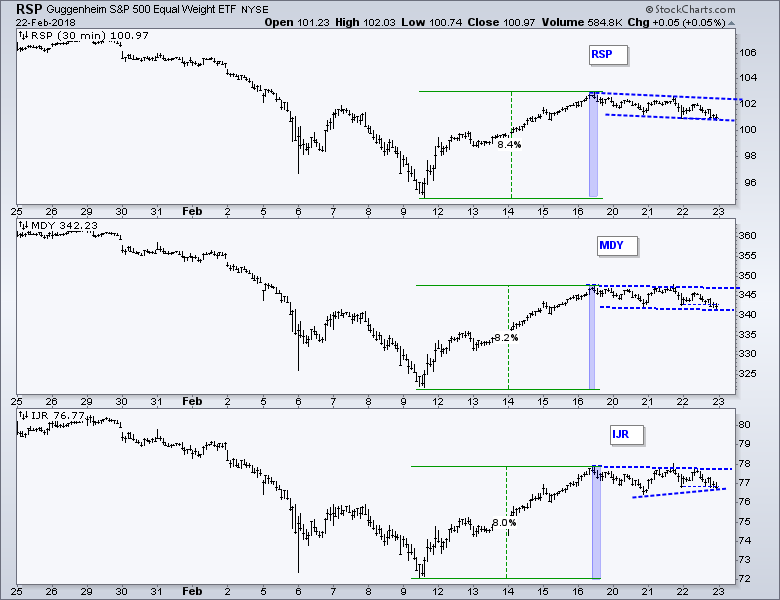
The next chart shows the EW S&P 500 ETF (RSP), S&P MidCap SPDR (MDY) and S&P SmallCap iShares (IJR) with 30-minute bars over the last twenty days. Note that SPY, RSP and MDY formed lower lows over the last few days, but IJR remains above its 20-February low. The ability to hold above the 20-February low shows a little less selling pressure in IJR and this is a form of relative strength (RS). Instead of a falling flag, IJR has a possible triangle/pennant taking shape. The more breakouts the more robust the move for the broader market. Thus, watch these three to judge the broadness behind any strength in the stock market.
Lots of Little Consolidations
The next image shows six sectors using a custom CandleGlance chart. Note that users can create a ChartStyle called CandleGlance and this ChartStyle will be applied to all your CandleGlance charts. Here is a link to a support article with a video (the CandleGlance ChartStyle is at 5:09 mark).
Before looking at the patterns in XLI, XLB, XLF, XLV, XLY and XLK, note that all six are above their 200-day EMAs and the 50-day EMAs are above the 200-day EMAs for all six. Thus, one could certainly make the case for long-term uptrends in these six sectors and these six account for almost 80% of the S&P 500.
The six sectors capture the stall over the last four days as a number of short-term bullish consolidation patterns formed (blue lines). Upside breakouts would signal a continuation of the February bounce and breakouts in the majority would be bullish for the broader market.
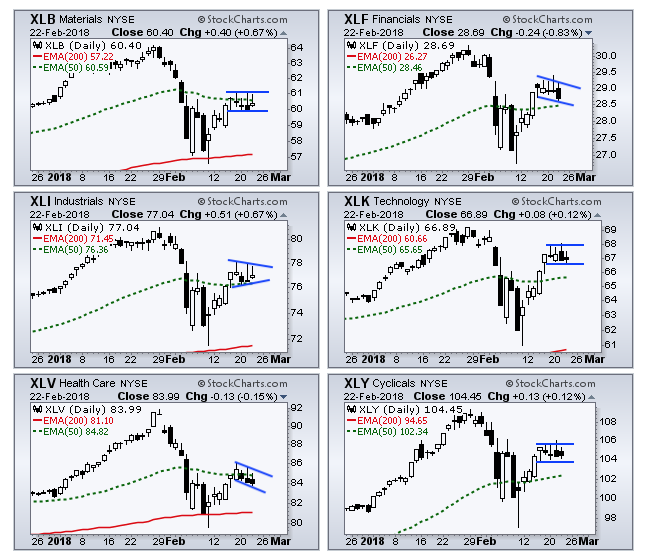
On the downside, breaks below the lower lines would be negative. I would also watch the 50-day EMAs for the big four. It would be short-term bearish for the market if XLI, XLK, XLY and XLF break their 50-day EMAs.
Oil Extends Bounce off Support
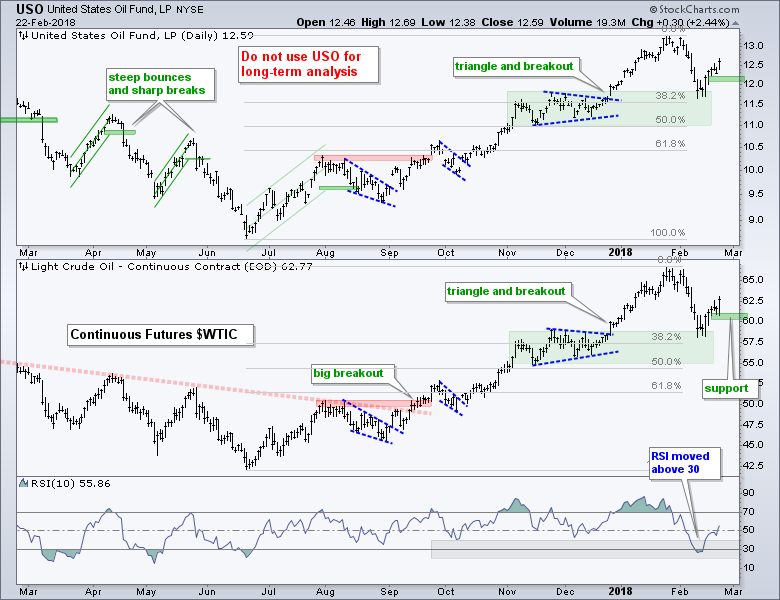
Oil bounced off the top of its support zone and moved above $62 this week. As with the stock market in general, I would focus on this short-term upswing for clues and mark support at 12 for USO and 60 for $WTIC. Closes below these levels would reverse the upswing and argue for a deeper retracement.
Energy Stocks are Not Impressed
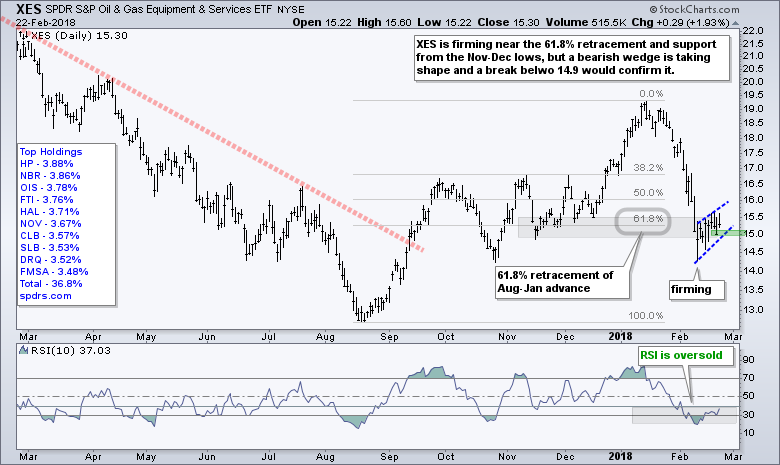
Oil is up around 4% year-to-date, but the Oil & Gas Equip & Services SPDR (XES) is down over 10% this year and the Energy SPDR (XLE) is down around 7%. I am not sure what gives here, but it is not encouraging when XES and XLE cannot muster gains along with oil.
The first chart shows XES firming near the 61.8% area and the November-December lows. XES is getting a bounce as RSI moves from oversold territory, but the bounce over the last two weeks looks quite feeble. This means XES could be vulnerable should oil move lower. I will give the bulls the benefit of the doubt for now, but a break below wedge support at 14.9 would call for a reassessment.
Gold Miners Not Impressed Either
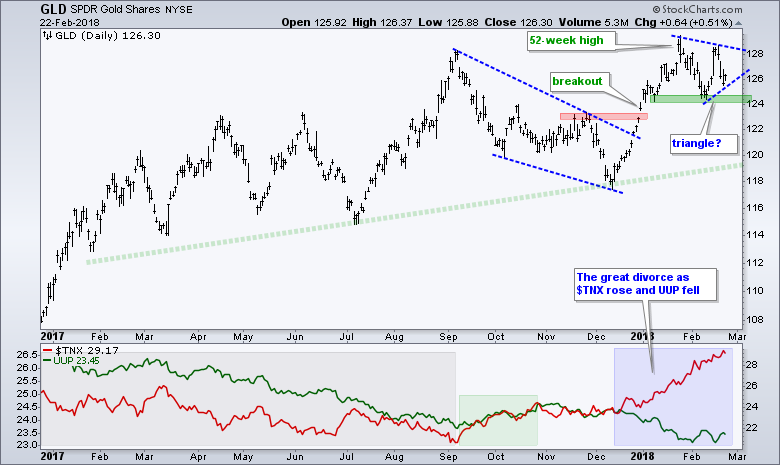
The Gold SPDR (GLD) is up around 2% year-to-date, but the Gold Miners ETF (GDX) and Gold Miners Junior ETF (GDXJ) are down over 6% this year. I am not going to show a chart for GDX because it is just one big trading range with short-term swings dominating.
The chart below shows GLD consolidating within an uptrend. GLD hit a 52-week high in late January and prices are clearly moving from the lower left to the upper right. It is possible that a triangle is taking shape over the last few weeks and this would be a bullish continuation pattern (rest within an uptrend). A break below 124 would negate this possibility and be medium-term bearish for gold.
Notes from the Art's Charts ChartList
- The Home Construction iShares (ITB) had one of the weaker bounces and remains below the 7-Feb high. A breakout at 42 is needed to put the bulls back in charge.
- The Broker-Dealer iShares (IAI) led on the rebound with a surge above 66, but turned down the last two days and a lower high could be forming.
- The Insurance SPDR (KIE) reversed near the 61.8% retracement with a hit on Thursday and closed at a 5-day low.
- The Regional Bank SPDR (KRE) remains in an uptrend overall with support marked in the 58-59 area. Note, however, that the ETF led during the rebound (12-16 Feb) and lagged this week (20-22 Feb).
- The iShares Aerospace & Defense ETF (ITA) led on the rebound as one of the first to break the 7-Feb high. A small consolidation formed and a breakout at 205 opens the door to new highs.
- The bounce in the Transport iShares (IYT) was one of the weaker bounces because the ETF did not clear the 7-Feb high.
- The Biotech iShares (IBB) fell four days straight this week. This is not encouraging, but a bull flag could be forming so watch for a breakout at 110.
- Oil is up around 4% year-to-date and back above $60, but the Oil & Gas Equip & Services SPDR (XES) continues to flounder with a bearish wedge taking shape.
- The Alerian MLP ETF (AMJ) tried to bounce off broken resistance and a key retracement, but failed miserably. Resistance is set at 28.50
- The Agribusiness ETF (MOO) led the oversold bounce with a breakout. The Raff Channel marks upswing support at 61.5.
- Gold is up around 2% year-to-date, but the Gold Miners ETF (GDX) is down over 6% this year and seriously underperforming.
- The Metals & Mining SPDR (XME) got a nice bounce off the broken resistance zone. The Raff Channel marks upswing support at 36.50
Plan Your Trade and Trade Your Plan.
- Arthur Hill, CMT
Senior Technical Analyst, StockCharts.com
Book: Define the Trend and Trade the Trend
Twitter: Follow @ArthurHill


