- SPY Leads with First Breakout.
- Small Caps and Mid Caps Still Lagging.
- Six Sectors and Six Upswings.
- Techs and Materials Lead New High List.
- The 800-pound Sector in the Market.
- Charting the Fab Five (AAPL, GOOGL, FB, AMZN, MSFT).
- Retail and Housing Lag.
 SPY Leads with First Breakout...
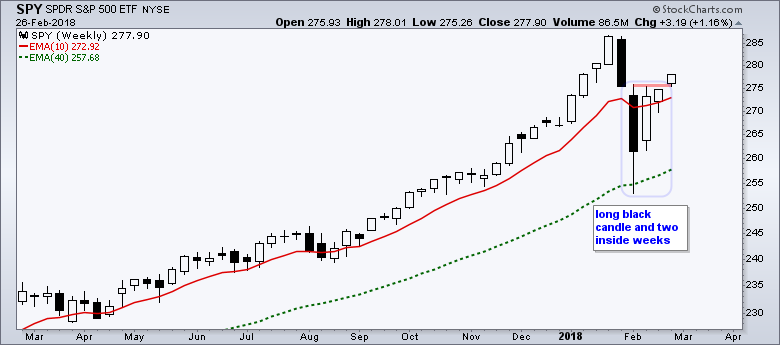
For the second time in three weeks, the S&P 500 SPDR (SPY) made good on a short-term bullish continuation pattern with a breakout. SPY first formed a pennant on February 12th and 13th, and broke out on February 14th, which has been dubbed the St. Valentine's day breakout.
As noted Friday morning, SPY and a host of other ETFs formed bull flags last week. SPY broke out on Friday and added to this breakout with a gap-gain on Monday.
The breakout is there and bullish as long as it holds. This means the breakout zone is the first area to watch for signs of failure. A move back below 273 would negate the breakout and suggest that the bulls are getting cold feet.
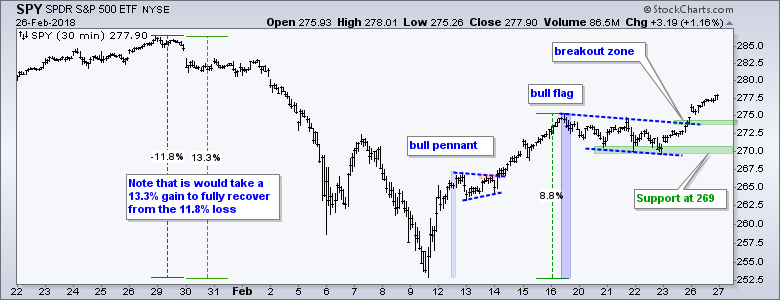 Chartists can now use the flag lows to mark support for the uptrend that began on February 9th. A break below 269 would reverse the short-term uptrend.
Personally, I think SPY and the broader market are still in no man's land. SPY is up around 8% in eleven days and short-term overbought. We do not need a momentum oscillator to figure this out. Normally, I would not be concerned with overbought conditions in an uptrend. I am, however, in the correction camp and overbought conditions could lead to subpar performance ahead.
Small Caps and Mid Caps Still Lagging
The next chart shows the EW S&P 500 ETF (RSP) breaking its flag line on Friday, the S&P MidCap SPDR (MDY) breaking out on Monday and IJR breaking out on Friday. IJR showed a little relative strength late last week, but failed to lead during the two-day bounce. SPY remains the leader because it was the first to break out and it is up the most over the last two days.
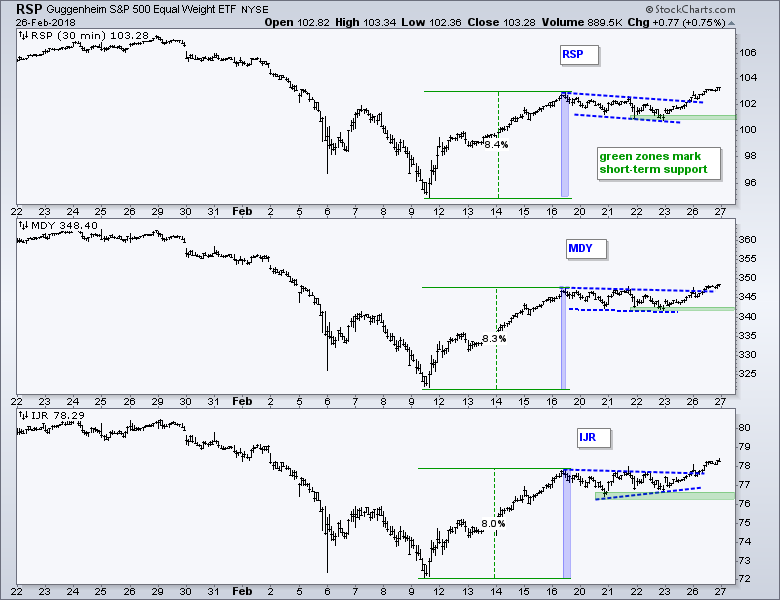
As with the SPY chart above, the green zones mark support at last week's lows and these lows hold the key to the short-term uptrend. Support breaks would reverse the uptrends that began on February 9th.
Six Sectors and Six Upswings
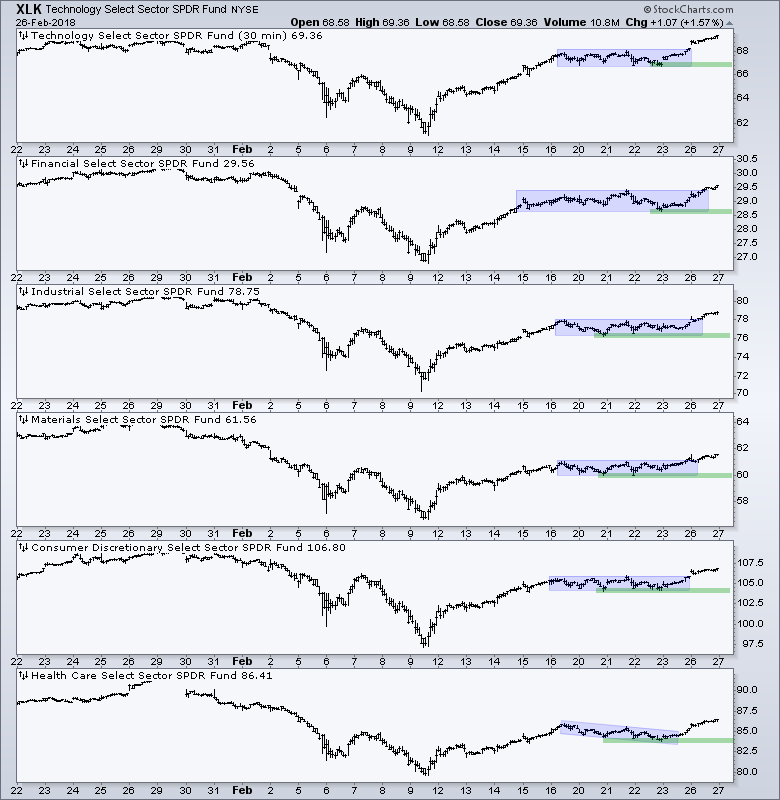
The next chart shows 30-minute bars to highlight the consolidation breakouts in six sectors. This is a follow up to the flags and pennants noted on Friday morning. The blue zones mark consolidations (flags) and all six broke out of these consolidations over the last two days. The green lines mark support from last week's lows to define the uptrend since February 9th. The broader market is in good shape as long as the majority hold support. Support breaks in four of the six would suggest that the broader market is turning. This is not a prediction, but rather something to watch going forward.
Techs and Materials Lead New High List
The next chart shows High-Low Percent for the S&P 500 and the nine sectors within the S&P 500. The sectors are sorted by High-Low Percent with the highest at the top (technology 15.49%) and the lowest at the bottom (utilities 0%).
First, the red shading on S&P 500 High-Low% ($SPXHLP) shows when the indicator remained below +10% for four to five weeks. The S&P 500 corrected from mid-March to mid-April and in August. Currently, the indicator has been below +10% for 18 days and I will remain in the correction camp until this indicator gets back above +10%. Such a move would show broadening participation and this would be bullish.
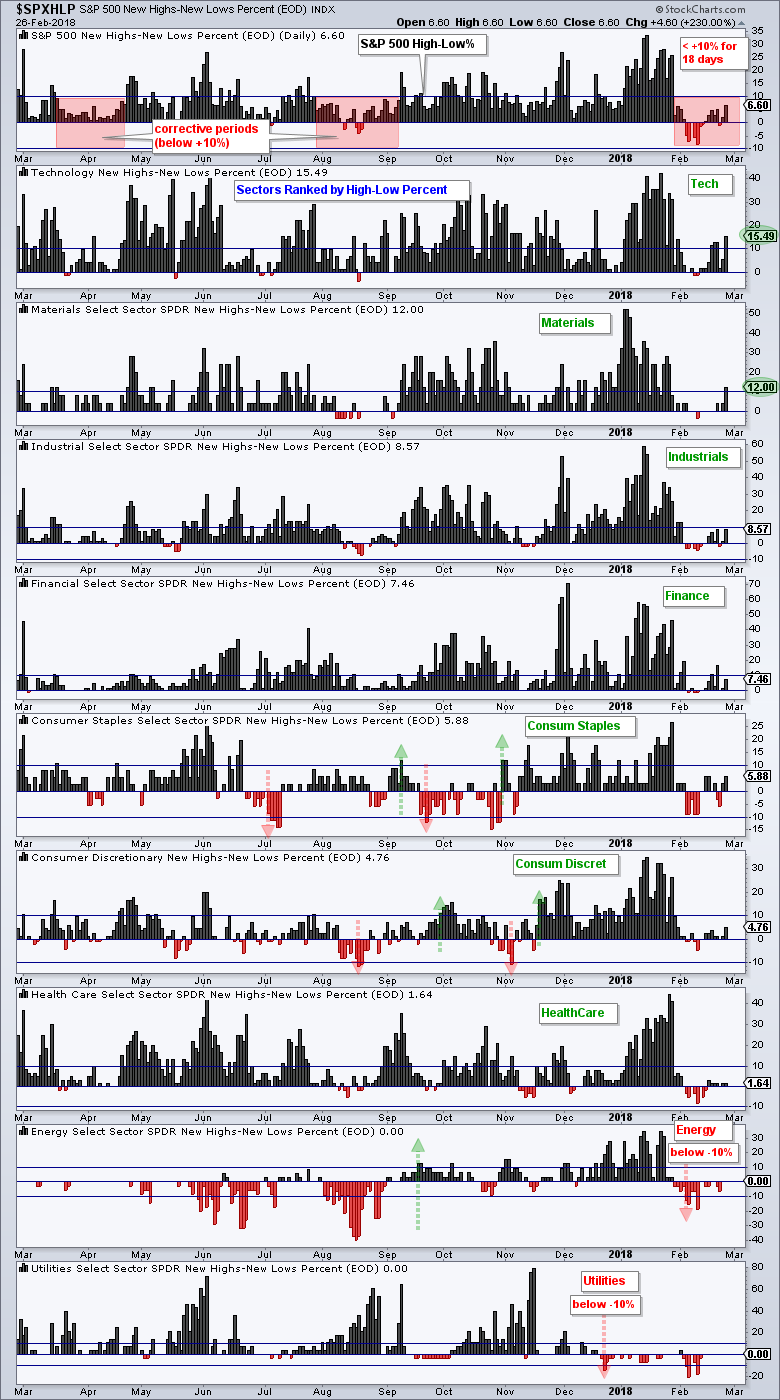
XLK High-Low% ($XLKHLP), XLB High-Low% ($XLBHLP) and XLF High-Low% ($XLFHLP) are the only three that exceeded +10% over the last two weeks. This explains the short-fall in S&P 500 High-Low% and more participation is needed to push the broad market indicator above +10%.
Overall, the +10% and -10% levels are used to trigger signals in these indicators. A move above +10% is bullish until countered with a move below -10%. Eight of the ten sectors are currently on bullish signals. XLE High-Low% ($XLEHLP) and XLU High-Low% ($XLUHLP) triggered bearish signals in February and December, respectively.
The 800-pound Sector in the Market
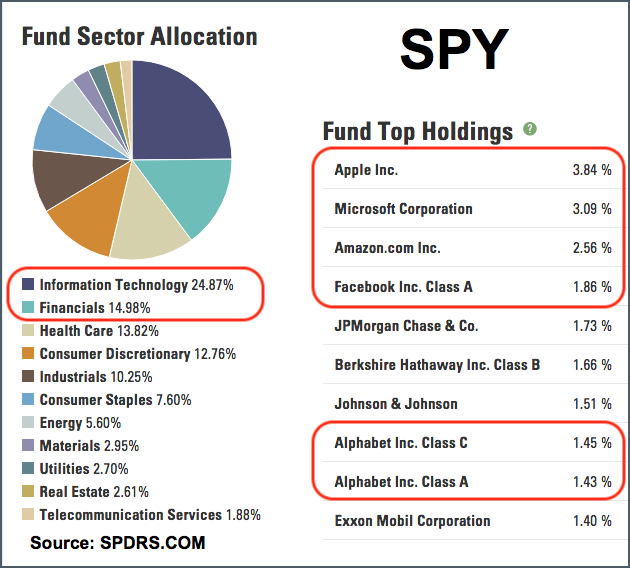
The technology sector is clearly the 800-pound gorilla in the room right now (S&P 500). According to SPDRs.com, the technology sector accounts for around 25% of the S&P 500. Finance is the next biggest sector at 15%. Admittedly, it is hard to imagine the S&P 500 moving lower when its largest sector is near a 52-week high and leading.
The five biggest holdings in SPY are technology-related companies: AAPL (3.84%), MSFT (3.09%), GOOGL (2.88%), AMZN (2.56%) and Facebook (1.86%). Together, these five account for 14.23% of the SPY, which is almost as much as the entire finance sector. Note that these five stocks account for around 45% of QQQ.
Charting the Fab Five (AAPL, GOOGL, FB, AMZN, MSFT)
The next chart shows these five stocks with three levels highlighted. The red lines mark 52-week highs earlier this year, the blue zones mark support from the November-December lows and the green zones mark short-term support for the current upswing.
Amazon is the clear leader because it was the first above the red line and the first to hit a fresh new high. Apple and Microsoft are showing leadership because they are at their highs already. Facebook and Alphabet are the laggards because they remain below their recent highs.
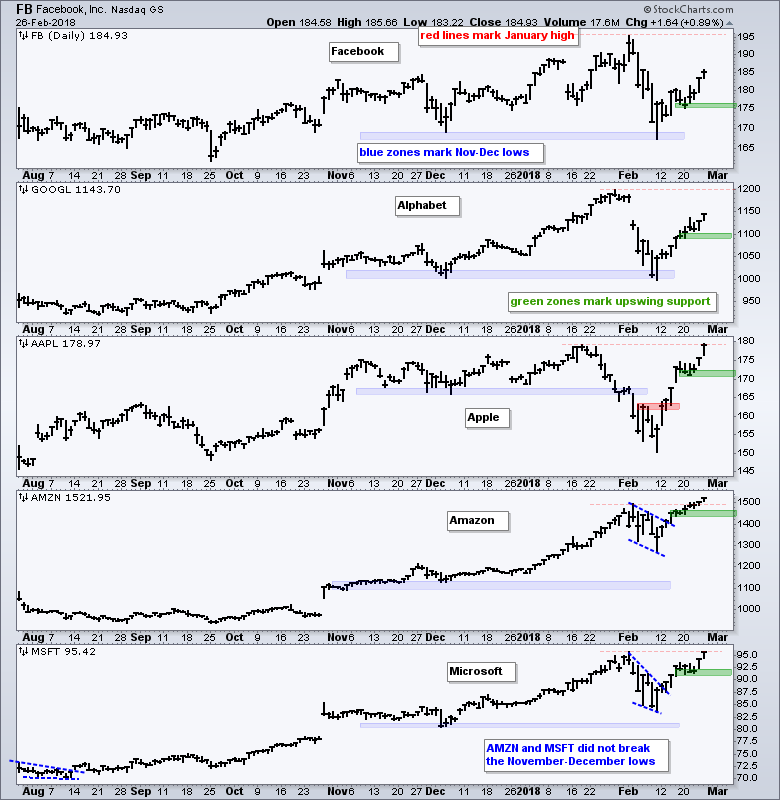 Amazon and Microsoft held up the best during the February pullback because they did not touch or break their November-December lows (blue zones). Alphabet and Facebook tested these lows, while Apple broke below these lows. Apple has fully recovered, but Facebook and Alphabet are still lagging the others.
As with the flags above, the green support zones are based on last week's low. These five remain in clear upswings as long as last week's lows hold. Support breaks by three of the five would be quite negative for the broader market. It hasn't happened yet. Just something to watch going forward.
Retail and Housing Lag
If you are looking for the weak spot, look no further than the Home Construction iShares (ITB). The first chart shows ITB retracing 50-61.8% of its prior advance with a sharp decline to the 39 area.
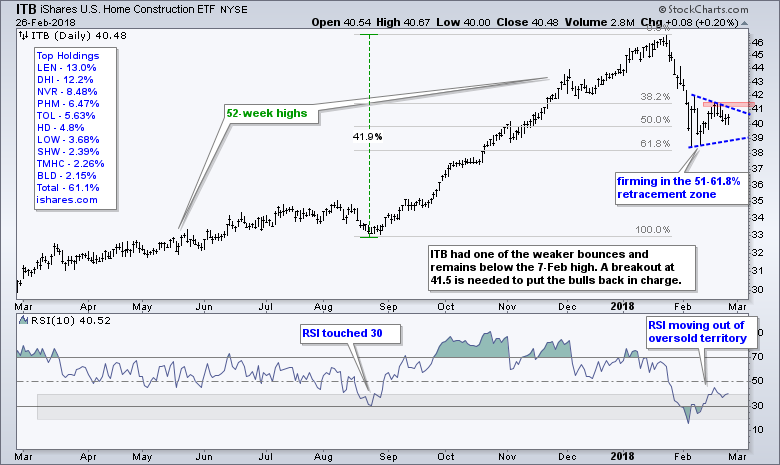
The ETF firmed, but did not take part in the broad market bounce and remains below the 7-February high. A breakout at 41.5 is needed to put this one back on the bullish track. Barring a breakout, a triangle consolidation could be forming and this could be a bearish continuation pattern.
The next chart shows XRT bouncing off the 50-61.8% retracement zone in mid February and moving above 46. The ETF bounced along with the rest of the market over the last two days, but did not exceed last week's high.
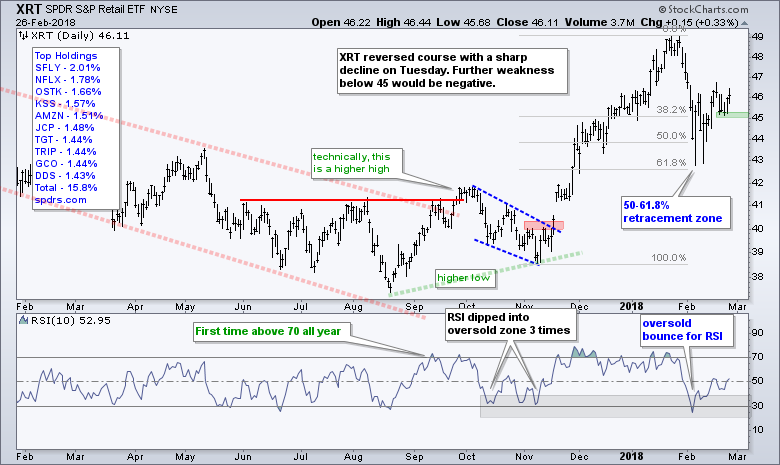
Even though this shows a little relative weakness, the short-term trend is still up with support marked at 45. A break below this level would reverse the short-term uptrend.
Video with a Top Technician
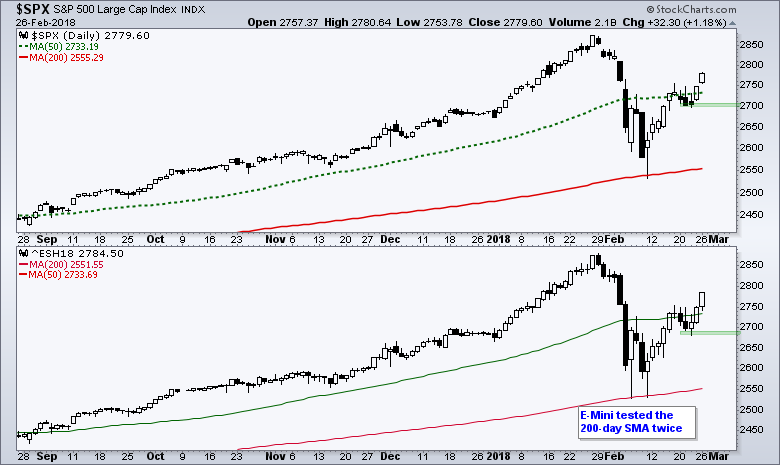
Jonathan Krinsky, MKM Partners chief market technician, discusses two inside weeks, the S&P E-Mini, divergences and more.
Plan Your Trade and Trade Your Plan.
- Arthur Hill, CMT
Senior Technical Analyst, StockCharts.com
Book: Define the Trend and Trade the Trend
Twitter: Follow @ArthurHill


