- Introduction and Overview.
- A Historical Look at the Ratio.
- Put Volume Surges to Multi-year Levels.
- The Eye-Ball Signals.
- Putting Together a System.
- Running the Numbers.
- Conclusions.
 ...The Put-Call Ratio is getting a lot of attention lately so I took a stab at building a trading system around this indicator.
Sentiment indicators are very tricky because sentiment can remain at extremes during trends or panics. For example, the VIX can move to high levels and remain at high levels during an extended decline. Surveys can show excessive bullishness during an uptrend and this uptrend can still continue.
The Put-Call Ratio is one of the more interesting sentiment indicators because it is based on actual trades. In other words, option players are voting with their money. An increase in put volume suggests more bearish bets, more hedging and more fear in the market. An increase in call volume points to more bullish bets, more confidence and more speculation. A put-call ratio below 1 means call volume is higher than put volume. The ratio moves above 1 when put volume exceeds call volume.
The million Dollar question, of course, is: what levels show extreme bearishness or extreme bullishness.
In separte, but related developments, Monday's System Trader article noted that some mean-reversion signals triggered recently and we are in the turn-of-the-month, which is a bullish period.
A Historical Look at the Ratio
Extremes are often moving targets because the range can change over time. The chart below shows the Total Put-Call Ratio ($CPC) since 1996. The top window shows the 50-day SMA and the 250-day SMA (one year average). Notice that these averages were below 1 from 1996 to June 2004. The 250-day SMA did not exceed 1 until the bear market in 2008.
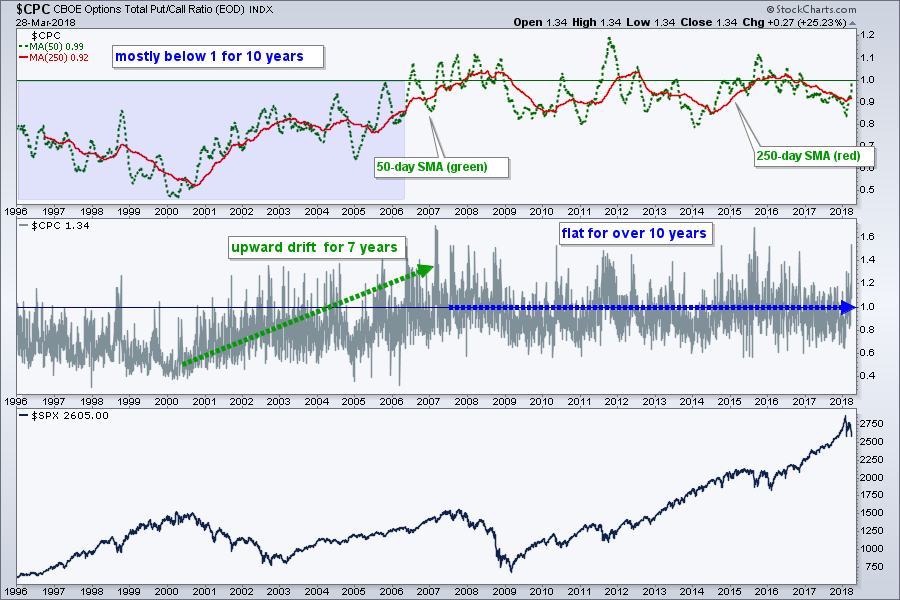 Overall, notice how the Put-Call Ratio drifted higher from 2000 to 2007 (green line) and then leveled off over the last ten years. This changing dynamic makes it a challenge to build a trading system over the last 20 plus years.
Put Volume Surges to Multi-year Levels
There is clearly something going on right now because the Put-Call Ratio surged to its highest level since August 2015 and the 10-day EMA reached its highest level since early November 2016. As far as option players are concerned, we are seeing the most bearishness in well over a year and this means sentiment could be reaching an extreme.
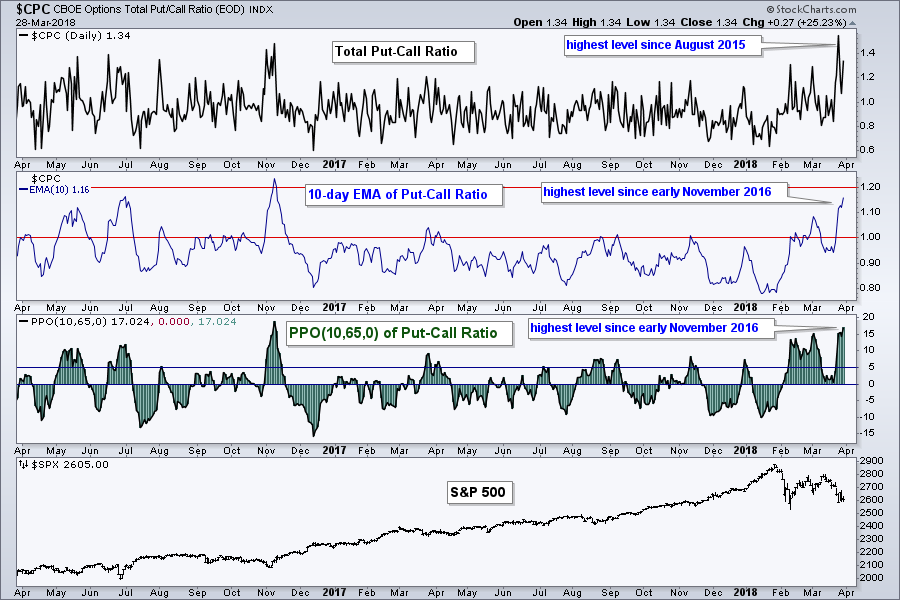
The third window on the chart shows the PPO(10,65,0) for the Put-Call Ratio. This normalizes the ratio by measuring the distance between the 10-day EMA and the 65-day EMA (two week EMA and three month EMA). This normalized version exceeded 15% twice and hit its highest level since early November. This means the 10-day EMA of the Put-Call Ratio was more than 15% above the 65-day EMA.
The Eye-Ball Signals
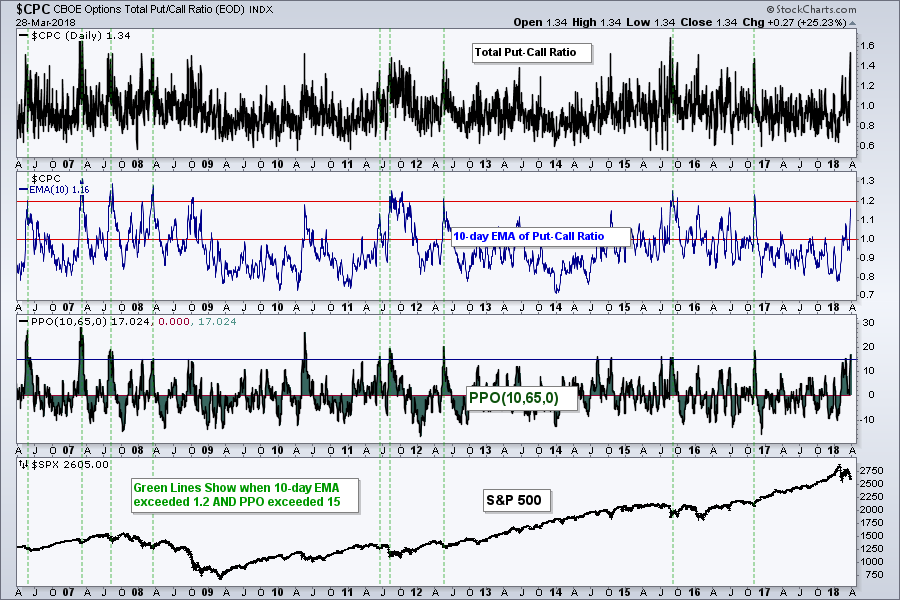
The next chart shows some "eye-ball" extremes, which are signals we see on the chart, but they are not quantified with a backtest. The Put-Call Ratio appears to reach an extreme when the 10-day EMA exceeds 1.2 and/or the PPO(10,65,0) exceeds 15%. The green lines show when both indicators reached extremes.
Putting Together a System
As with the VIX, I am not interested in looking for bearish signals (excessive bullishness). First, the stock market has a long-term upward bias so why fight the big trend. Second, shorting the stock market is usually a losing proposition. In other words, it is much harder to make money and manage risk on the short side. Third, sentiment indicators can hit bullish excesses numerous times during an extended uptrend.
After studying the charts and trying not to curve fit, I came up with a basic system to trade SPY using the PPO of the Put-Call Ratio, %B of SPY and RSI for SPY. Here are the ground rules:
- Trade only when the 50-day EMA of S&P 500 is above 200-day EMA (bull market).
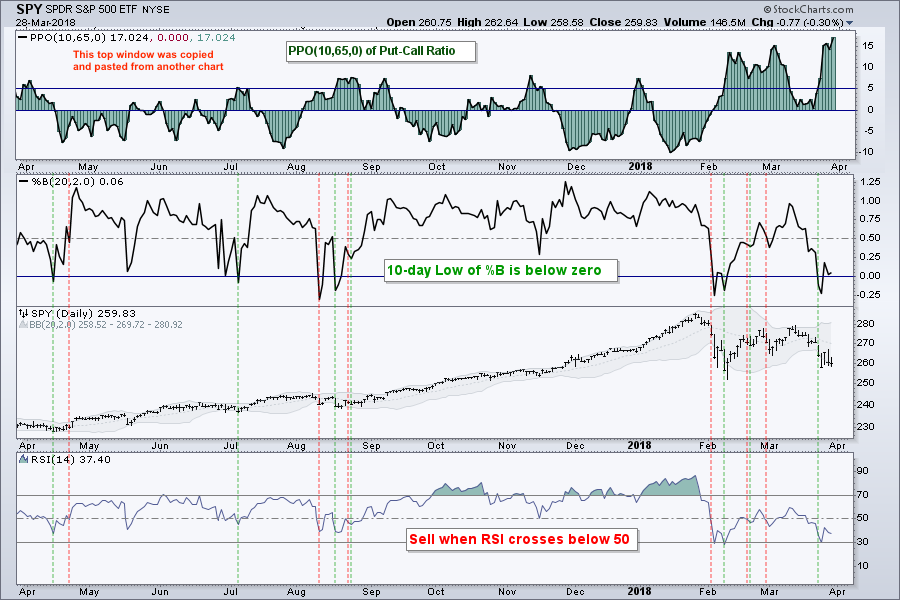
- Buy when 10-day high of Put-Call PPO(10,65,0) is greater than 5 and 10-day low of %B is below zero.
- Sell when RSI crosses below 50
The buy signal is looking for the combination of an elevated Put-Call Ratio and an excessive decline in SPY. The Put-Call ratio is elevated when its PPO(10,65,0) is above 5%, which means the 10-day EMA is more than 5% above the 65-day EMA.
%B turns negative when SPY closes below the lower Bollinger Band. This means the decline in SPY exceeded the 2 standard deviation band and a bounce can be expected (not guaranteed).
RSI(14) is almost always below 50 when the buy signal triggers. The system stays long until RSI crosses below 50, which means it must first move above 50.
The chart below shows a few signals over the past year. The green vertical lines mark the buy signals, while the red vertical lines mark the sell signals (RSI crosses below 50). The very first signal in April triggered because the 10-day high of the PPO was still above 5% when %B moved below zero. This signal resulted in a whipsaw because RSI moved below 50 a few days later.
Running the Numbers
It is funny how a system that looks pleasing to the eye is not quite the same when put through the rigors of a backtest. Computers have a habit of picking up every signal, even the ones the naked eye might miss.
I tested this system from 1996 to 2013 and found two distinct periods. Performance was quite subdued from 1996 to 2011 and outstanding from 2012 to March 2018. This just goes to show how market dynamics change, and change without notice.
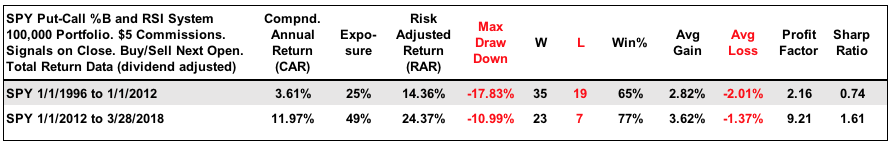
The system does not trade all the time and this is why exposure is relatively low (25% from 1996 to 2011 and 49% from 2012 to the present). Even during the subdued years, the win rate was still 65% and the Compound Annual Return was positive. Thus, there is clearly a positive expectation here and we should take notice when signals trigger.
Conclusions
Regardless of the system tests, it is clear that the Put-Call Ratio is elevated and bearish sentiment is above average. We are still in a bull market because the 50-day EMA of the S&P 500 is above the 200-day EMA. The S&P 500 is also just above its rising 200-day SMA. Thus, system traders are taking signals until the system says stop (bear market).
As noted above, sentiment indicators are tricky so chartists can consider using these with other indicators and signals. In fact, I noted some mean-reversion setups on Monday and we are in the turn-of-the-month, which is a bullish period.
Consulting, Software and Data
Cesar Alvarez of AlvarezQuantTrading.com provides feedback my code and system development. Cesar has a great blog and provides consulting services for system development (click here). I used Amibroker to test the code and Premium Data from Norgate. Just like StockCharts, the data is adjusted for dividends to reflect the total return.
Plan Your Trade and Trade Your Plan.
- Arthur Hill, CMT
Senior Technical Analyst, StockCharts.com
Book: Define the Trend and Trade the Trend
Twitter: Follow @ArthurHill


