- Universe, Market Regime and Ground Rules.
- Know Your Indicators.
- Sample Signals for IJR and QQQ.
- Testing the Big Four.
- Plotting Equity and Drawdowns.
- Testing Four Leveraged ETFs.
- Conclusions and Caveat Emptor!

Introduction and Overview...
Stocks fell sharply the last two weeks and RSI became oversold for most major index ETFs. This makes it an opportune time to review and expand on a mean-reversion trading system.
Before getting started, note that this mean-reversion trading system uses some classic indicators, such as moving averages, RSI and the PPO. Trading systems, however, are very different from technical analysis, especially classical technical analysis.
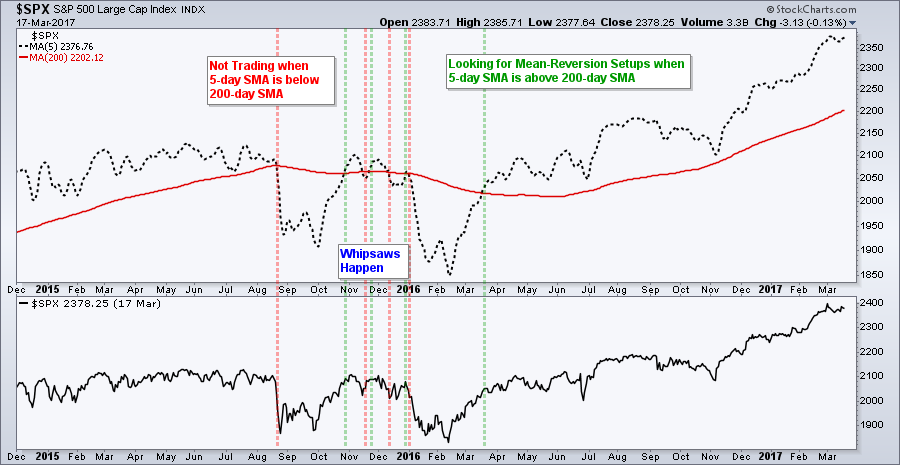
For example, this trading system is not concerned with the lower high in the S&P 500 from January to March. This system has no clue about the VIX and does not care about the breadth tables. It simply uses two moving averages to determine the market regime and takes oversold signals.
The backtest results that I am going to show you are based on hundreds of trades. There is not much curve fitting because I am using a few basic indicators with some basic settings. Before considering tweaks, make sure to check a couple dozen signals over a 10+ year lookback period.
I have been writing about mean-reversion systems since June 2016 and they continue to perform well. I started by testing individual ETFs and then moved to a portfolio approach to spread the risk. I also tested various exit strategies and stop-losses. The links below show four articles for reference.
- A Portfolio Approach to Mean-Reversion Trading
- A Mean-Reversion System with the Chandelier Exit
- Mean Reversion: Catch the Knife or Wait for the Bounce?
- Mean Reversion with the Sector SPDRs
Universe, Market Regime and Ground Rules
I will first run individual tests on SPY, QQQ, MDY and IJR, and then test these as a portfolio of equal-weight positions. I will then test four leveraged ETFs to show how risk increases along with reward.
Here are bullet points for the rules:
-
The market regime must be bullish. This means the 5-day SMA is above the 200-day SMA for the S&P 500.
-
The system buys when 5-day RSI moves above 30, which implies it was below 30 before the buy signal
-
The system sells when one of two things occur: Price crosses below the Chandelier Exit (22,1) and the PPO (12,26,9) is already below its signal line or when price is already below the Chandelier Exit and the PPO crosses below its signal line.
-
The signals are generated on the close and the entry-exit prices are based on the next open.
-
The backtests are based on dividend-adjusted data, which means the dividends were added back into the price data for a total return picture.
-
The starting portfolio is $100,000 and the commissions are $5 per trade.
Know Your Indicators
The indicators used are explained in the ChartSchool. It is IMPERATIVE that you fully understand how these indicators work to fully understand how the system functions. Read, study, repeat.... The PPO article (here) and the Chandelier Exit (here).
Sample Signals for IJR and QQQ
The first chart shows IJR with two completed trades in the last six months. The first was pretty straightforward. A buy signal on November 8th (trade on November 9th) and a sell signal on December 7th (trade on December 8th).
I added the PPO signal line crossover to the sell signal in an attempt to ride the short-term uptrend. Thus, the sell does not trigger until the close is below the Chandelier Exit and the PPO is below its signal line. Note that I am being very careful not to curve fit this system.
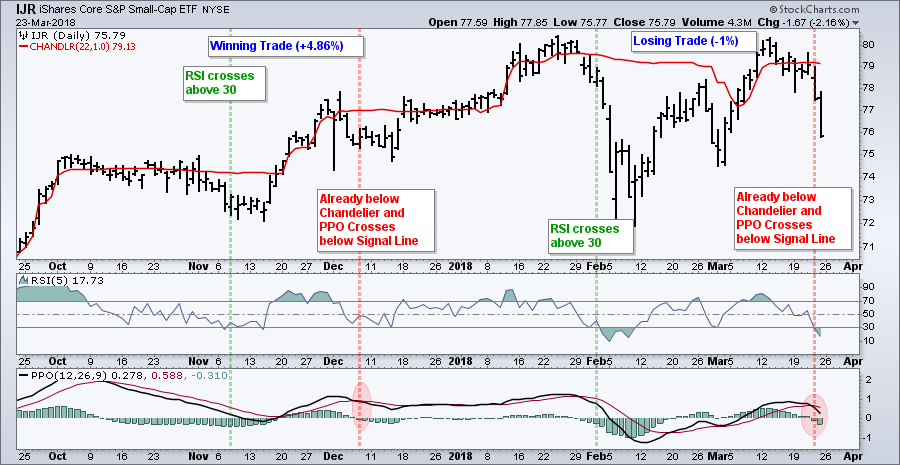
The February 2nd trade is a classic "would you have the nerve" trade. IJR triggered a buy signal on February 1st and then fell over 6%. The system does not have a stop-loss or trailing stop because these hurt overall performance. Yes, you read right.
A sell setup does not materialize until IJR moves above the Chandelier Exit (red line), which will eventually happen. The Chandelier Exit will fall when the 22-day high falls, which occurred in early March. IJR moved above the Chandelier Exit on March 6th and a sell signal triggered on March 22nd (trade on March 23rd).
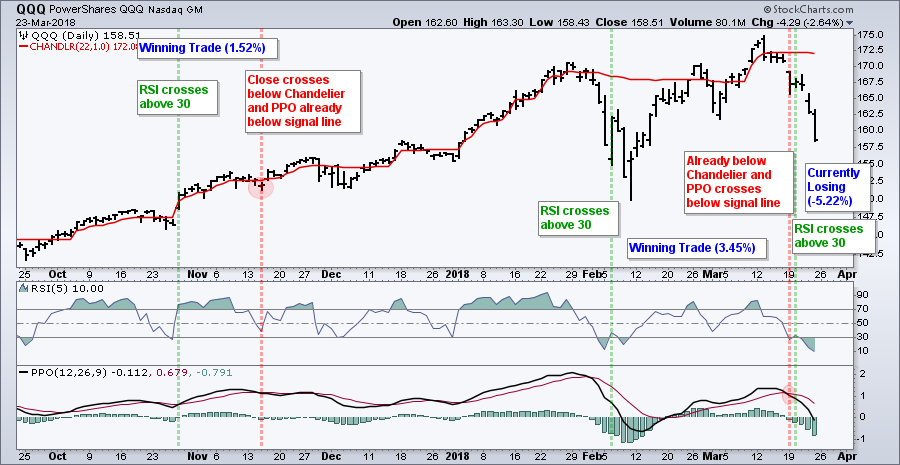
The next chart shows QQQ with two closed trades and a an open trade, which is currently down around 5%. This system is not for the faint-hearted. The sell setup will not materialize until QQQ moves above the Chandelier Exit. Once this happens, a sell signal will not trigger until QQQ closes below the Chandelier Exit and the PPO crosses below its signal line.
Testing the Big Four
The next table shows the results for the four individual ETFs and the portfolio approach. I am testing from July 2001 to March 2018 because this is when all four ETFs were trading. I like this period because it starts in a bear market, includes another bear market and also includes a few volatile periods (May 2010, summer 2011 and summer 2015). The overall results reflect performance throughout different market conditions.
Note that the system was only trading 40% of the time and the win rate averaged 68.4%. The Sharpe Ratio, which is a measure of risk-adjusted return, averaged above 1. The Profit Factor, which is gross profit divided by gross loss, averaged around 4. A Sharpe Ratio above 1 and a Profit Factor above 2 is good.
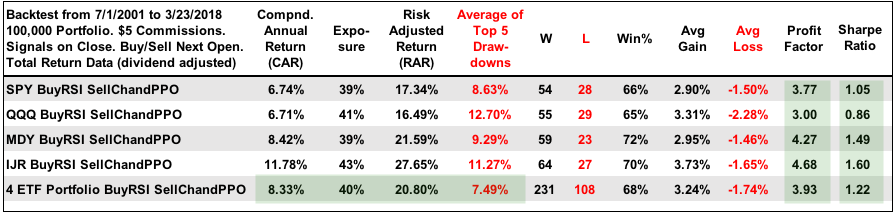
The last line shows the power of the portfolio. The low returns from SPY and QQQ were pushed up by the high returns of IJR and MDY. More importantly, risk was reduced because the Compound Annual Return was greater than the Average Drawdown, which is hard to achieve. The average gain was almost double the average loss and the win rate was around 68%.
Plotting Equity and Drawdowns
The chart below shows the equity line and the drawdowns over the backtest period. Notice how the equity curve flatlined during the bear markets because the system was not trading (red zones).
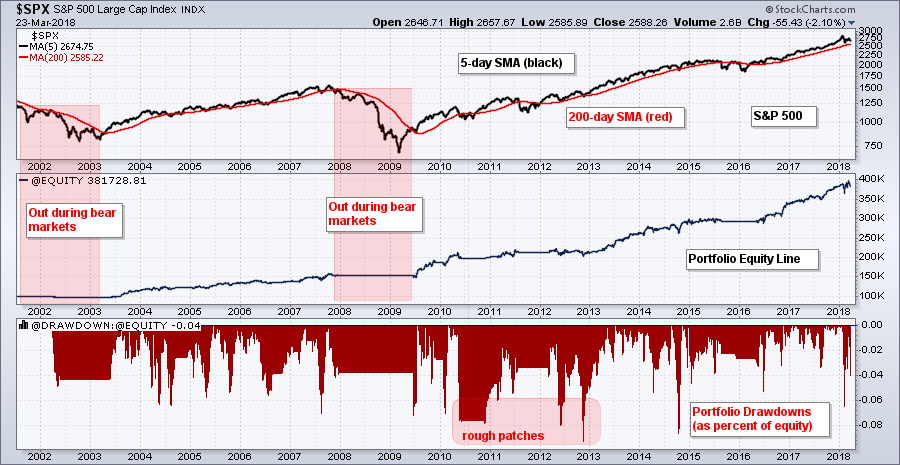
There were some rough patches from mid 2010 to late 2012 as the system experienced seven to nine percent drawdowns. This rough patch was followed by a big run the next two years as equity went from around 200,000 to 300,000 (2013-2014). Needless to say, 2017 was a good year.
Testing Four Leveraged ETFs
The next table shows the results using four leveraged ETFs (SSO, QLD, MVV and SAA). These ETFs have 2X leverage and correspond to the four major index ETFs in the first test. The testing period runs from July 2007 to March 2018, which is six years shorter than the first backtest. I started in July 2007 because this is when all four started trading.
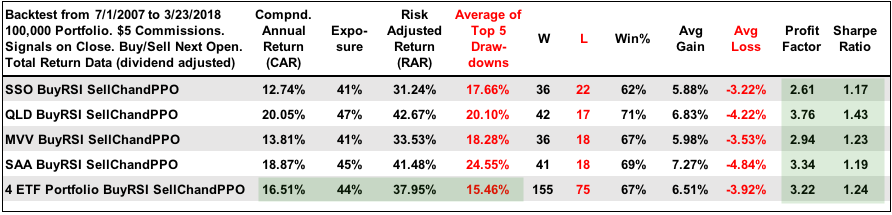
The results are still pretty good, especially when taking a portfolio approach. The exposure is in the low 40% area, the win rate is in the upper 60% range and the average gain is almost twice the average loss. The Compound Annual Return is greater than the Average Drawdown, while the Sharpe Ratio and Profit Factor are strong.
I am not interested in testing ETFs with 3X or 4X leverage. Too much leverage. In addition, I am not interested in testing DIA, IWM or their respective leveraged ETFs (DDM, UWM). The Dow and Russell 2000 are more erratic than their counter parts and do not add much value to the system.
Conclusions and Caveat Emptor!
This system is all about a concept: buying the dips in a long-term uptrend and having an exit strategy. The indicator settings put forth in this particular system work well for the major index ETFs, but probably require some tweaking for sector ETFs, industry group ETFs and individual stocks. The major index ETFs are broad-based and less volatile.
Keep in mind that past results do not guarantee future performance. System results are based on taking every trade without second guessing. You are welcome to tweak the system, but remember the law of unintended consequences. A tweak might help a few trades, but it may hurt more trades than it actually helps when looking at 100+ trades.
Even though this is a short-term mean-reversion system, this type of strategy could also be used to build a position in the broader market. For example, one could scale-in during pullbacks and exit the market when the 5-day SMA for the S&P 500 crosses below the 200-day SMA.
Consulting, Software and Data
Cesar Alvarez of AlvarezQuantTrading.com provides feedback my code and system development. Cesar has a great blog and provides consulting services for system development (click here). I used Amibroker to test the code and Premium Data from Norgate. Just like StockCharts, the data is adjusted for dividends to reflect the total return.
Plan Your Trade and Trade Your Plan.
- Arthur Hill, CMT
Senior Technical Analyst, StockCharts.com
Book: Define the Trend and Trade the Trend
Twitter: Follow @ArthurHill


