- The 2018 Roller Coaster Continues.
- High-Low Line Turns Down for XLY.
- SPY Leads the Wedge Break Downs.
- XLF, XLV, XLY and XLB Break Wedge Lines.
- When Oversold is Not Such an Opportunity.
- XLI Breaks Triangle Support.
- Breakaway Gaps for XLK.
- Gold Bounces off Support Zone.
- Oil Holds Breakout.
- Notes from the Art's Charts ChartList.

The stock market continued its roller coaster ride with a sharp downswing the last nine days (12 to 22 March). The S&P 500, Dow Industrials and Nasdaq 100 lost more than five percent, while the S&P Mid-Cap 400 and S&P Small-Cap 600 fell 3.76% and 2.77%, respectively.
The Performance SharpChart below shows year-to-date performance for these five indexes and three are back in negative territory. The Dow Industrials (red) was the first back to negative territory with a move below the zero line on Monday, while the S&P 500 (black) and S&P Mid-Cap 400 (blue) followed suit on Thursday. The S&P Small-Cap 600 and Nasdaq 100 remain positive year-to-date.
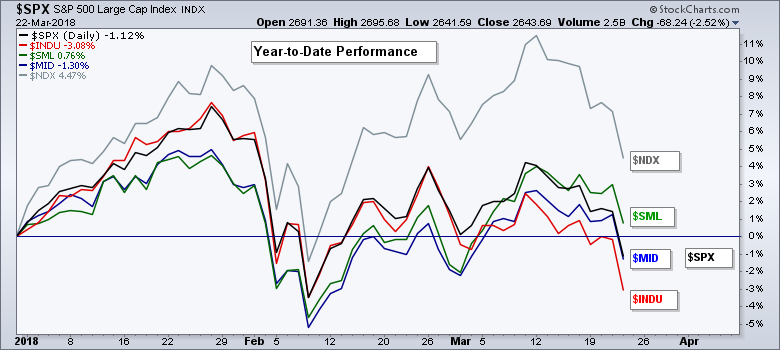
Chartists can read this performance two ways: large-caps ($SPX and $INDU) are leading the way lower or small-caps are showing relative strength. Personally, I think absolute and relative weakness in large-caps is more negative than relative strength in small-caps. Keep in mind that the S&P 500 accounts for some 80% of the total investable US equity market. Small-caps account for less than 10%.
High-Low Line Turns Down for XLY
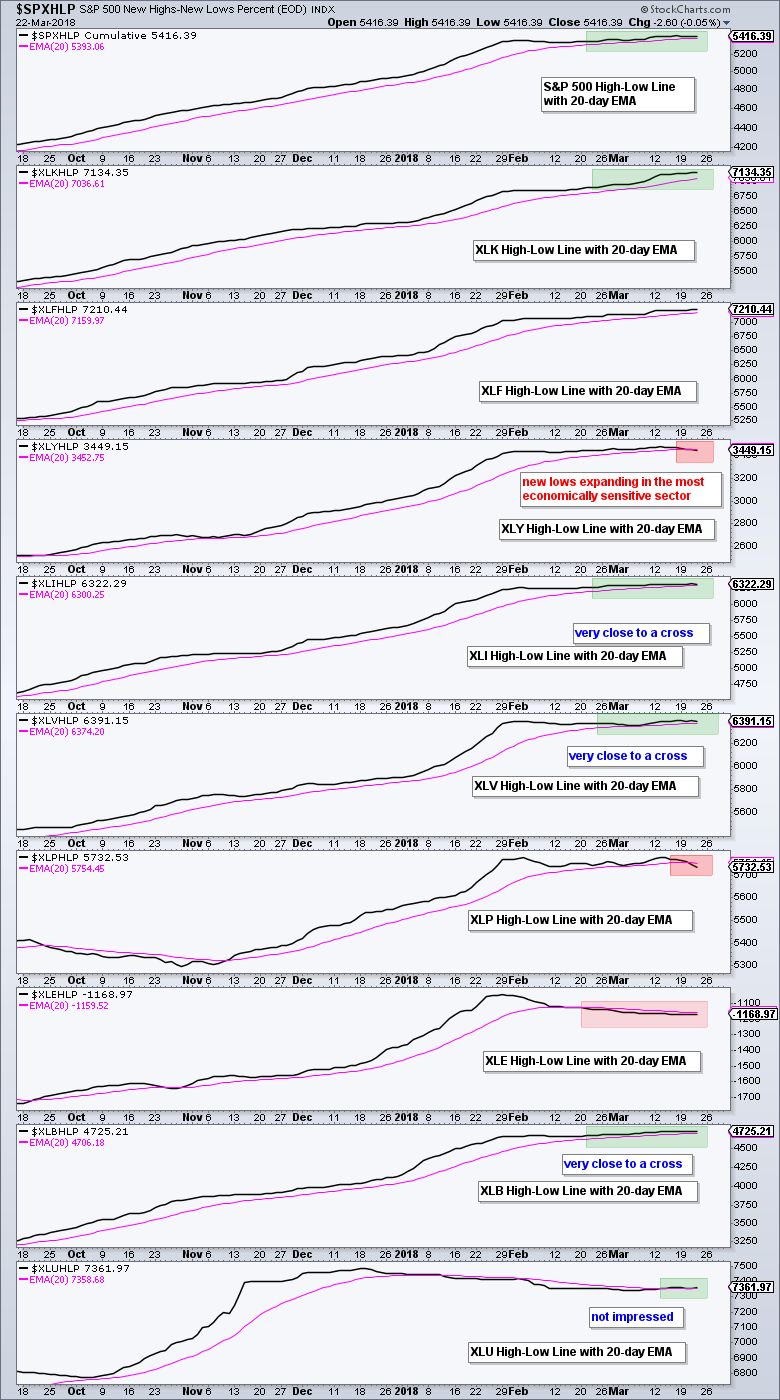
Programming Note: I will update the broad market and sector breadth table on Saturday because I would like to see Friday's data. For now, the chart below shows the High-Low Lines for the S&P 500 and the nine sectors. As far as the broader market is concerned, I am really only interested in the top five sectors, which account for over 70% of the S&P 500 and are shown in the top five windows.
Four of the five lines are still above their 20-day EMA, but the Consumer Discretionary High-Low Line moved below its 20-day EMA. This is the most economically sensitive sector and weakness here does not bode well. The bulk of the evidence turns bearish when/if two more High-Low Lines join the consumer discretionary sector with downturns. Industrials and healthcare are pretty close.
SPY Leads the Wedge Break Downs
The next chart shows the Equal-Weight S&P 500 ETF (RSP), the S&P 500 SPDR (SPY), the S&P MidCap SPDR (MDY) and the S&P SmallCap iShares (IJR). These four represent the lion's share of the stock market: SPY for large-caps, RSP for the average stock in the S&P 500, MDY for mid-caps and IJR for small-caps.
As far as I am concerned, the top two (RSP and SPY) are enough for a broad market assessment. Actually, SPY alone is enough for a broad market assessment. Notice that the EW S&P 500 ETF and SPY fell 10%, bounced with rising wedges, peaked below the January high and broke the wedge lines. These two also closed below the early March low and this means lower lows also formed. The big trend could be turning down here.
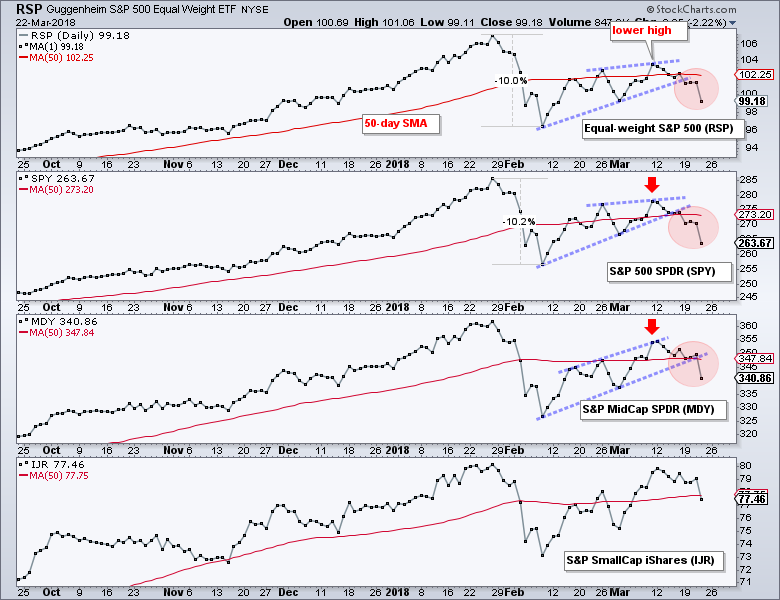
The third window shows MDY making it closer to the January high, but still falling short and breaking down on Thursday. The lower window shows IJR almost reaching its January high and then turning down. Perhaps IJR is forming a double top, but this is a moot point because SPY and RSP already broke down. IJR is not going to buck the big boys.
XLF, XLV, XLY and XLB Break Wedge Lines
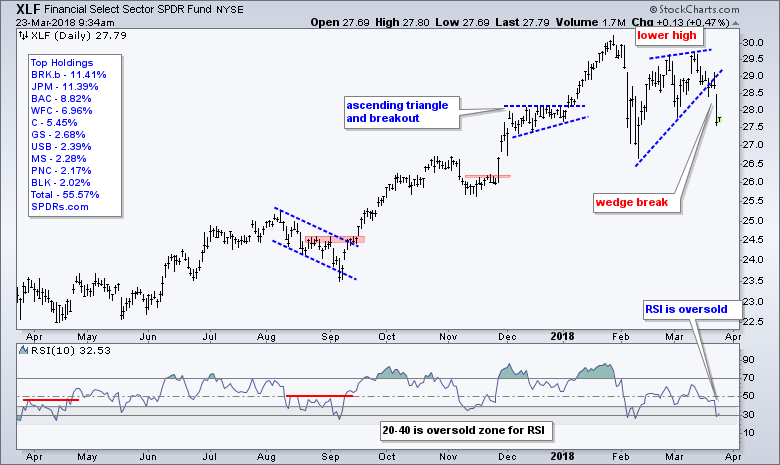
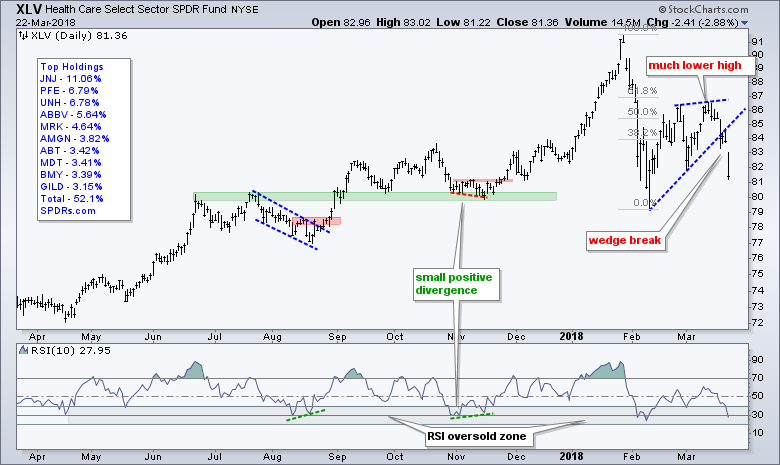
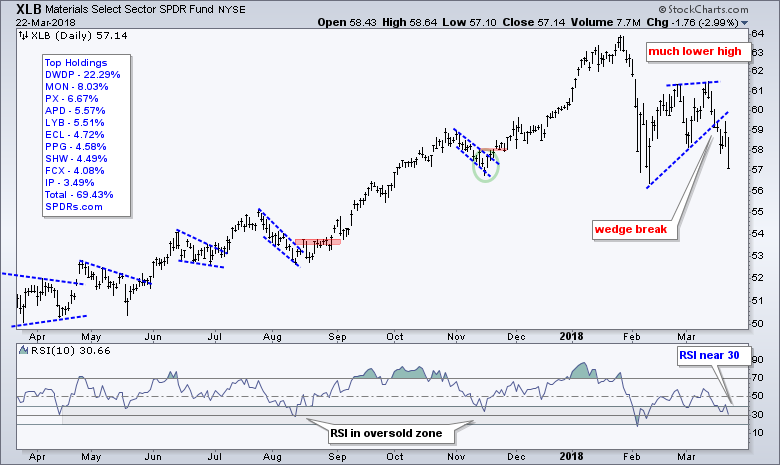
The next four charts show lower highs and wedge breaks in the Financials SPDR (XLF), Health Care SPDR (XLV), Consumer Discretionary SPDR (XLY) and Materials SPDR (XLB). These four also formed lower highs. As noted above, the rising wedge is typical for a corrective bounce after a decline. These wedge breaks signal a continuation of the prior declines and project a move below the prior low. The projection is not what is important because targets are just guesstimates. The wedge breaks are important and in force until proven otherwise.
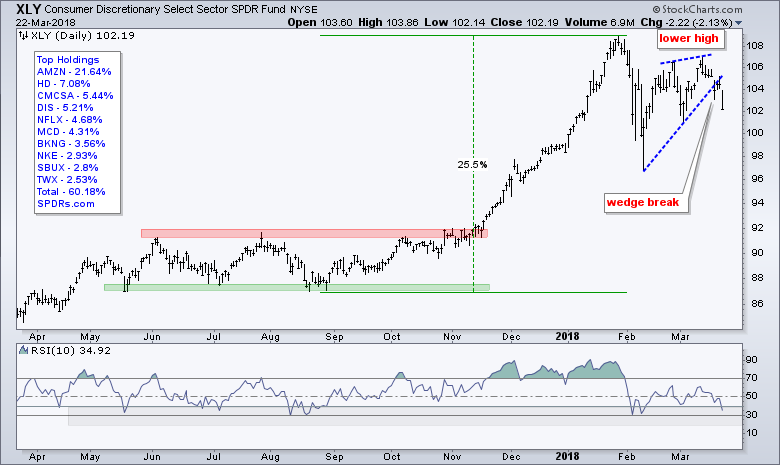
When Oversold is Not Such an Opportunity
I left 10-period RSI on these charts because many ETFs are short-term oversold or becoming short-term oversold after sharp declines. These oversold conditions could give way to a bounce in the next few days.
Overall, I do not think market conditions are favorable for playing the oversold bounce. "Thinking" is the key word here and this is a subjective assessment, as opposed to a systematic approach. Several major index ETFs and sectors formed lower highs from January to March and broke down this week. This points to the possibility of a bigger downtrend emerging and this could limit oversold bounces.
There are two types of oversold signals from RSI. The first is when a price decline pushes RSI to the 30 area, give or take a few points, and prices quickly rebound. The second is when a price decline pushes RSI below 30 and prices stay weak, thus keeping RSI in the 30-60 range for a few weeks. This second alternative looks more like a possibility now. The market is unstable and needs some time to stabilize.
The lows in August-September 2015 and January-February 2016 provide an example of RSI doing the double dip as the market took time to stabilize. Actually, RSI formed bullish failure swings as well. A bullish failure swing is independent of price and does not require a bullish divergence. The failure swing forms when RSI dips below 30, bounces, falls back, holds above 30 and then breaks above its prior peak.
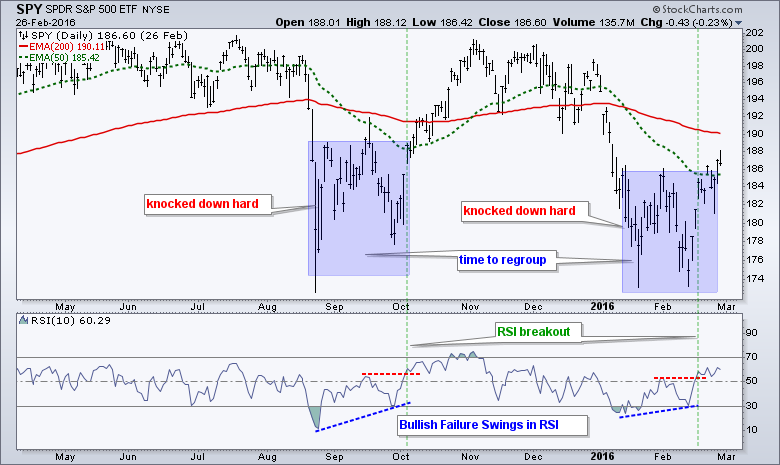
The chart above shows SPY getting hit hard twice, taking time to regroup and then breaking out. The market is getting hit hard again right now and will need some time to regroup when this knockdown is complete. I am not sure when or where it will complete, but we are likely to see some violent swings as the market attempts to bounce and fails.
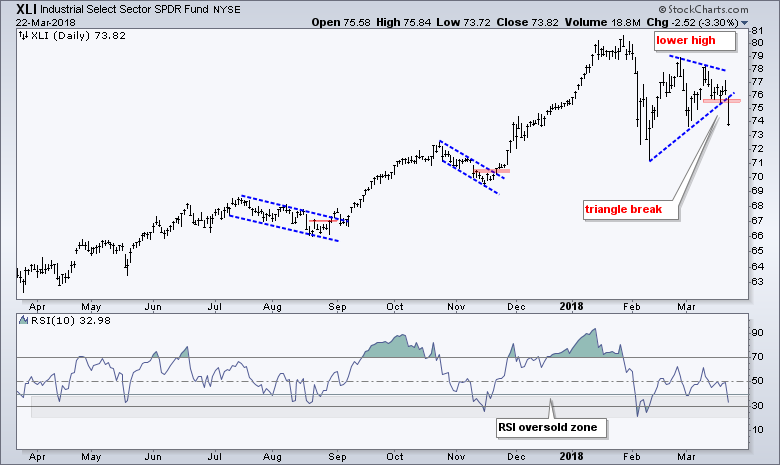
XLI Breaks Triangle Support
The Industrials SPDR (XLI) formed a triangle instead of a wedge. The triangle actually shows less strength than the wedge because a lower high formed from late February to early March. XLI broke the triangle line with a gap and sharp decline on Thursday. This signals a continuation of the prior decline.
Breakaway Gaps for XLK
The five sector SPDRs just shown account for 55% of the S&P 500 and they look pretty bearish after their breakdowns. The Technology SPDR (XLK) is, of course, still the 800 pound gorilla in the room because it accounts for around 27% of the S&P 500. Note that I included telecom because the three telecom stocks (T, VZ and CTL) are part of XLK.
The chart shows XLK hitting a new high two weeks ago and then falling 6% the last nine days. XLK fell over 10% in nine days in February and this is the second sharp decline in as many months. It is not enough to turn long-term bearish on XLK because the ETF just hit a new high and remains well above the February low.
The top right part of the chart shows two breakaway gaps. Well, the first is part of an island reversal and the second may be a continuation pattern because the decline was already underway. Note that several tech-related ETFs also formed breakaway gaps on Monday (FDN, SKYY, HACK, IGV).

These gaps are short-term negative and part of the short-term downtrend, but the long-term trend for XLK is still up. I am not going to speculate on the next support level because this would be a guess. All I really know is that the short-term trend is down and the long-term trend is up. I will take it one day/bar at a time.
Gold Bounces off Support Zone
I featured gold and the Gold Miners ETF (GDX) on Wednesday and not much has changed. Gold looks bullish and GDX looks weak. GLD hit a new high with the surge to 129 and then fell back with a falling channel or flag. The long-term trend is up and this channel/flag looks like a correction after a sharp advance.
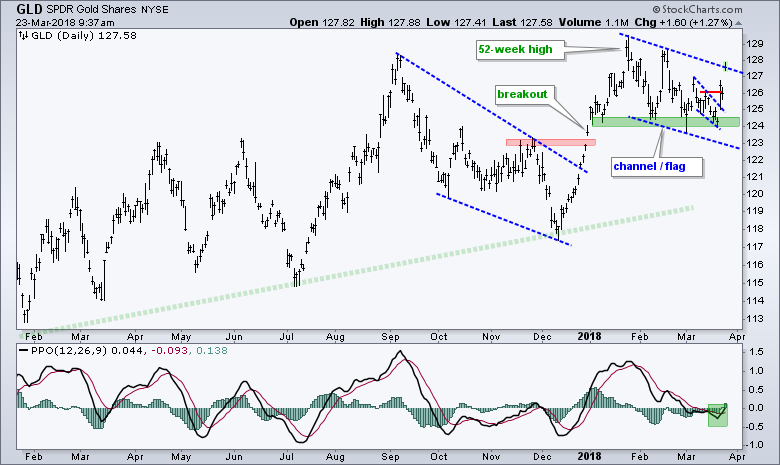
We have yet to see a channel breakout, but GLD bounced off support in the 124 area for the third time in two months. The ETF broke the wedge line and exceeded the 13-March high. MACD also turned and moved above its signal line. I will take these signs as bullish as long as GLD holds above 124.
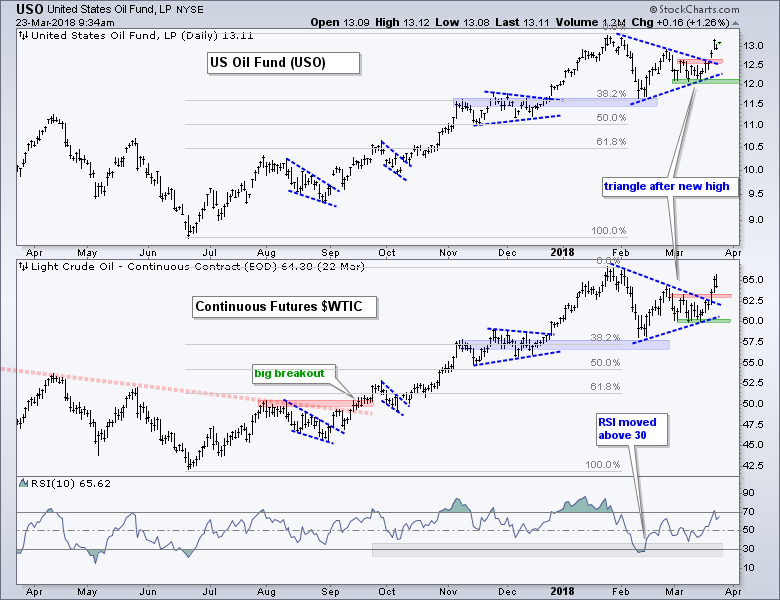
Oil Holds Breakout
I covered oil on Tuesday and the triangle breakout is holding. The Oil & Gas Equip & Services SPDR (XES) and the Energy SPDR (XLE) remain weak though and their charts are another story. Given the stock market environment and underperformance in XES, I would keep an eye on the breakout zone for signs of failure. This means a close below 12.5 in USO and 62 in $WTIC would call for a re-evaluation.
Notes from the Art's Charts ChartList
- The Retail SPDR (XRT) broke the triangle line this week and moved below its early March low. This key group shows relative and absolute weakness.
- The tech-related ETFs (SKYY, FDN, HACK, IGN and IGV) fell back from 52-week highs and gapped down on Monday. These breakaway gaps are short-term bearish, but the bigger trend is up and I will go on alert if/when RSI(10) approaches the 30 area.
- The Broker-Dealer iShares (IAI) and Regional Bank SPDR (KRE) hit new highs two weeks ago and then fell back. KRE is already getting oversold because its pullback has been deeper.
- The iShares Aerospace & Defense ETF (ITA) was not immune to selling pressure as it fell sharply on Thursday. The big trend is up with a small triangle possible. RSI could move into the oversold zone soon so I will remain on alert.
- The Transport iShares (IYT) was lagging because it fell well short of its January high. The ETF broke the wedge line and short-term support with a sharp decline on Thursday.
- The Biotech iShares (IBB) is weighed down by large-caps. The Biotech SPDR (XBI) has smaller stocks and is performing much better.
- The Medical Devices ETF (IHI) led the surge from early February to early March, and then fell back the last two weeks. I still want this one on my radar for a pullback and will watch when RSI moves to the 30 area.
- There is still something not-quite-right with the Oil & Gas Equip & Services SPDR (XES). Oil surged 5% the last five days and is above $60. XES is battling to hold above the August low and formed a higher low. Watch 16 for a breakout.
- The Agribusiness ETF (MOO) formed a lower high and broke the wedge line. Even though RSI moved into the oversold zone, this one could have further to correct.
- The Metals & Mining SPDR (XME) formed lower highs in Feb-Mar and the Steel ETF (SLX) could be forming a double top. These two are weighing on the materials sector.
Plan Your Trade and Trade Your Plan.
- Arthur Hill, CMT
Senior Technical Analyst, StockCharts.com
Book: Define the Trend and Trade the Trend
Twitter: Follow @ArthurHill


