- QQQ Holds Gap for Three Days.
- SPY Holds Wedge Break.
- Charting the Fab Five.
- MMM and Honeywell Join Dow Triangulation.
 QQQ Traps Traders on the Island ...
QQQ formed an island reversal with Monday's gap down and held this gap for three days. Chartists sometimes apply time filters to signals to help reduce whipsaws. Island reversals form with a gap up and gap down in the same price zone. Price action between the gaps creates the island. In theory, traders going long on the island are trapped with losses after the gap down.
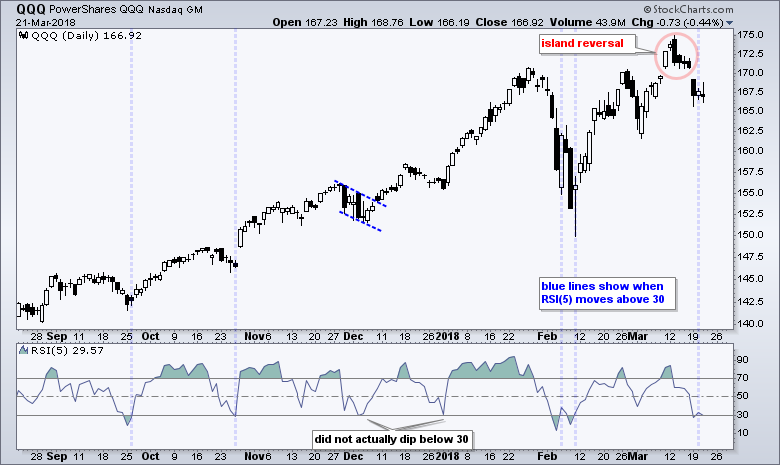
Island reversals can be found in many technical analysis books, but I do not know how reliable the pattern is because I have not tested it. In addition, I am usually not on the lookout for bearish patterns after a 52-week high. Keep in mind that QQQ recorded a 52-week high in mid-March and the long-term trend is still up. This suggests that the decline over the last seven days is a pullback within a bigger uptrend.
SPY Holds Wedge Break
Even though QQQ recorded a 52-week high, SPY did not and could be forming a lower high. The next chart shows SPY breaking the wedge line and erasing the gap-surge on March 9th (employment report). The wedge lines are based on closing prices, which is why they cut through the candlesticks. SPY closed below the wedge line and filled the 9-March gap to reverse the upswing that started in early February.
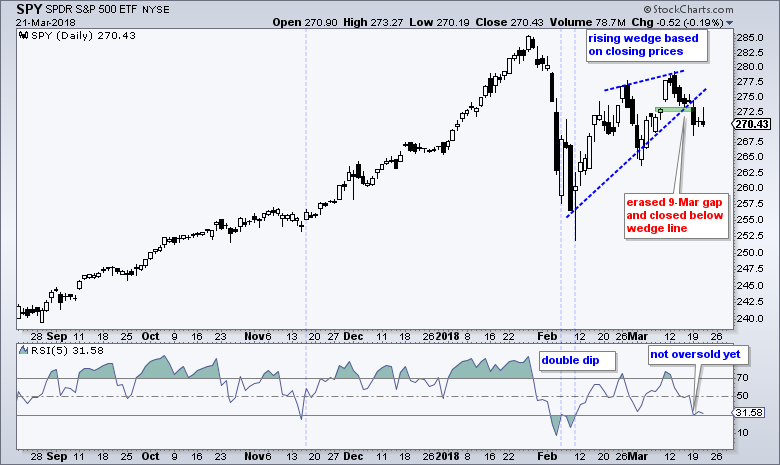 With this wedge break, it also appears that SPY formed a lower high from January to March. Thus, it looks like SPY is poised to continue its February decline. I am not going to speculate on the next support level or how far SPY might decline. This is the realm of the unknown and a predicting the future is futile. The wedge break is bearish right now and should be treated as such until proven otherwise.
Charting the Fab Five
The next chart shows the Fab Five over the last seven months. There are two benchmark levels I am using to compare these stocks: the late January high (red dashed line) and the early March low (green dashed line). I would award +2 to stocks that exceeded the January high because this is a 52-week high (-2 to those that fell short). I would award -1 to stocks that broke the early March low because this is a short-term support level (+1 to those that held).
First, Facebook did not come close to its January high and was the first to break the March low. The green line marks the closing lows in late October, early December and mid February, and the stock broke this support level as well.
The Facebook chart is broken and I am not interested in looking for a bottom. Chartists interested in longs should look elsewhere because there are better looking charts out there.
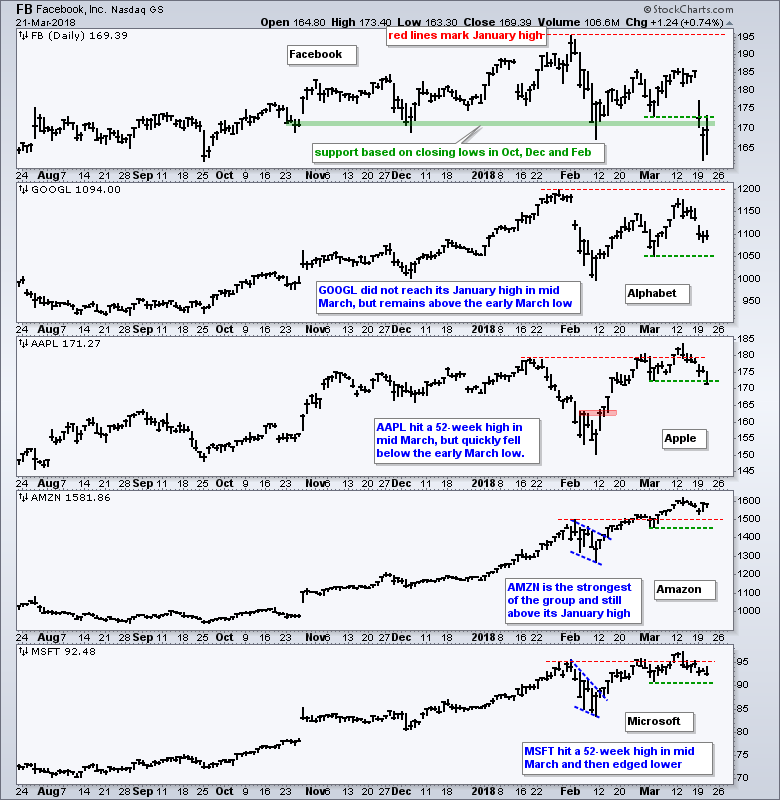 AMZN and MSFT are the strongest because both exceeded their January highs and have yet to break their March lows. These are the two I would focus on should we see a broad market pullback. GOOGL and APPL are in the middle. GOOGL did not exceed its January high, but held above its March low. APPL exceeded its January high, but broke its March low. Overall two of the five broke their March low so I am watching for the next one to break its March low and tip the balance.
MMM and Honeywell Join Dow Triangulation
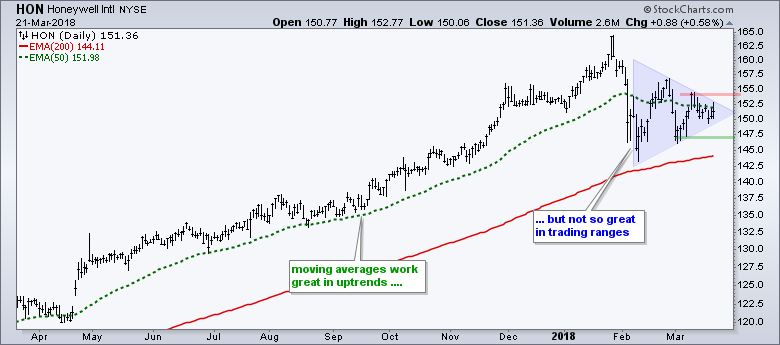
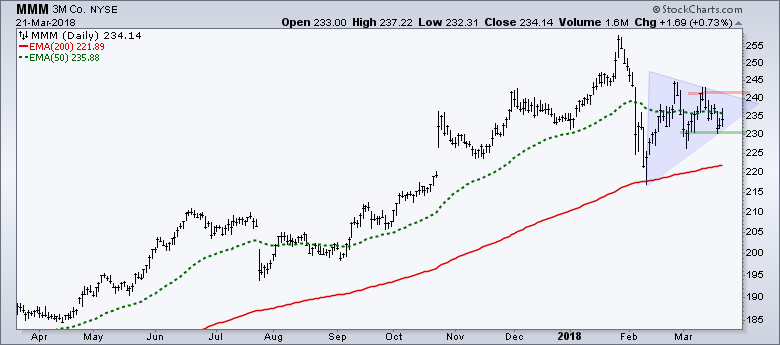
The Dow Industrials coiled up the last two months and is currently testing triangle support, which was put forth in ChartWatchers on Saturday. Dow component 3M (MMM) and big industrial Honeywell (HON) are also triangulating and we should watch these two for clues on the Industrials SPDR (XLI).
The first chart shows HON with a narrowing range the last six weeks. This is basically a big consolidation after the sharp decline in early February. The green line marks the early March closing low for support, while the red line marks the mid-March closing high for resistance. Watch these levels for the pattern break.
 The second chart shows MMM with a similar setup. I am using the closing levels for support-resistance because the close is the single most important price point on the chart. I am also an end-of-day (EOD) kind of guy. Thus, a close above resistance would be bullish, while a close below support would be bearish.
Plan Your Trade and Trade Your Plan.
- Arthur Hill, CMT
Senior Technical Analyst, StockCharts.com
Book: Define the Trend and Trade the Trend
Twitter: Follow @ArthurHill


