- A Narrowing Range for the S&P 500.
- A Bearish Pennant or Higher Low?
- Not Always the End of the World.
- Three Industry Group ETFs to Watch (ITA, ITB, IAI).
- Energy ETFs Continue Consolidation.
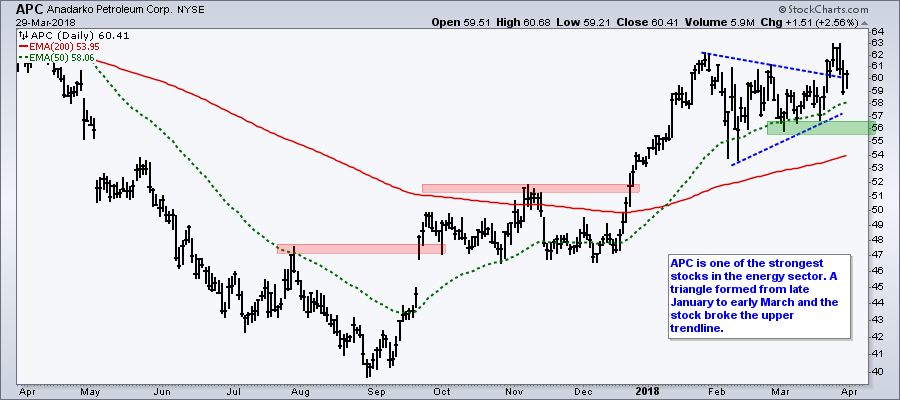
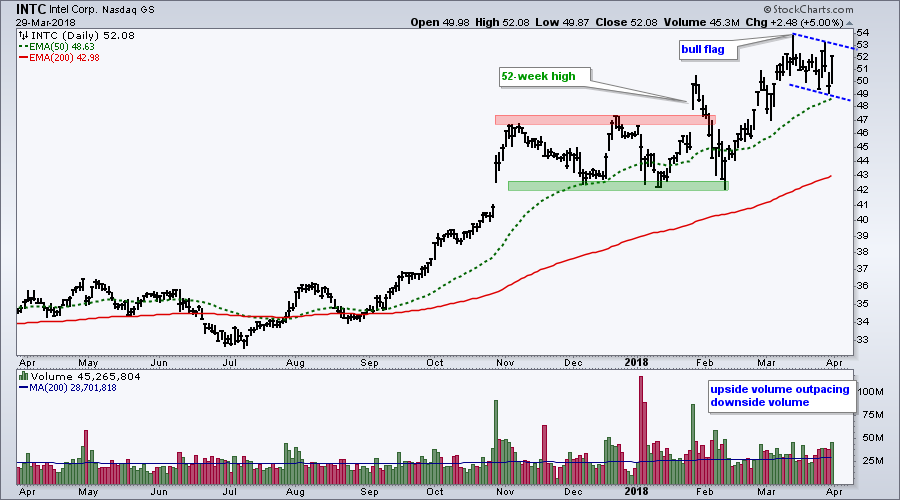
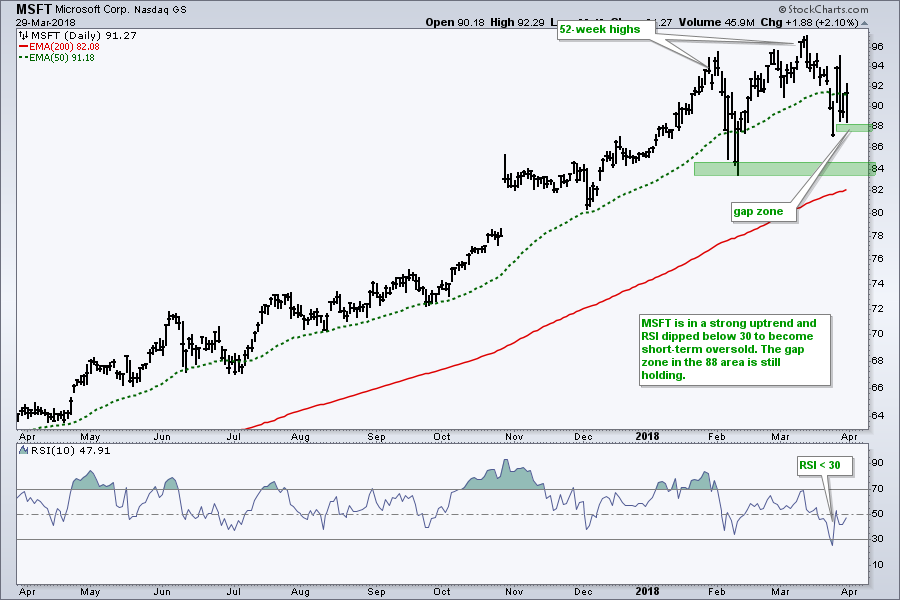
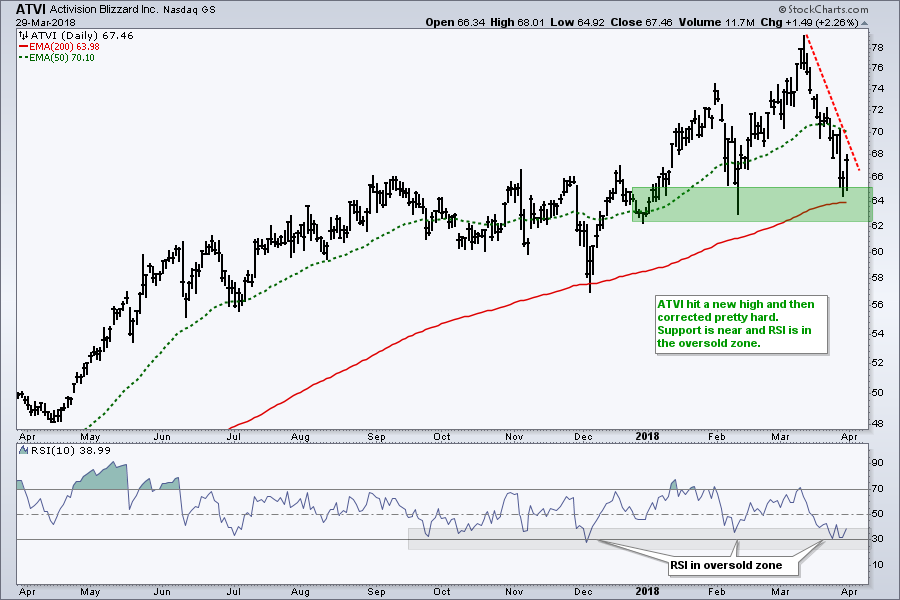
- Stocks to Watch (APC, HAL, MSFT, INTC, ATVI).
 A Narrowing Range for the S&P 500 ...
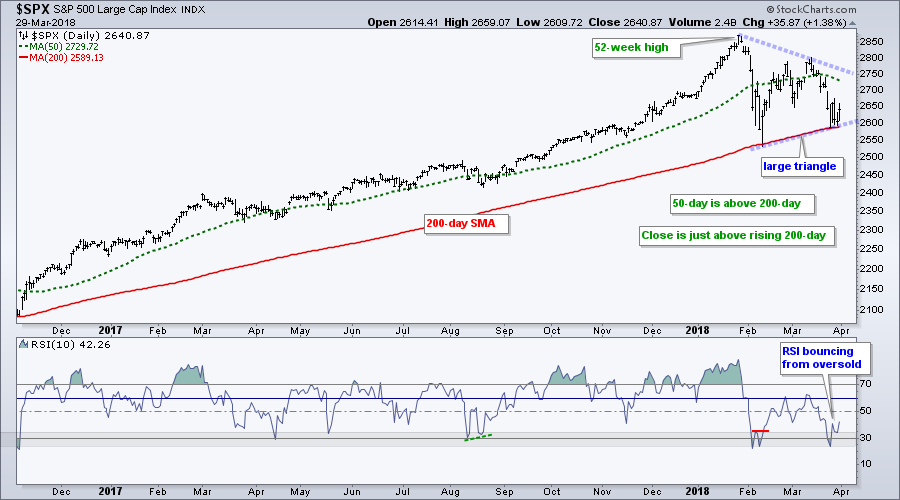
The broad market environment remains tricky because the S&P 500 is in a large trading range this year. As noted in the Weekly Market Review & Outlook, the index is consolidating after a big run from November 2016 to January 2018. I will review Friday's charts for $SPX and SPY, and then move on to some other charts.
The range extends around 350 points or 13% of the mid-point (~2700). This range may be narrowing with a lower high in mid-March and a potential higher low in late March. Also notice that the index is testing the 200-day SMA for the second time in as many months.
A Bearish Pennant or Higher Low?
There are three swings within this large triangle and the current swing is down. The chart below shows SPY and the E-mini stalling last week with a possible pennant taking shape. These are short-term continuation patterns and a break below Wednesday's low would signal a continuation of the prior decline, which extended from March 13th to 32rd.
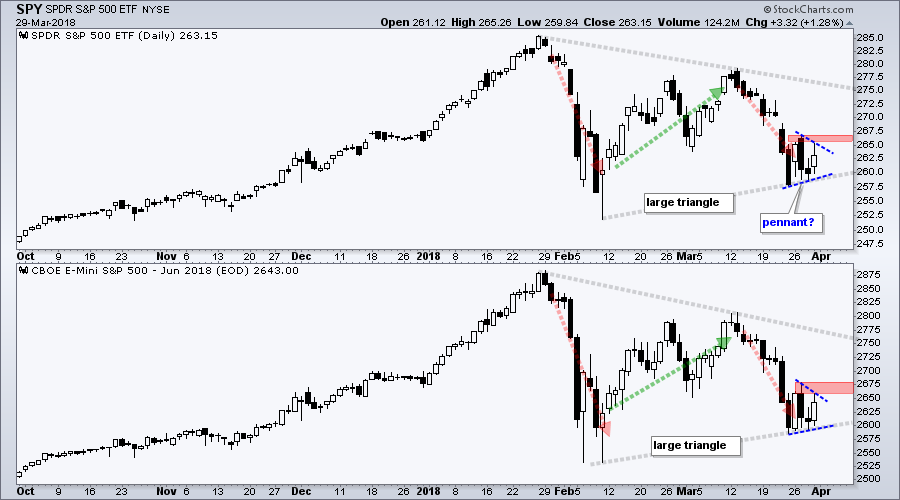
The red resistance zone defines resistance for the current downswing. Chartists looking for an upturn in the broader market can watch this level for a short-term breakout. Such a breakout would argue for a challenge to triangle resistance and could lead to an even bigger breakout.
Not Always the End of the World
What happens if the S&P 500 breaks the 200-day SMA and the February low? I do not want to speculate on something that has yet to occur, but a look at 2015-2016 shows that a lower low and death-cross are not always the end of the world.
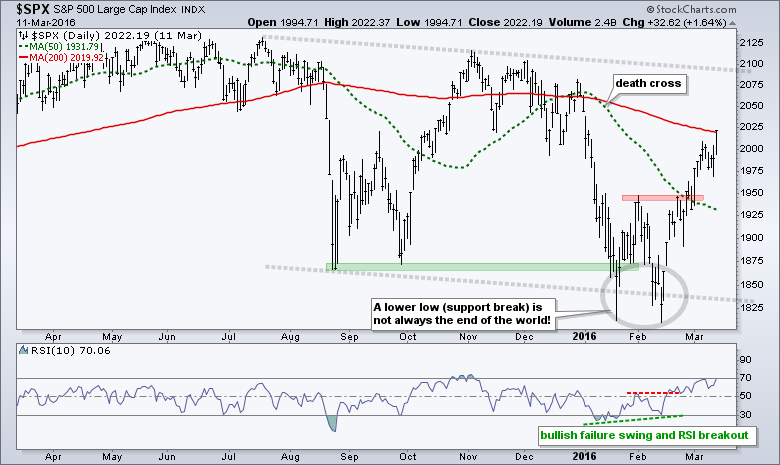
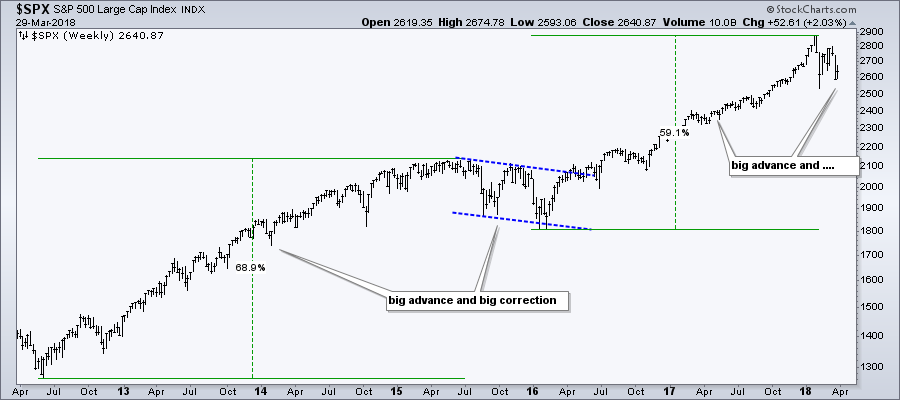
The seven-month decline on the chart above represented a massive correction after 60+ percent advance the prior three years. As the chart below shows, big advances sometimes require big corrections.
Each situation is unique so I will take it one day/week at a time and evaluate the evidence as it unfolds. As with the Fed, my assessment is data dependent and the analysis can change as new data appears.
Three Industry Group ETFs to Watch
The Home Construction iShares (ITB) has been one of the weakest groups this year with a sharp decline in January-February and a lower low in early March. The ETF caught my eye in March because it gained 3.2% when SPY lost 2.74%. Thus, ITB is showing some relative and absolute strength.
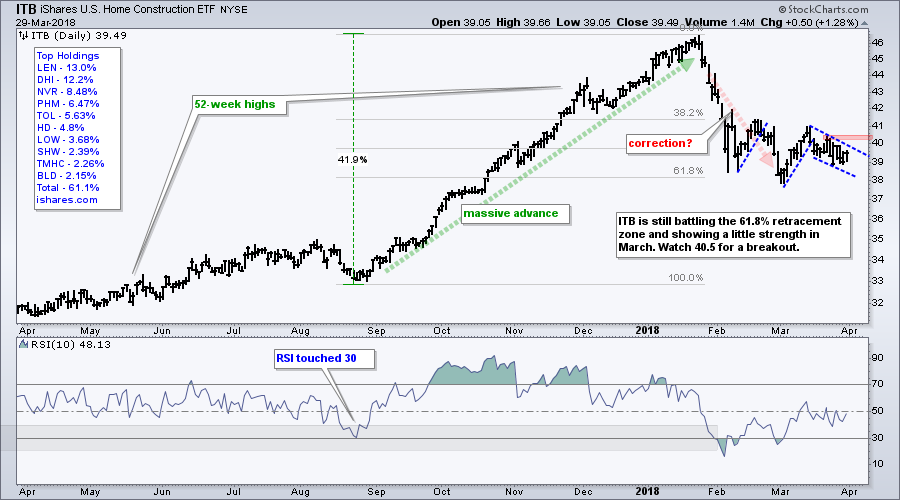
On the price chart, the ETF surged over 40% and then retraced around 61.8% of the advance. This retracement marks a battle zone that could end the correction or totally break the chart. Shorter-term, ITB formed a falling wedge correction over the last three weeks and I am watching for a breakout at 40.5.
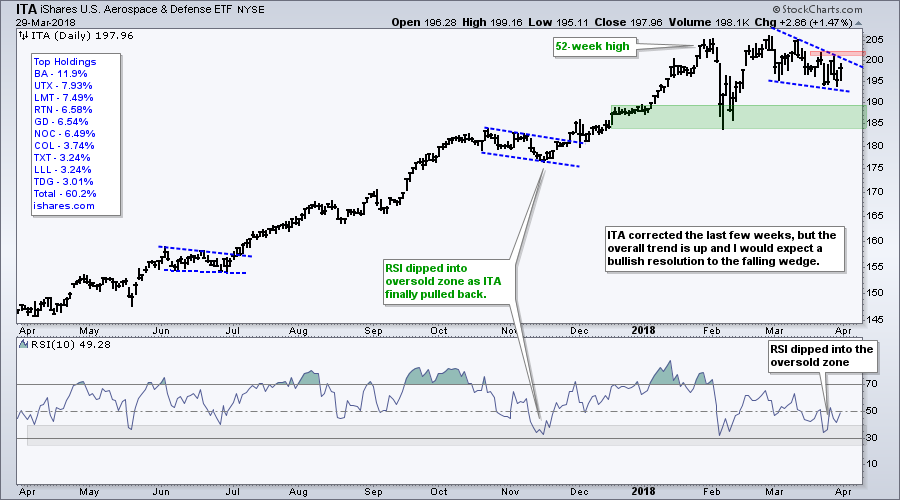
The iShares Aerospace & Defense ETF (ITA) is in a long-term uptrend with fresh 52-week highs earlier this year. The ETF remains well above the February low as a falling wedge forms the last five weeks. I view this as a correction within a bigger uptrend and expect a bullish resolution at some point.
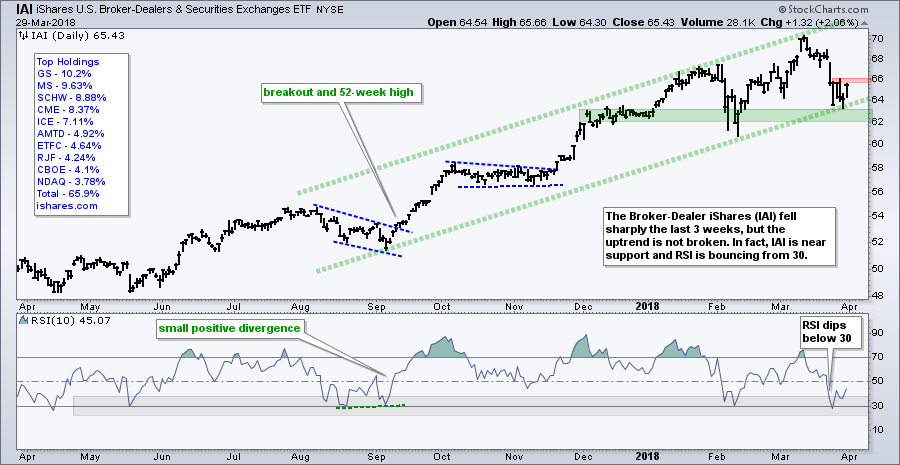
The Broker-Dealer iShares (IAI) remains in a clear uptrend with higher highs and higher lows since summer. The ETF recently fell back towards the green support zone and RSI became oversold. This also looks like a pullback within a bigger uptrend and I expect a bullish resolution.
Energy ETFs Continue Consolidation
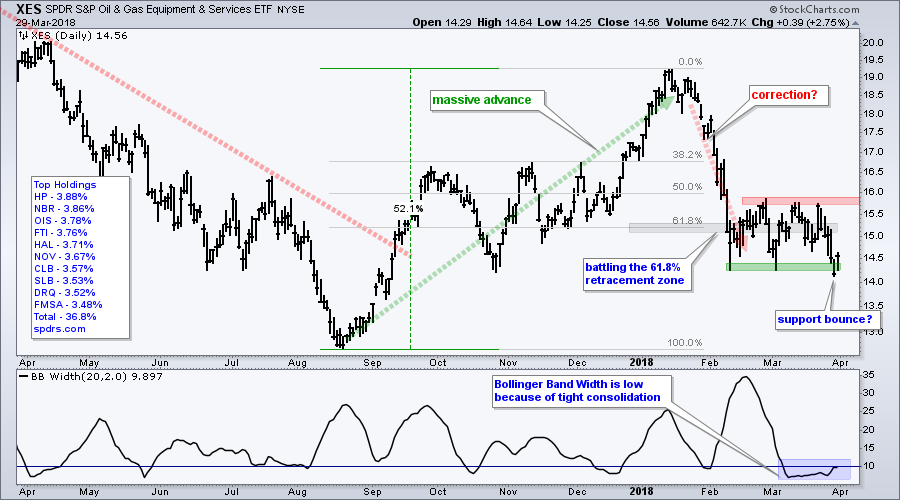
The Energy SPDR (XLE) and Oil & Gas Equip & Services SPDR (XES) remain tough calls as they battle it out near the 61.8% retracement. Both surged from August to January and then plunged into early February. They then consolidated the last six weeks. Chartists can watch the March range for the next directional break.

Oil is trading above $60 and remains in an uptrend. Thus, it is conceivable that the sharp declines in XLE and XES were corrections after massive advances. Upside breakouts would suggest that the corrections are ending and the August-January advances are resuming.
Stocks to Watch

Plan Your Trade and Trade Your Plan.
- Arthur Hill, CMT
Senior Technical Analyst, StockCharts.com
Book: Define the Trend and Trade the Trend
Twitter: Follow @ArthurHill


