- Two Down, One To Go.
- QQQ: Bruised, but not Quite Broken.
- Small-caps Continue to Show Relative Strength.
- Small-cap Consumer Discretionary and Industrials Lead.
- Housing and Retail Lead CD.
- Tech-related ETFs Remain Subdued.
- Watching the Channel in Oil.
- Notes from the Art's Charts ChartList.
 Trends depend on timeframes and the length of a timeframe differs from one chartist to the next. One chartist may consider six months long-term, while another may look at several years for a long-term trend.
Day traders may consider the short-term in hours and minutes, while position traders may use daily charts for their short-term outlook. As with so many aspects of technical analysis, timeframes are in the eye of the beholder.
My preference is for daily bar charts that extend one year. This makes it easy to see six to twelve month trends and new 52-week highs, which is long-term enough for my style.
While I usually focus on two trends, the long-term and the short-term, there are times when medium-term trends unfold and I must consider three trends. Three's a crowd and this is often the case with trends too. The analysis is much more complicated when a medium-term trend develops.
The daily chart for the S&P 500 shows a long-term uptrend, a medium-term downtrend and a short-term downtrend. The long-term trend is up because the 50-day SMA is above the 200-day SMA. I also think we are still in a bull market because the majority of breadth signals are still bullish (3 of 9).
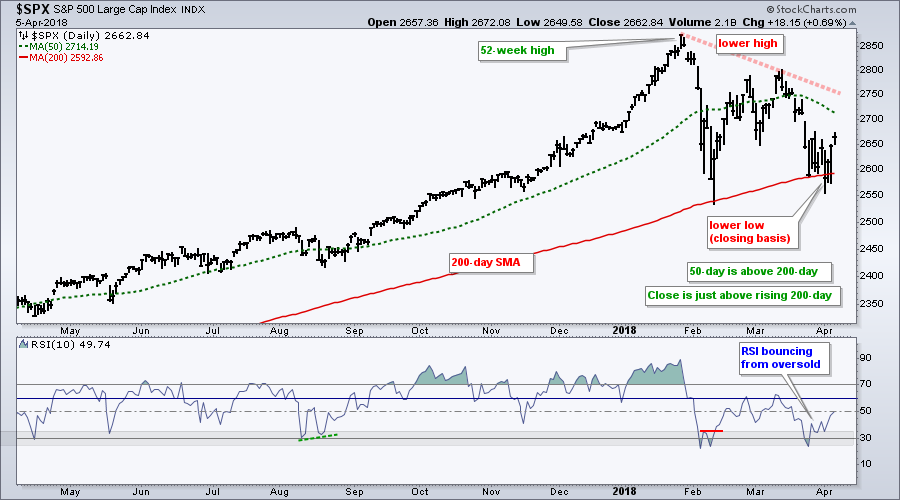
The medium-term trend is down because a lower high formed in March and Monday's close was below the early February closing low. Thus, we can argue for a 47 day downtrend and I would call this a medium-term downtrend.
The next chart shows SPY and the E-mini to analyze the short-term downtrend. I showed these two on Monday with pennants taking shape in late March. Both broke the lower pennant lines on Monday and then surged above the upper pennant lines the last three days. So much for the pennants.
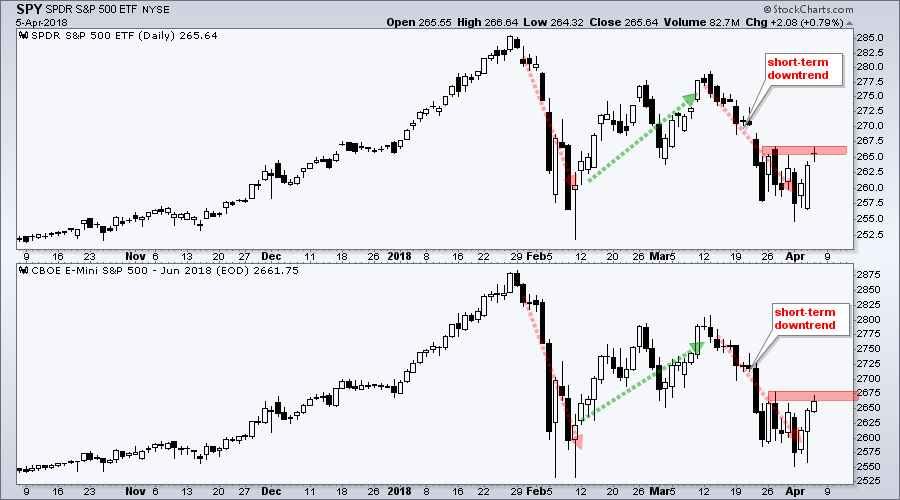
The short-term may seem a mess, but the short-term trend is still clearly down. Both SPY and the E-mini formed lower lows from late March to early April and failed to break above their late March high, which marks resistance.
Even though the medium-term downtrend may be a correction within a long-term uptrend, the short-term downtrend sets the tone right now and remains down. Wednesday's reversal day was impressive as a one-day event, but it was not enough to reverse the short-term downtrend. Let's see some follow through before becoming impressed.
The S&P 500 is the single most important market barometer. As long as the S&P 500 struggles, I would expect other broad indexes to struggle. Thus, we can expect more correction and volatility until the S&P 500 reverses its downswing.
QQQ: Bruised, but not Quite Broken
The chart below shows QQQ hitting new highs in January and March. The ETF also held the February closing low during the latest decline and the overall trend remains up. A close below the February closing low would break support and reverse the long-term uptrend.
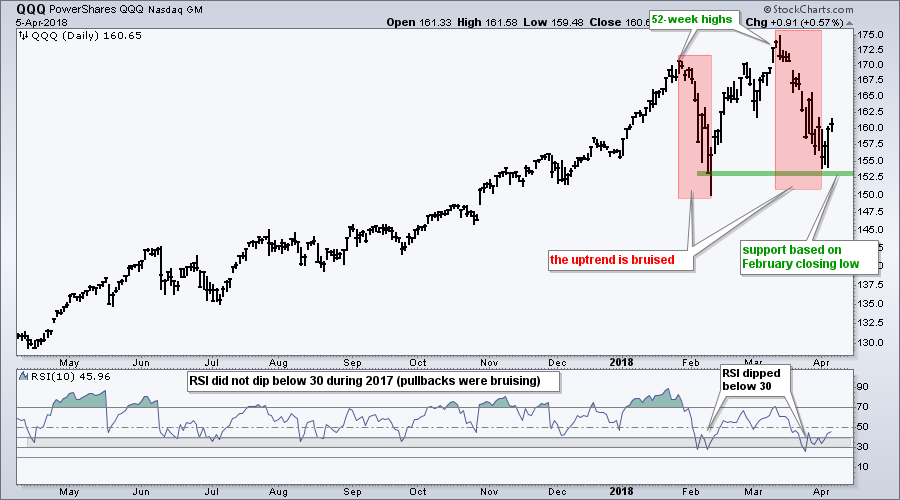
The red zones show two sharp declines in 2018. These declines pushed RSI(10) below 30 twice in 2018. Note that RSI(10) did not dip below 30 in all of 2017. Even though the dips below 30 show short-term oversold conditions within a bigger uptrend, they also show the most selling pressure in over a year. This is why I would consider QQQ bruised and look elsewhere.
Small-caps Continue to Show Relative Strength
The S&P SmallCap iShares (IJR) continues to show medium-term and short-term relative strength. Medium-term, the ETF held well above the February low. SPY, in contrast, tested the February low in late March.
Short-term, IJR broke above the late March high with a three day surge. SPY, in contrast, did not break above the resistance zone from its late March highs.
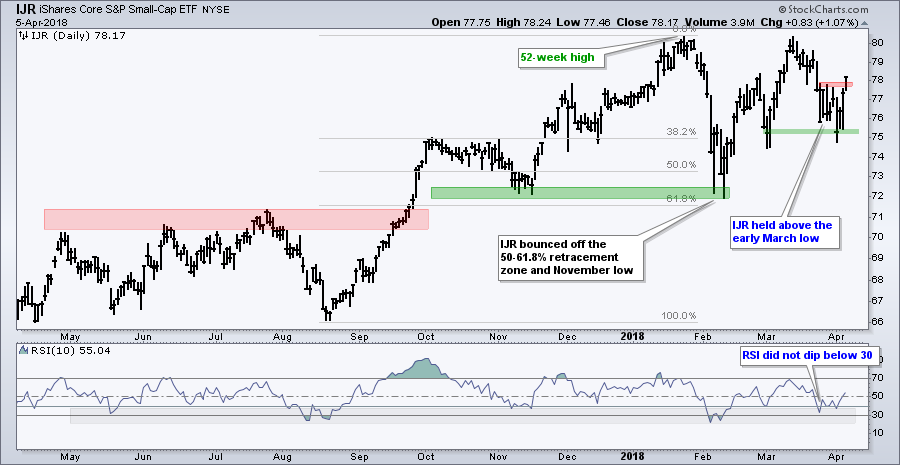
Overall, IJR reversed its short-term downtrend and looks poised to challenge the prior highs. Also note that a move back to the 80-81 area would form the handle of a potential cup-with-handle pattern.
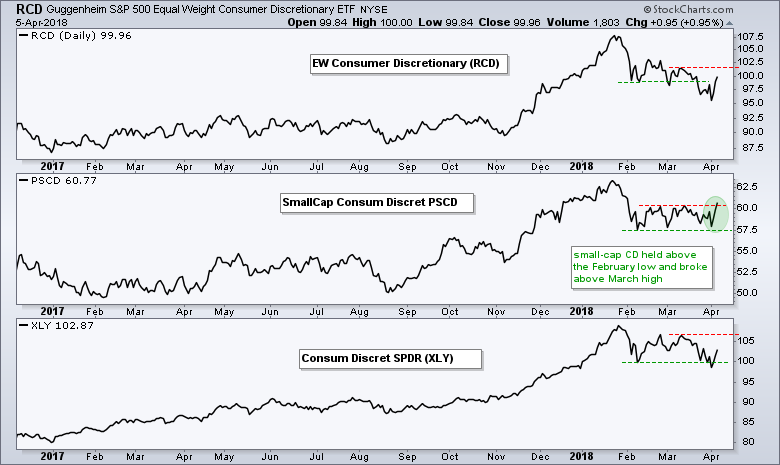
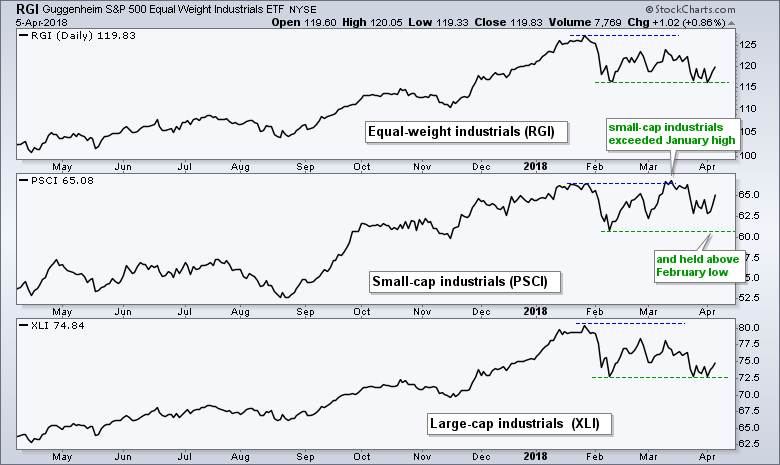
Small-cap Consumer Discretionary and Industrials Lead
We can also see relative strength in two small-cap sectors. The next charts show the equal-weight sector ETF in the top window, the small-cap sector in the middle window and the large-cap sector in the lower window.
There are three price points to use for comparison: the January high (blue dashed line), the February low (green dashed line) and the March high (red dashed line). The first chart shows the SmallCap Consumer Discretionary ETF (PSCD) breaking above its March high and leading the other two sector ETFs.
The next chart shows the SmallCap Industrials ETF (PSCI) hitting a 52-week high in mid March and holding well above the February low after the recent pullback. The other two fell well short of their prior highs and tested their February lows.
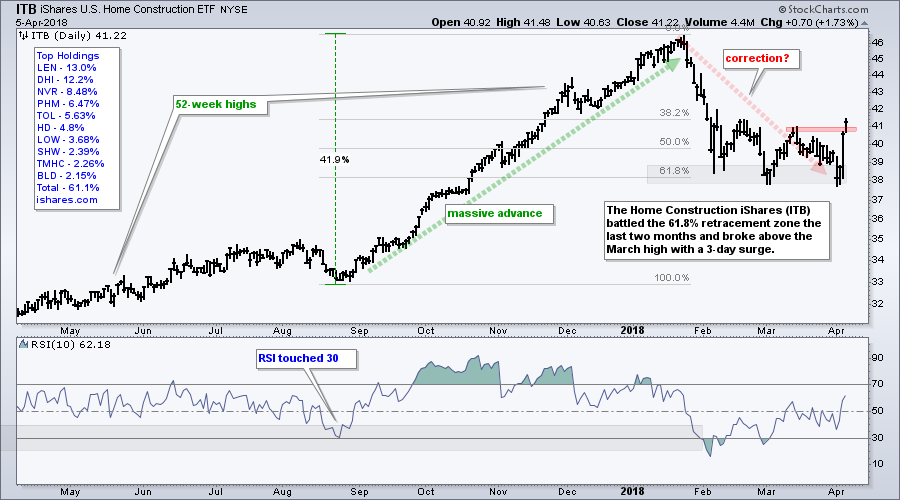
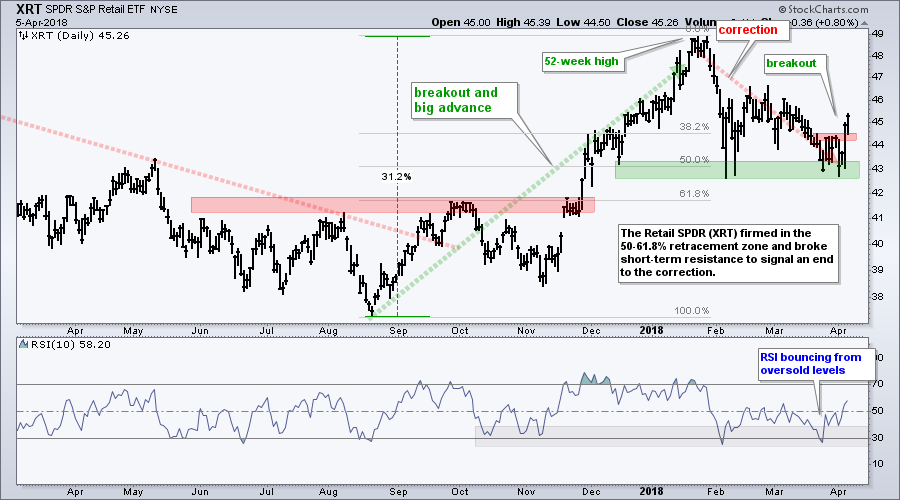
Housing and Retail Lead CD
The Home Construction iShares (ITB) surged above its March high and the Retail SPDR (XRT) broke short-term resistance to lead the consumer discretionary sector.
The first chart shows ITB retracing around 61.8% of the August-January advance and finding support in the 38 area three times since February. Even though the January-March decline seems deep, note that it retraced around two thirds of a 40+ percent advance. Thus, it could be a normal correction. The surge off support and breakout suggest that the correction is ending and the prior advance is resuming.
The next chart shows XRT retracing around 50% of its prior advance and finding support in the 43 area. The ETF surged above the late March high this week and it looks like the correction is ending.
Tech-related ETFs Remain Subdued
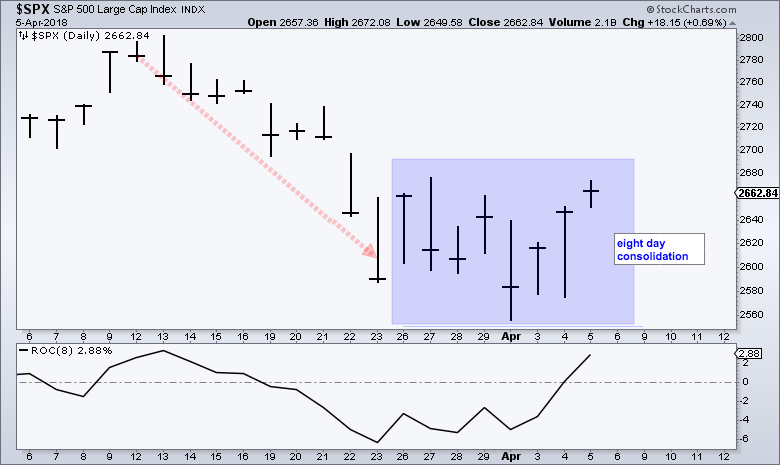
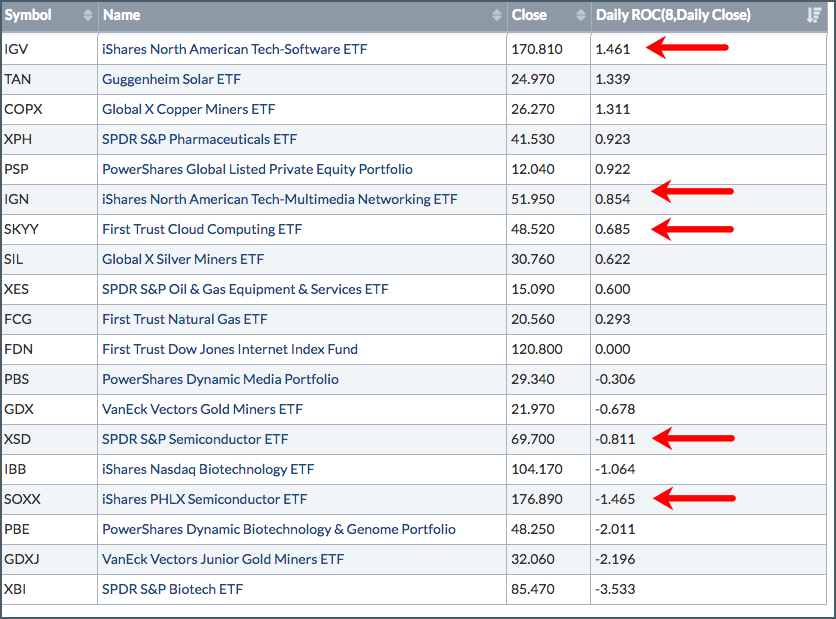
The S&P 500 fell below 2600 two weeks ago Friday and then moved into a trading range the last eight days. The index is up around 2.88% over this eight day period, but a number of tech-related ETFs are underperforming over this timeframe. Some are even down and trading below their low on March 23rd.
The table below shows some of the weaker industry group ETFs during this timeframe. All are underperforming the S&P 500 because their 8-day ROC is below 1.5%. Notice that the Semiconductor iShares (SOXX), Semiconductor SPDR (XSD), Biotech SPDR (XBI) and Biotech iShares (IBB) are negative over this time period. This means they did not bounce and remain under pressure. This is not good for the technology sector or the market because XLK is still around 25% of the S&P 500.
Watching the Channel in Oil
Oil moved towards the January high in late March and then fell back over the last eight days. The blue lines mark a rising channel since mid February and the lower line defines the upswing. A channel break would be negative here and could lead to a double top.
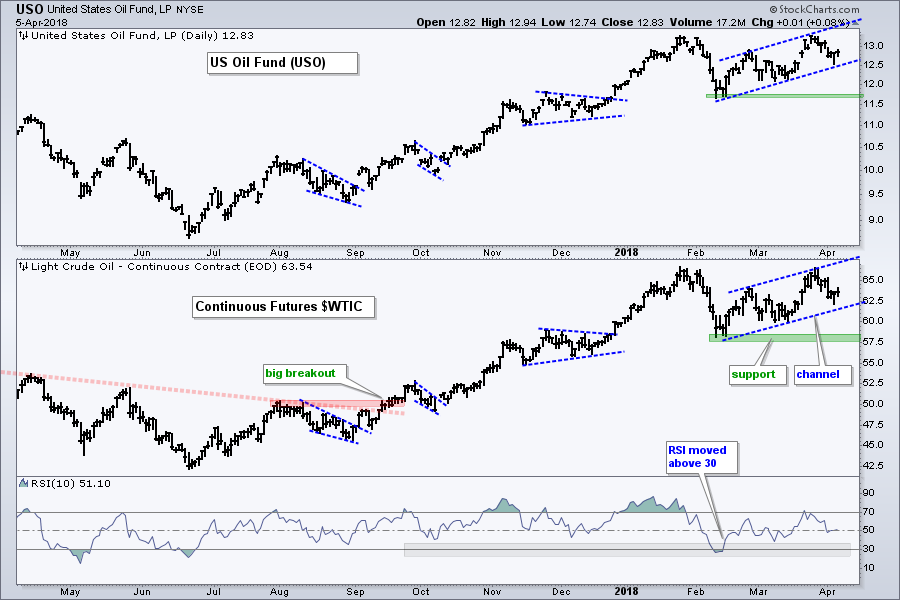
A break below the February low would confirm the double top and reverse the long-term uptrend. Chartist interested in XES and XLE should watch closely because a break down in oil would likely weigh on these two energy-related ETFs.
Notes from the Art's Charts ChartList
- The Home Construction iShares (ITB) battled the 61.8% retracement zone the last two months and broke above the March high with a 3-day surge.
- The Retail SPDR (XRT) firmed in the 50-61.8% retracement zone and broke short-term resistance to signal an end to the correction.
- The Cyber Security ETF (HACK) retraced 50% of the prior surge and reversed the short-term downtrend with a breakout on Wednesday. RSI also bounced from the oversold zone.
- The Semiconductor iShares (SOXX) is still in a long-term uptrend, but it is one of the weaker tech ETFs because it did not reverse its short-term downswing.
- The iShares Aerospace & Defense ETF (ITA) softly corrected with a falling wedge as RSI dipped below 40. The ETF broke the wedge line with a 3-day surge and is close to breaking the red resistance zone.
- The Biotech SPDR (XBI) broke below the February low (closing basis) and this confirms a double top.
- The HealthCare Providers ETF (IHF) had a good week as it held the February low and reversed the short-term downswing with a short-term breakout.
- The Oil & Gas Equip & Services SPDR (XES) is still battling the 15 area and still within a consolidation. A break above the February-March highs is needed to reverse the 2018 downtrend.
Plan Your Trade and Trade Your Plan.
- Arthur Hill, CMT
Senior Technical Analyst, StockCharts.com
Book: Define the Trend and Trade the Trend
Twitter: Follow @ArthurHill


