- Small-caps Continue to Lead.
- IJR Remains with Bullish Continuation Pattern.
- Large-cap Techs are Lagging, but Trending Up.
- A Divided Market.
- The S&P 500 is Stuck in the Middle.
- %Above 50-day EMA Struggling.
- Countering the Downward Breadth Thrusts.
- Healthcare Perks Up.
- Biotech ETFs Get Oversold Bounces.
- Notes from the Art's Charts ChartList.
 Small-caps Continue to Lead...
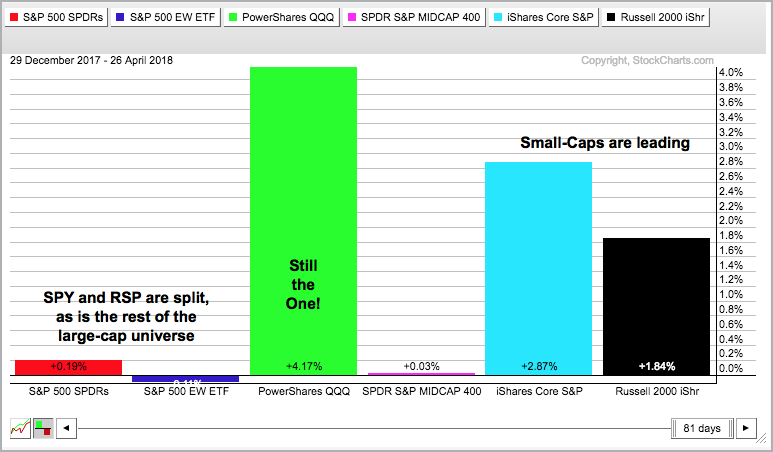
The S&P SmallCap iShares (IJR) remains the strongest of the big three (SPY, QQQ, IJR). While SPY and QQQ flirt with their February-April lows, IJR is close to its January-March highs. We can also see some small-cap leadership with the year-to-date PerfChart below.
SPY is up a fraction and the EW S&P 500 ETF (RSP) is down a fraction, which reflects the divisions within the large-cap universe. QQQ is still the year-to-date leader after Thursday's big gain. Yes, QQQ is still the one (cue Orleans, the band from 1976). IJR and IWM are also leading with modest year-to-date gains.
IJR Remains with Bullish Continuation Pattern
The IJR formed a bullish cup-with-handle from mid January to mid April and then backed off rim resistance with a decline this week. The pattern remains in play and a breakout would confirm this bullish continuation pattern.
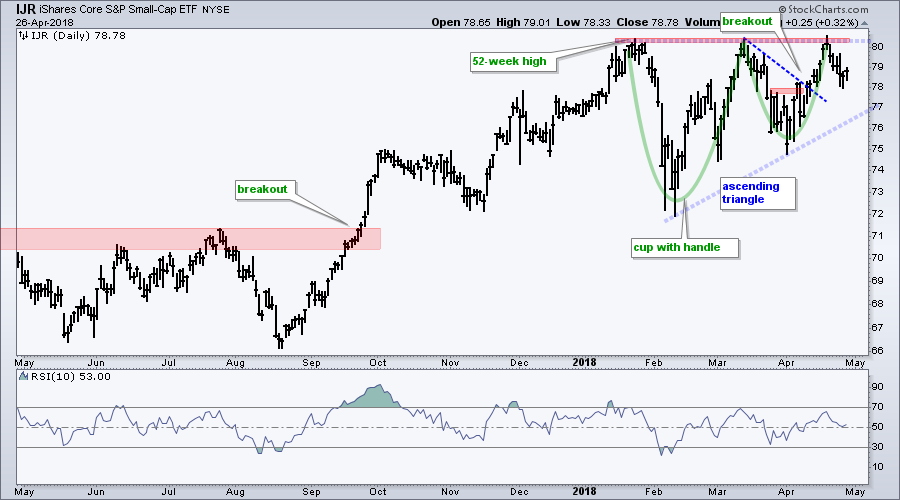
Notice that IJR is also forming an ascending triangle with the higher lows and equal highs this year. This is also a bullish continuation pattern that would be confirmed with an upside breakout.
Large-cap Techs are Lagging, but Trending Up
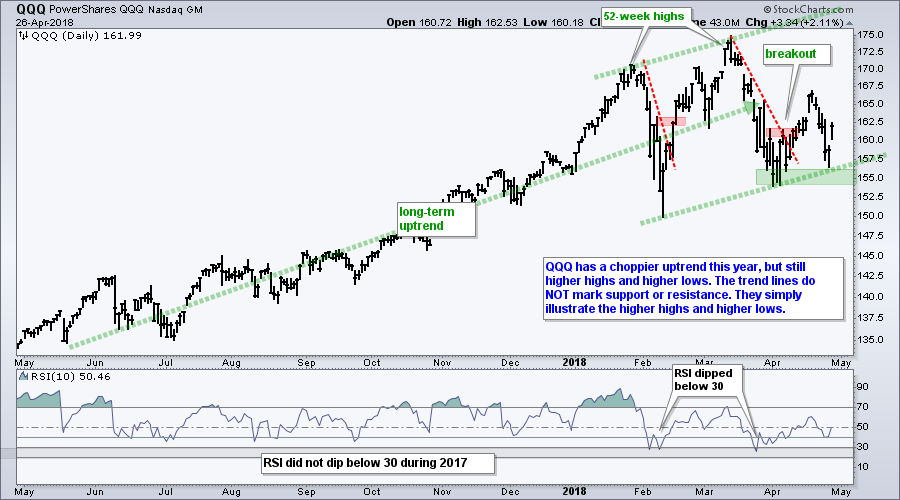
The Nasdaq 100 ETF (QQQ) took a big hit on Tuesday, firmed on Wednesday and rebounded on Thursday. It looks like another higher low is forming and the uptrend is simply widening. QQQ advanced with a tight uptrend in 2017, but volatility hit this year with five 8% swings since late December. The green trend lines mark the higher highs and higher lows this year, and the overall uptrend.
A Divided Market
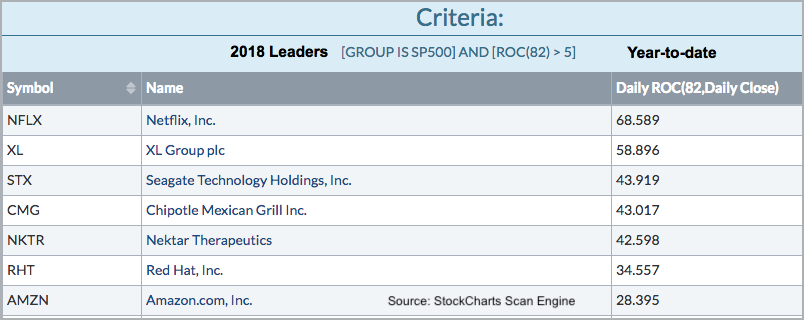
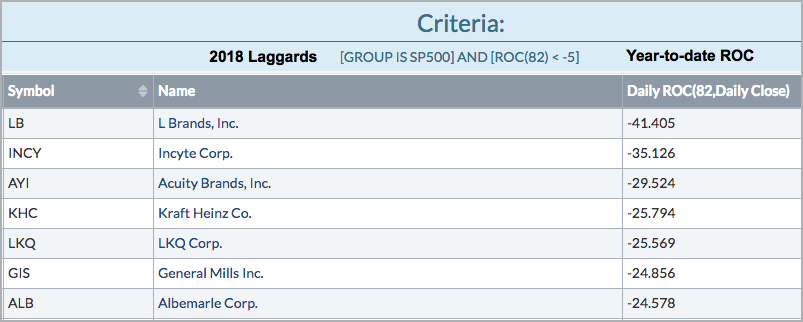
The performance disparities in the sectors, industry groups and stocks of the S&P 500 have created a trading range for this benchmark index. Some groups and stocks are strong, while others are weak. Note that 238 (47.6%) stocks in the S&P 500 are up year-to-date and 153 (30.6%) are up more than 5%. Conversely, 262 (52.4%) stocks are down this year and 171 (34.2%) are down more than 5%. It is clearly a stock pickers market this year.
The S&P 500 is Stuck in the Middle
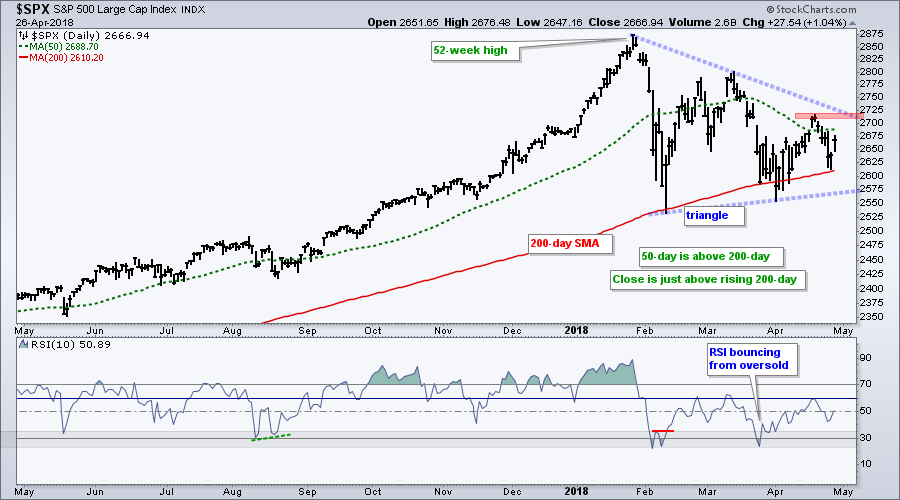
A divided market means lackluster performance for the S&P 500 and this is reflected on the chart. The index is pretty much right where it ended 2017. The 2018 range is wide and narrowing as a triangle takes shape. The long-term trend is up so I still view this as a big bullish continuation pattern. With the mid April high, we now have a resistance level to watch for a breakout.
%Above 50-day EMA Struggles
The stock market bounced from April 2nd to 18th with a 5% advance in 12 trading days. This bounce, however, did not have much "oomph", which is the technical term for strong breadth. Breadth was "ok", but not great.
The chart below shows the Percentage of Stock Above the 50-day EMA for the S&P 500, S&P Mid-Cap 400, S&P Small-Cap 600 and Nasdaq 100. Notice that this indicator regularly moved above 70% in 2017. The September move above 70% signaled an end to a corrective period (green oval).
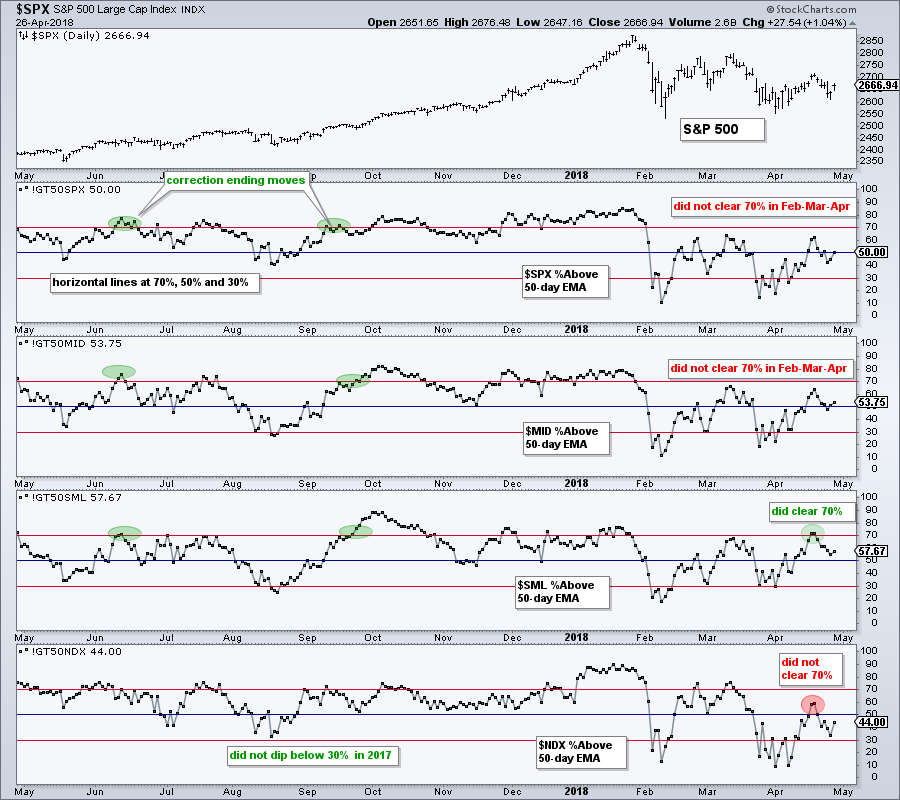
Looking at the March-April bounces, the indicator did not clear the 50% level for the S&P 500 and S&P Mid-Cap 400. This means breadth, which measures upside participation, was lackluster. We need to see these indicators exceed 70% across the board to signal broadening participation.
Countering the Bearish Breadth Thrusts
The correction period in 2018 started with the 10-day EMA for AD Percent plunging below -30% for the S&P 500, S&P Mid-Cap 400, S&P Small-Cap 600 and Nasdaq 100 in early February. The chart below shows these plunges with red ovals. Three of the four also plunged below -30% again in late March. Small-caps held up the best as the 10-day EMA of S&P SmallCap AD Percent ($SMLADP) held above -30%.
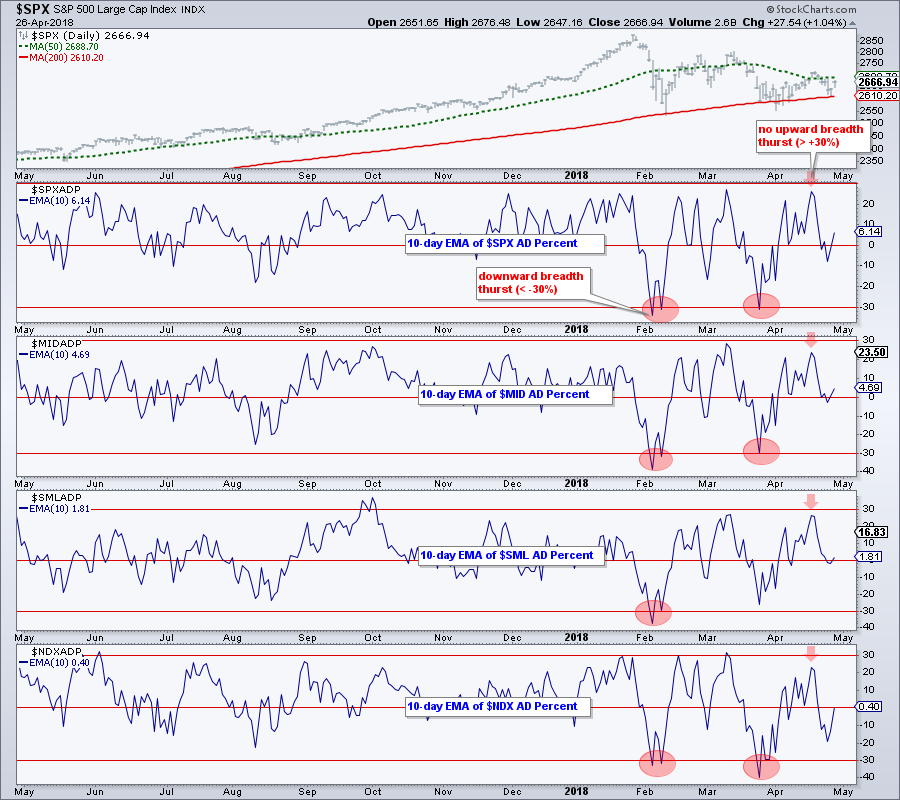
These indicators rebounded in March and April, but fell short and did not exceed +30%, which is required for a bullish breadth thrust. The red arrows in late April show these shortfalls and a move above +30% is needed to show broad buying enthusiasm again. Such a move would likely signal the end to the broad market correction. It could be a stock pickers market until we see such moves.
Healthcare Perks Up
I am going to spotlight the Health Care SPDR (XLV) this week because it is getting an oversold bounce and short-term breakout. The chart below shows weekly bars over the last two years. XLV hit a new high in January, plunged in February and tested the February low. The blue area marks broken resistance turning support in the 80 area.
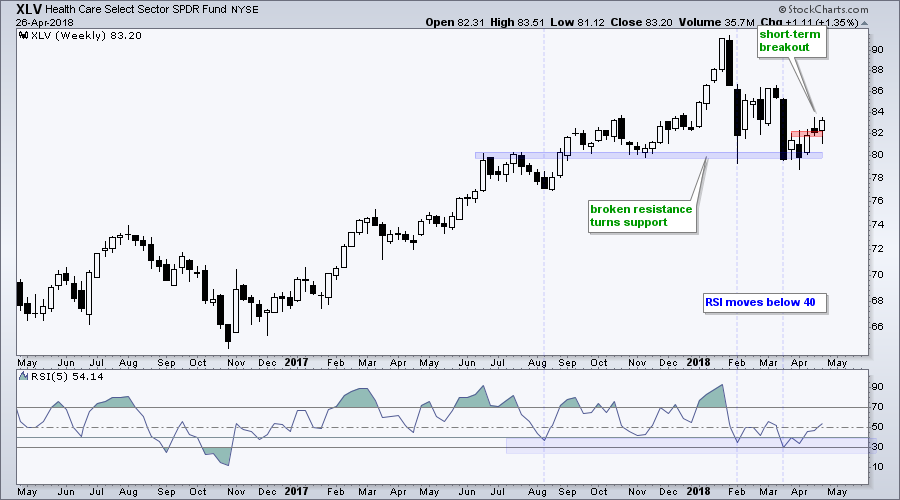
XLV is getting a bounce off support with a short-term breakout over the last two weeks. Also notice that RSI dipped below 40 in mid March and moved back above this level three week's ago. While 30 is the classic oversold level for RSI, I like to use the 20-40 zone for oversold. Sometimes RSI dips all the way below 30 for "true" oversold and sometimes it just dips below 40 for mild oversold.
Biotech ETFs Get Oversold Bounces
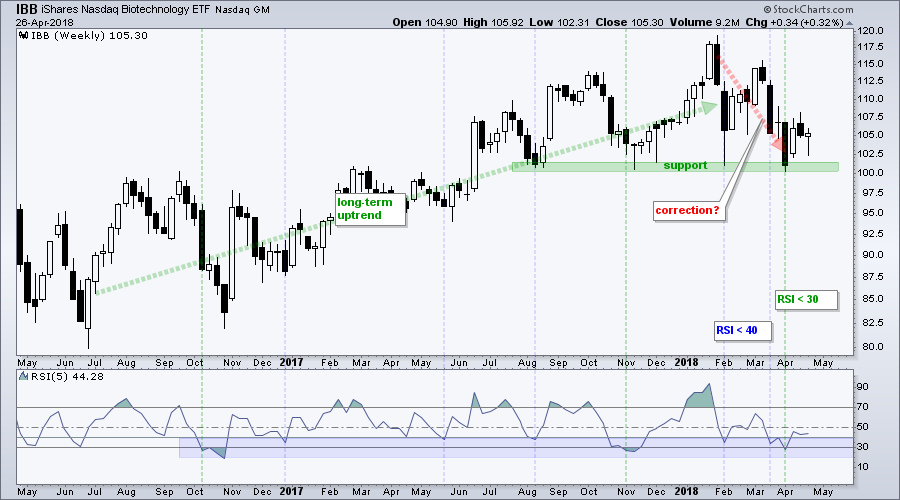
The next chart shows the Biotech iShares (IBB) hitting support from the lows extending back to August. The decline was sharp, but started from a 52-week high and could still be a correction within a bigger uptrend. IBB firmed the last three weeks as RSI moved back above 40. IBB could be laying the ground work for a bounce off support .
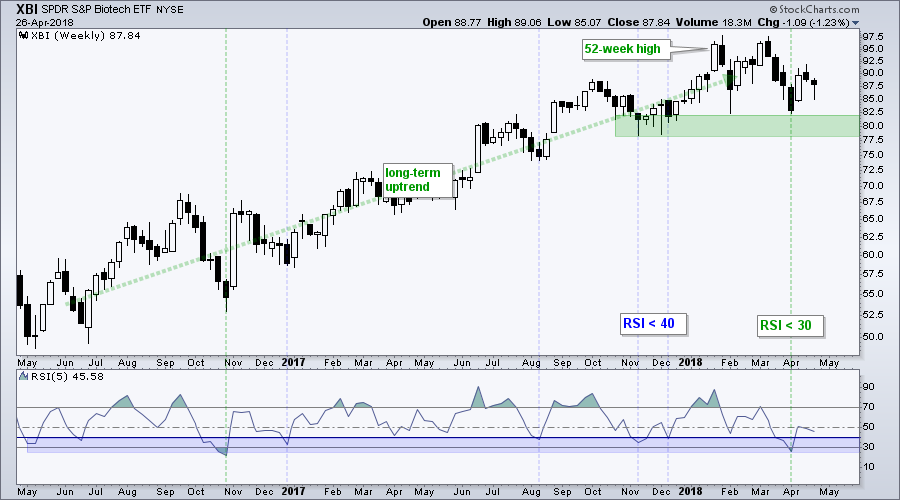
The next chart shows the Biotech SPDR (XBI) with a stronger uptrend over the last two years. The ETF fell back to the February low with a four week decline and then bounced with a long white candlestick three week's ago. Also notice that RSI dipped below 30 for the second time in two years. It looks like an oversold bounce within a bigger uptrend is materializing.
Notes from the Art's Charts ChartList
- The Home Construction iShares (ITB) is bouncing off range support for the third time in three months.
- The Retail SPDR (XRT) kept its breakout alive with a bounce this week.
- The Cloud Computing ETF (SKYY), Internet ETF (FDN) and Software iShares (IGV) held upswing support with bounces on Thursday.
- The Semiconductor iShares (SOXX) is nearing a big support zone and RSI is flirting with oversold territory.
- The Regional Bank SPDR (KRE) is leading over the last six days with a 4.5% bounce.
- The iShares Aerospace & Defense ETF (ITA) got whacked, but the long-term trend is up and an ascending triangle could be taking shape.
- The Biotech iShares (IBB) and Biotech SPDR (XBI) are bouncing off support zones.
- The Agribusiness ETF (MOO) held its breakout and is poised to challenge the triangle line. The Copper Miners ETF (COPX) failed to hold its breakout and fell back into the triangle.
- The Steel ETF (SLX) broke out in mid April and this breakout is holding strong.
- Click here for the ChartList, which was updated on Friday, April 27th.
Plan Your Trade and Trade Your Plan.
- Arthur Hill, CMT
Senior Technical Analyst, StockCharts.com
Book: Define the Trend and Trade the Trend
Twitter: Follow @ArthurHill


