- SPY Tests Upswing Support.
- Finance Sector Holds Up Best.
- Two Down and Three to Go.
- KRE Still Looking Positive.
- Bullish Continuation Patterns in Energy-Related ETFs.
- A Few Telcos Come Alive.
- Four Stocks to Watch.
 SPY Tests Upswing Support...
I marked upswing support for the S&P 500 SPDR (SPY) and the five big sectors in Tuesday's commentary. The Technology SPDR (XLK) and Industrials SPDR (XLI) led the market lower over the last five to six days and both ETF broke upswing support. SPY is testing upswing support, while the other three big sectors are holding above support. It is one messy market.
The chart below shows SPY falling 2.5% over the last five days and testing the lows on April 10th and 11th. Note that SPY closed at 162.98 on Tuesday and the April 10th low is at 162.98. Truth-be-told, we cannot really use precise levels for support and resistance when it comes to ETFs that have hundreds of moving parts (stocks).
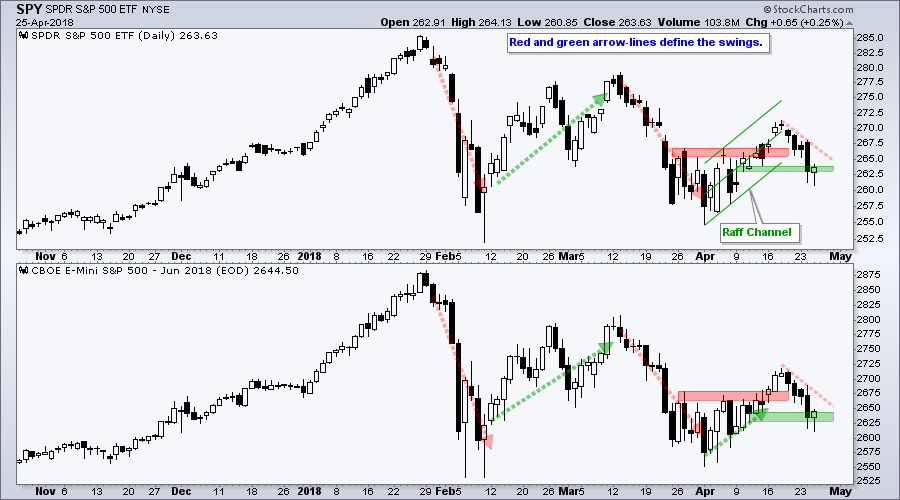
Has the upswing reversed? It’s a tough call, but I will give the benefit of the doubt to the bulls because three of the five big sectors are holding their upswings. The bulls, however, have their work cut out after Tuesday’s sharp decline. Watch for a break above 267.5 to signal a mini breakout.
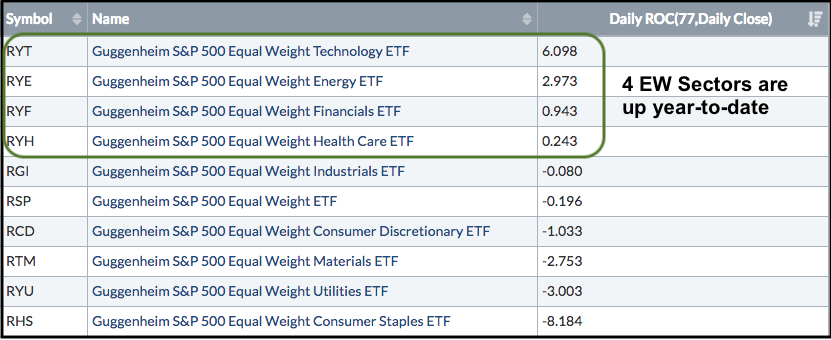
The market as a whole has become quite divided and this has caused the S&P 500 to trade sideways the entire year. SPY is down .12% year-to-date (77 day Rate-of-Change). Meanwhile, just four of the nine equal-weight sectors are up. Talk about a split market. Of the 50 industry group ETFs that I track, 28 are up year-to-date and 22 are down.
Finance Sector Holds Up Best
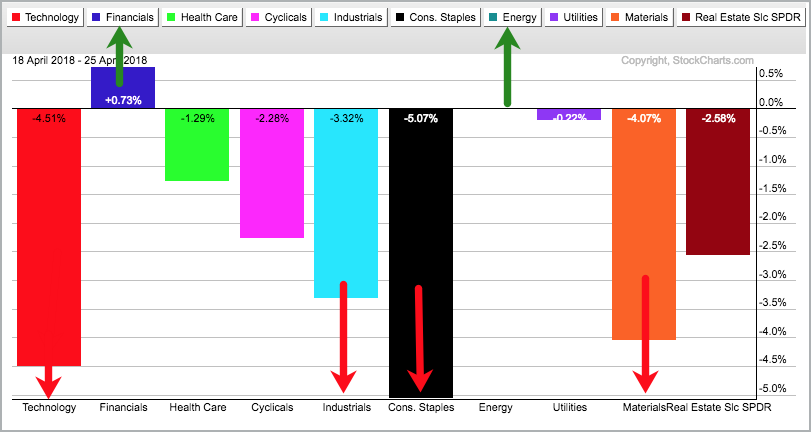
As the PerfChart below shows, only one sector is positive over the last five days, the Financials SPDR (XLF) (blue). The Energy SPDR is slightly negative (-.03%) and the Utilities SPDR (purple) is down a fraction. The Technology SPDR (red), Consumer Staples SPDR (black) and Materials SPDR (burgundy) led the 5-day decline. The Health Care SPDR (green) held up relatively well with a 1.3% loss.
Two Down and Three Up
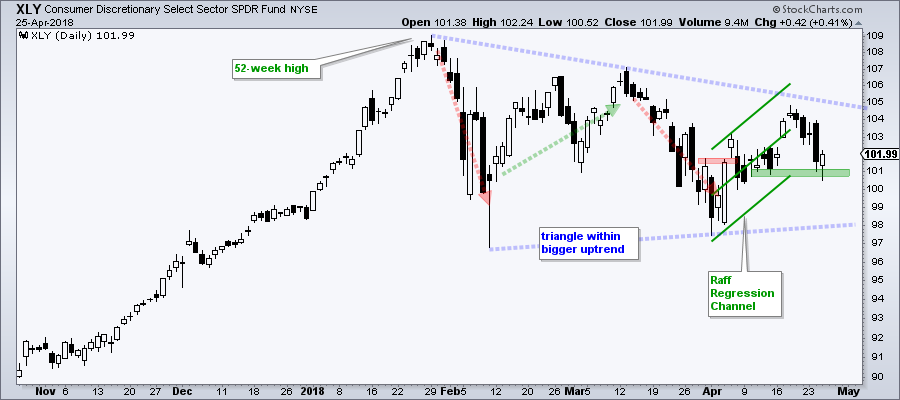
XLK, XLI, XLY, XLV and XLF account for 75% of the S&P 500 and two broke down this week (XLK and XLI). This means one more is needed to tilt the balance to turn bearish. The first chart shows the Consumer Discretionary SPDR falling to upswing support and firming on Wednesday. AMZN accounts for 20% of the ETF and reports today.
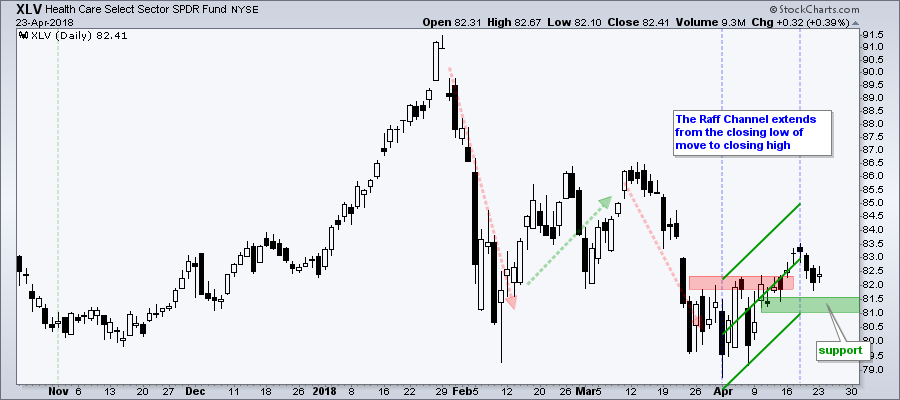
The Health Care SPDR (XLV) fell to upswing support on Tuesday and firmed on Wednesday with a small bounce.
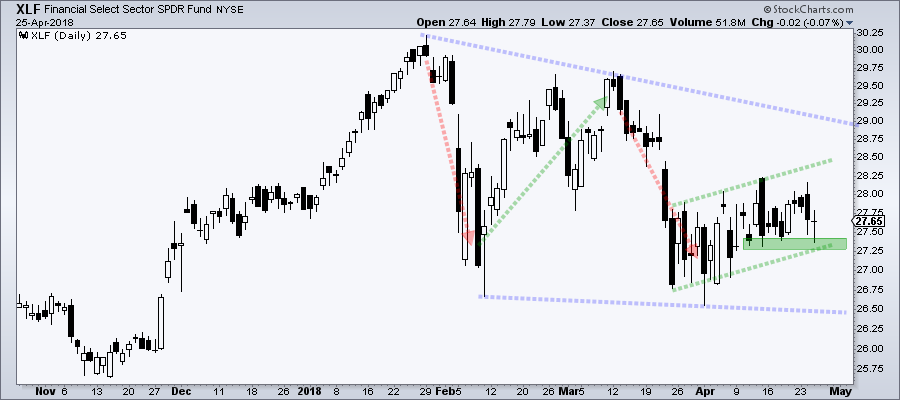
The Financials SPDR (XLF) also fell on Tuesday and then firmed on Wednesday with an indecisive candlestick (long-legged doji). This ETF has traded very choppy the last four weeks, but there is still a slight upward drift with support marked in the 27.25-27.50 area.
KRE Still Looking Positive
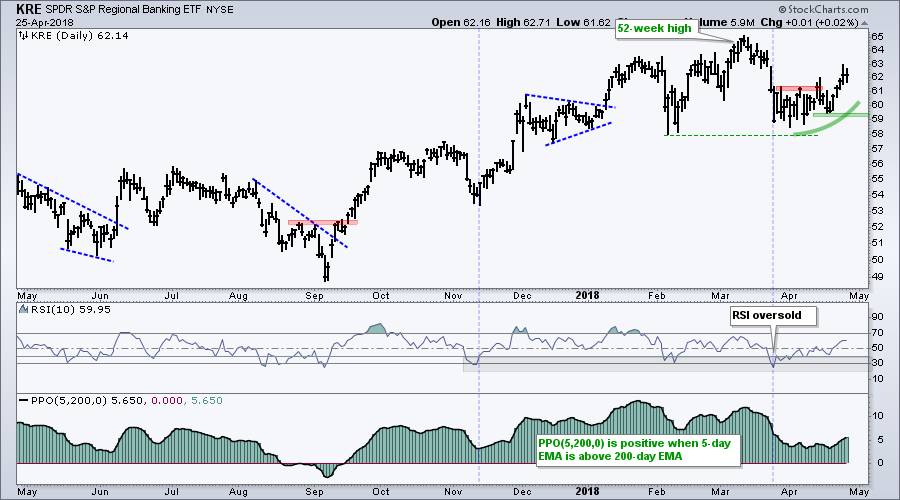
The Regional Bank SPDR (KRE) bucked the market decline on Tuesday with a gain and move above the mid April high. The overall trend is up with a 52-week high in March and the positive PPO(5,200,0). KRE firmed just above the February low in mid April and turned up the last five days. Note that SPY is down 2.5% the last five days and KRE is up 3.86%.
Bullish Continuation Patterns in Energy-Related ETFs
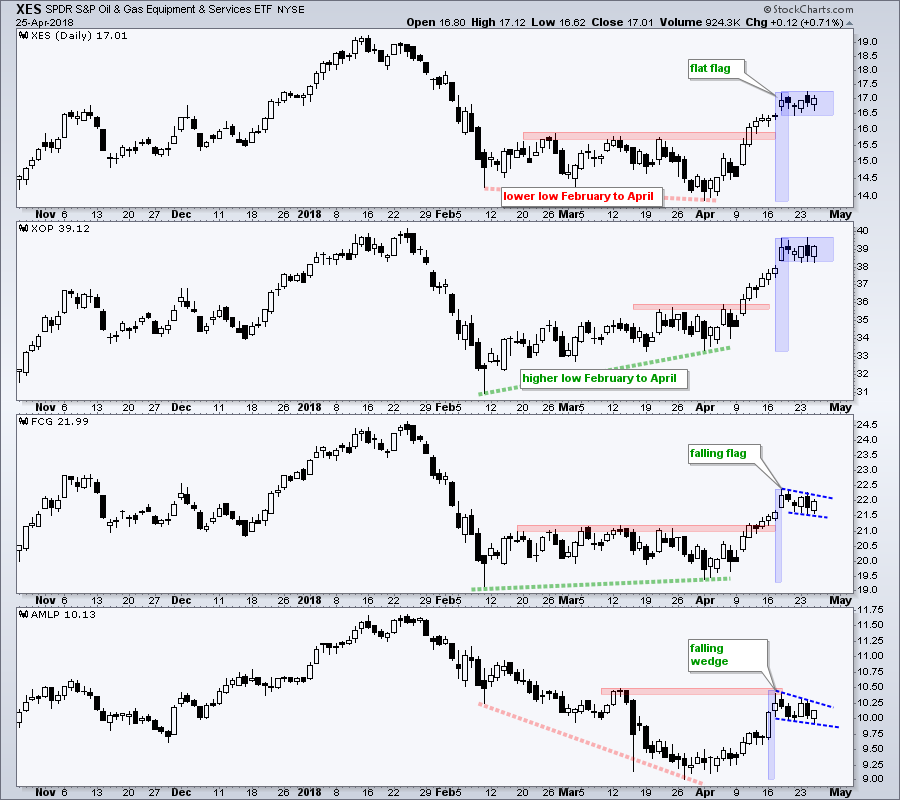
The energy sector is by far the best performing sector in April with an 9% gain month-to-date. Oil is also in an uptrend with a 4.8% gain this month and a 52-week high last week. This puts energy-related stocks in the spotlight for bullish setups and I am seeing short-term bullish continuation patterns in the Oil & Gas Equip & Services SPDR (XES), Oil & Gas E&P SPDR (XOP), FirstTrust Natural Gas ETF (FCG) and Alerian MLP ETF (ALMP).
All four surged from April 3rd to 18th and then consolidated the last five days. XES and XOP have flat flags working, while FCG and AMLP have falling consolidations. This represents a short-term rest after a sharp surge and they are bullish continuation patterns. Upside breakouts would signal a continuation higher.
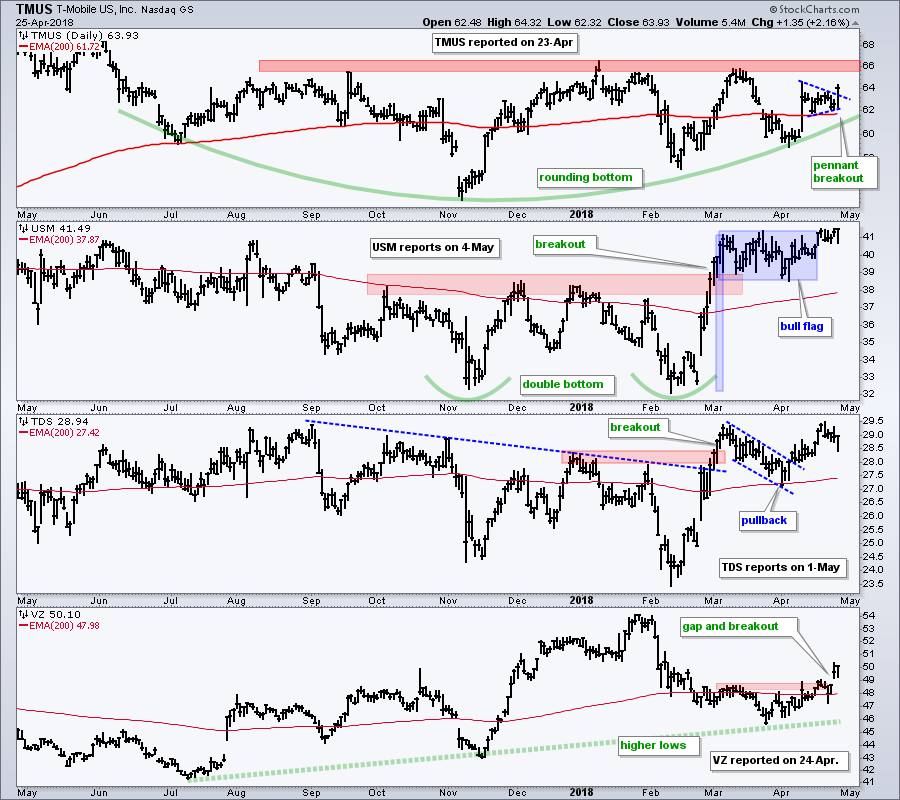
A Few Telcos Come Alive
The Telecom iShares (IYZ) is one of the worst performing groups over the past year with a 16% decline since late April 2017. IYZ remains in a downtrend, but I am seeing some strength in a few of the component stocks. TMUS has a rounding bottom at work and a pennant breakout on Wednesday. USM broke double bottom resistance in early March and is breaking flag resistance now. TDS broke out of a falling channel in early April. VZ has been rising since July and broke short-term resistance with a gap-surge on Tuesday.
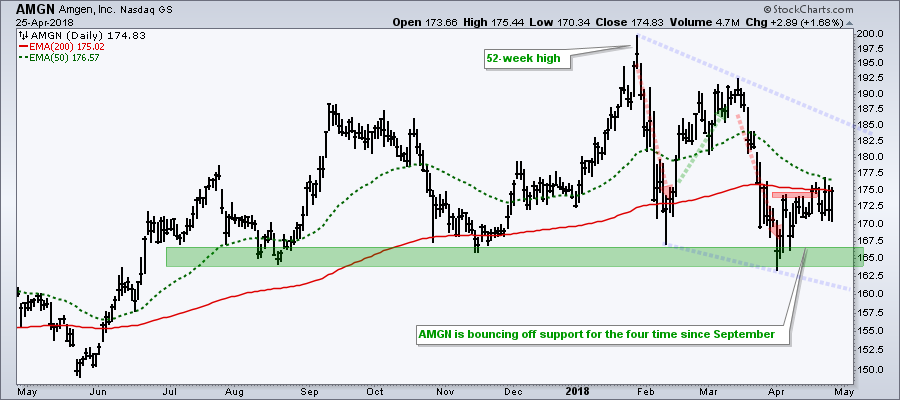
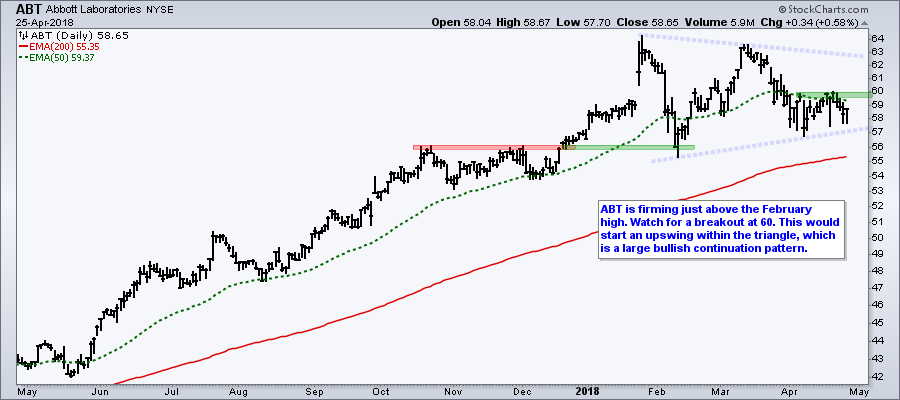
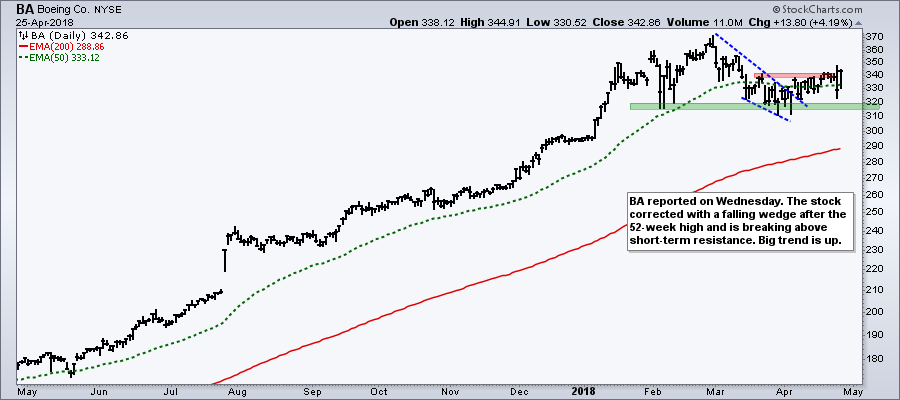
Four Stocks to Watch
Plan Your Trade and Trade Your Plan.
- Arthur Hill, CMT
Senior Technical Analyst, StockCharts.com
Book: Define the Trend and Trade the Trend
Twitter: Follow @ArthurHill


