- Small-caps and Large-Techs Still Leading.
- IJR Holds above Breakout Zone.
- QQQ Falls Back into Pennant.
- Six Flags over the Nasdaq 100.
- Strike One on SPY.
- Selling Pressure Concentrated in Large-caps.
- On Trend Highlights...
 The S&P 500 SPDR (SPY) broke below its mid-May lows with a sharp decline, but the S&P SmallCap iShares (IJR) and the Nasdaq 100 ETF (QQQ) held up quite well. The Financials SPDR (XLF) led SPY lower with a 3.34% loss, but we also saw strong selling pressure in the Industrials SPDR (XLI) and modest selling pressure in the Health Care SPDR (XLV).
The PerfChart below shows performance over the last five trading days. Note that the S&P 500 SPDR peaked five days ago and fell 1.6% from last week's (closing) high. This is clearly not a major decline, but we can use this period to separate the leaders from the laggards. The S&P SmallCap iShares is down less and the Nasdaq 100 ETF is actually positive. Now, there's a story. QQQ is showing relative, and some absolute, strength the last five days.
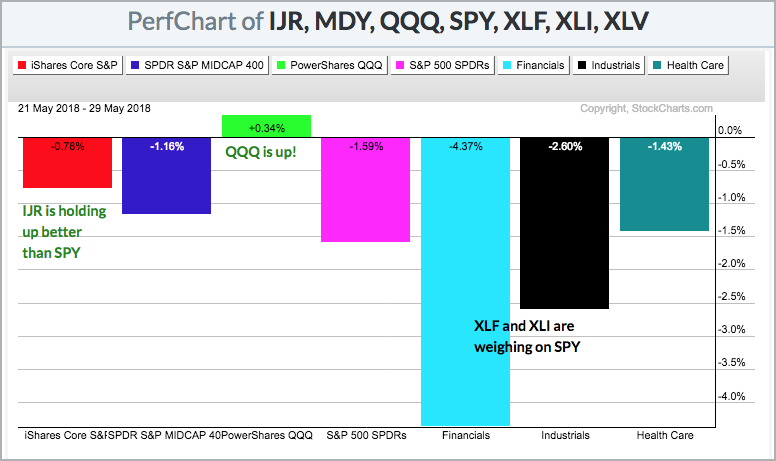
The rest of the PerfChart shows the Financials SPDR and Industrials SPDR leading the way lower with bigger losses than SPY. The Health Care SPDR is also down, but down a little less and showing some relative strength.
IJR Holds above Breakout Zone
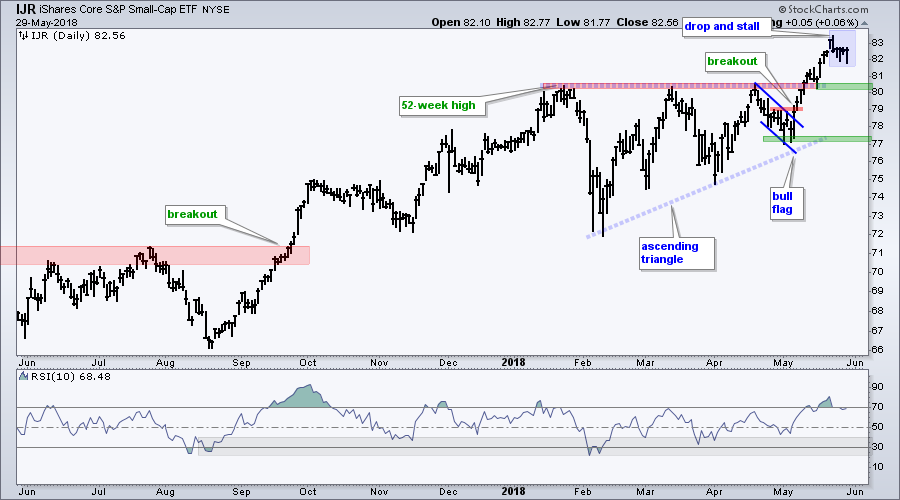
The first chart shows the S&P SmallCap iShares (IJR) with the ascending triangle breakout in mid May and a new high last week. The blue shading shows the ETF falling below 83 five days ago and then stalling the last four days. IJR is holding above the breakout and this means the breakout remains in play (bullish).
QQQ Falls Back into Pennant
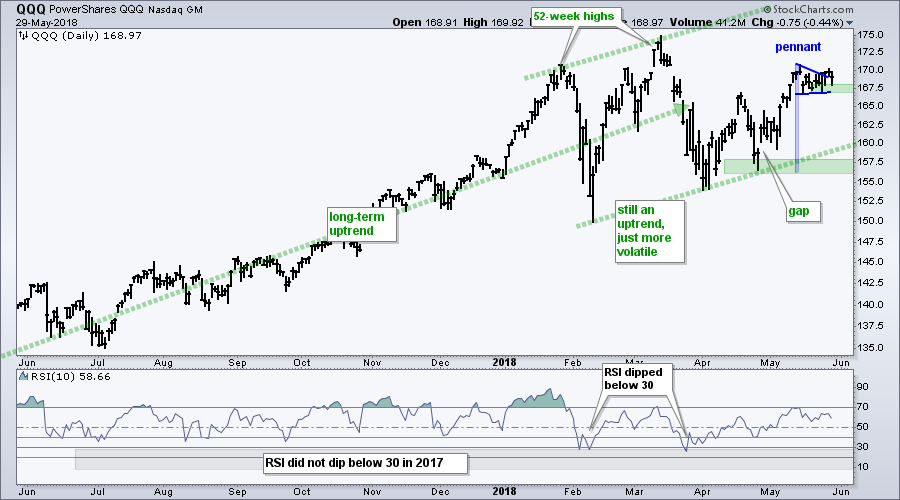
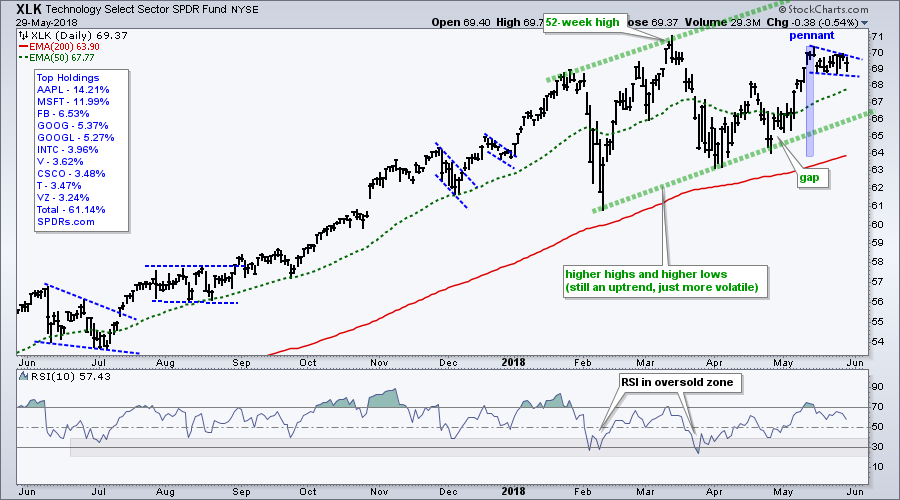
The next chart shows the Nasdaq 100 ETF (QQQ) in a long-term uptrend with a 52-week high in March and higher lows in March-April. The ETF surged from 156 to 170 and then formed a pennant over the last two weeks. I left the original pennant lines, but chartists can also consider redrawing based on Friday's high. Regardless, it is a bullish continuation pattern and further upside is expected. A close below 167 would call for a re-evaluation. XLK also has a pennant working.
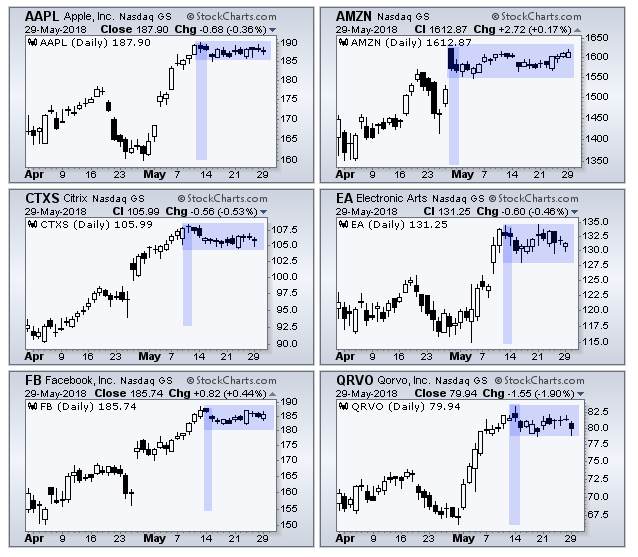
Six Flags over the Nasdaq 100
Yeah, I couldn't resist the cheeky headline. The next image shows six CandleGlance charts with six stocks forming flag consolidations. Chartists could draw lines and some may be contracting or falling, and some of these flags would then look more like pennants or wedges. Regardless of the exact pattern, all six show consolidations after sharp advances. The expectation is for an upside breakout and continuation, but expectations don't always pan out. Chartists can, therefore, watch the lower boundaries (support) for a break that would negate the patterns.
Strike One on SPY
The SPY is clearly the problem child in the stock market, and a big one at that. This index accounts for some 80% of the total investable US equity market and is the most widely followed benchmark. While small-caps and large-techs held up, SPY broke below the mid May lows with a move below 270. This means it is possible that a rising wedge formed over the last two months and this is typically a bearish continuation pattern.
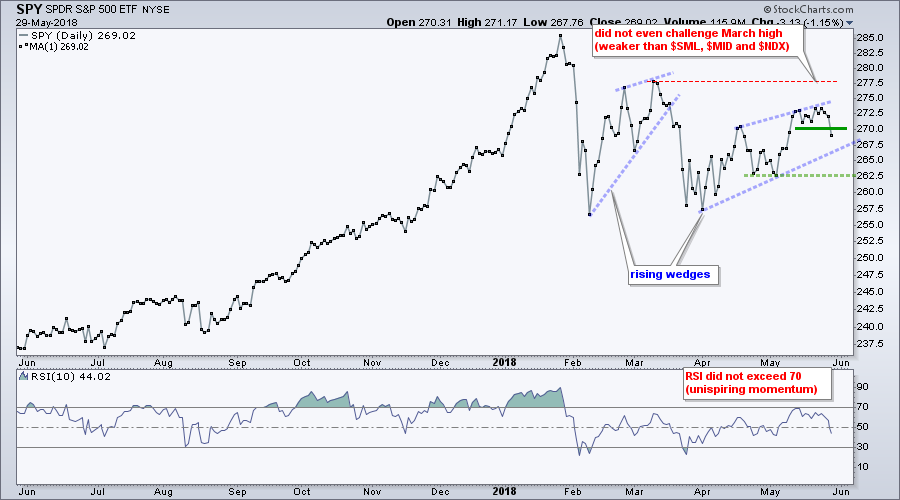
The short-term support break is strike one on the bulls. A break below the lower trend line would be strike two and a break below the early May low would be strike three. Watch for a quick move back above 270 to set a short-term bear trap and perhaps a new support level to watch.
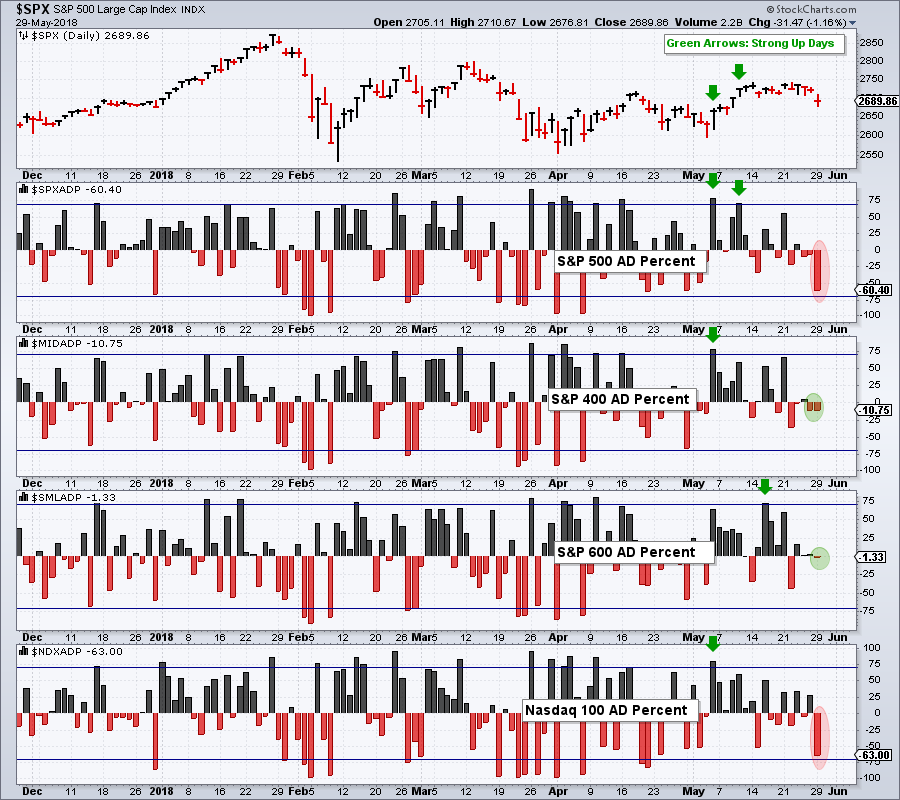
Selling Pressure Concentrated in Large-caps
Even though SPY is dragging its feet, May is still more bullish than bearish. The next chart shows AD Percent for the S&P 500, S&P Mid-Cap 400, S&P Small-Cap 600 and Nasdaq 100. AD Percent = (Advances - Declines) / Total Issues. This shows net advances as a percentage and allows us to compare the values. A move above +70% shows broad upside participation (green arrows), while a move below -70% shows broad downside participation.
Focusing on May, we can see moves above +70% in all indexes and two in the S&P 500. These were in the first half of May. Yesterday's selling pressure was clearly focused in the S&P 500 because AD Percent hit -60.4% (red oval). In contrast, the S&P Mid-Cap 400 dipped to -10.75% and S&P Small-Cap 600 was barely negative (-1.63%). Small-caps clearly held up the best. Overall, we have yet to see plunges below -70% and selling pressure has been contained thus far.
On Trend with Arthur Hill
On Trend is my show on StockCharts TV. Available to everyone, this show airs every Tuesday at 10:30 AM and is then archived on our Youtube Channel.
Highlights from On Trend for Tuesday, May 29th
- What do Trendlines Actually Measure
- Measuring Risk On/Off (Dollar, Gold, Yen, Treasuries)
- Euro Breaks Down and Yen Bounces
- Gold Becomes Oversold within an Uptrend
- Italy and Spain Lead Europe Lower (international index symbols)
- QQQ, Top QQQ Stocks, XLF and XLV
Plan Your Trade and Trade Your Plan.
- Arthur Hill, CMT
Senior Technical Analyst, StockCharts.com
Book: Define the Trend and Trade the Trend
Twitter: Follow @ArthurHill


