- A Bullish Breadth Thrust, but...
- S&P 500 Toys with Triangle Breakout
- June can be a Rough Month
- Seasonality and the Turn of the Month
- QQQ Holds Up better than SPY
- Small-caps Hold Breakout
- XLK and XLY Hold Up the S&P 500
- Mind the Gap in XLF
- XLI Falls after Breakout
- XLV Fails at Resistance
- Treasury Bond ETFs Challenge Resistance
- German 10-yr Hits 52-week Low
 Stocks turned a bit volatile this week with a big decline on Tuesday, big recovery on Wednesday and modest decline on Thursday. The string is set to continue because stocks are pointing to a strong open on Friday. The ability to recover after Tuesday's sharp decline is positive, but large-caps remains the Achilles heel of the stock market, and a big one at that. S&P 500 new highs are dragging, three of the five big sectors are short of breakouts and safe-haven bonds surged over the last two weeks. It is a good thing the tech sector account for 26% of the S&P 500 because the index would be seriously struggling without it.
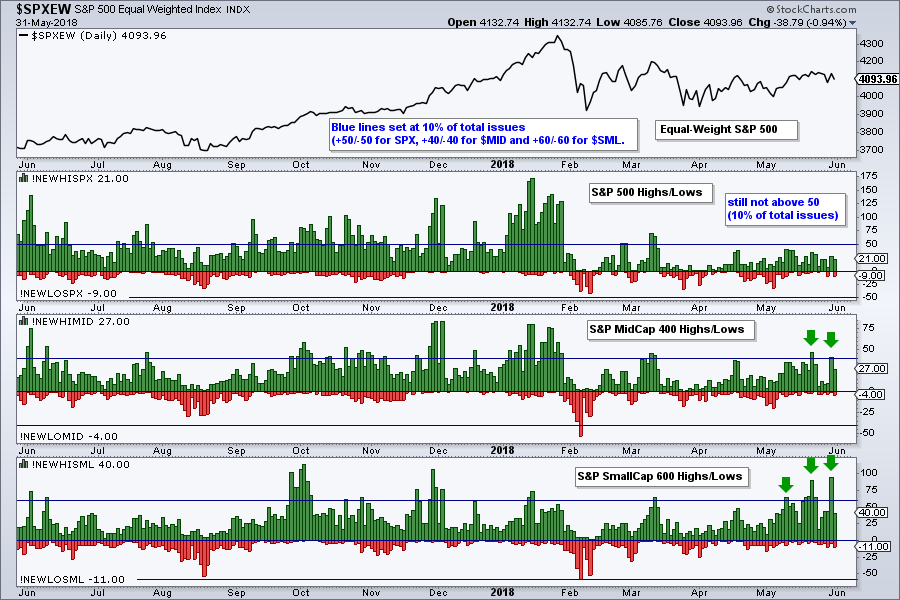
Large-cap New Highs Continue to Dwindle
New highs in the S&P 500 have not been above 50, which is 10% of the index, since mid March. This reflects a lack of leadership during the April-May advance. A move above 50 would show an expansion of leadership and provide the impetus for the S&P 500 to catch up with small-caps. The S&P Mid-Cap 400 is stronger than the S&P 500, but not by much. The S&P Small-Cap 600 is the clear leader with new highs exceeding 60 several times in May.
A Bullish Breadth Thrust, but...
I highlighted AD Percent on Tuesday and noted that the bulls still had the edge in May because the big down days did not exceed -70%. The bulls reinforced this edge with a breadth thrust on Wednesday. The chart below shows AD Percent for the S&P 500 and S&P Mid-Cap 400 exceeding +70%, while AD Percent for S&P Mid-Cap 600 reached 69.83%.
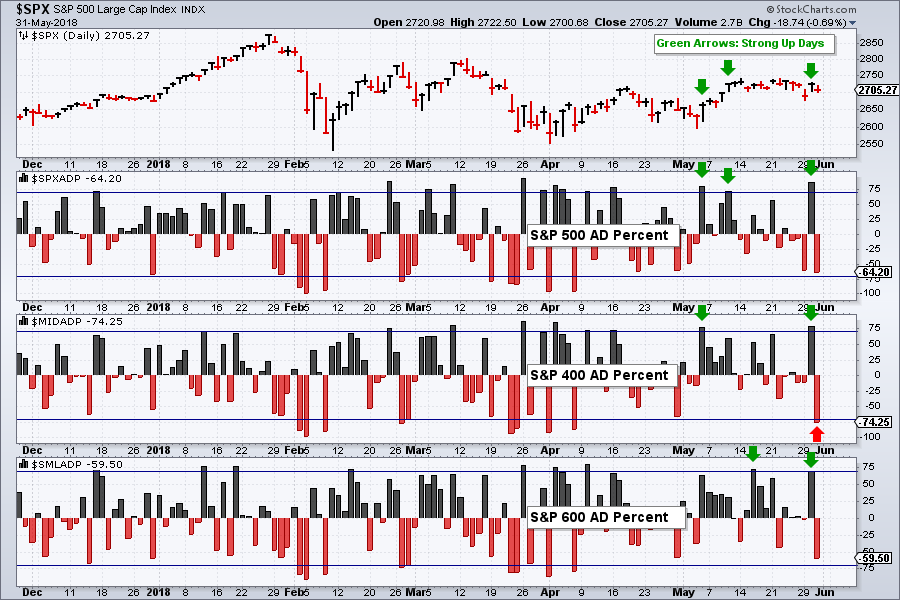
These bullish breadth thrusts, however, were followed by a bearish breadth thrust in the S&P Mid-Cap 400 and strong negative breadth in the S&P 500 and S&P Small-Cap 600. Talk about a fickle market. Overall, I will still give these breadth indicators a bullish bias until we see bearish breadth thrusts in the S&P 500 and S&P Small-Cap 600.
S&P 500 Toys with Triangle Breakout
The next chart shows the S&P 500 with the triangle line and two red resistance lines marking the breakout zone. The index was holding above this zone for the most part, but fell sharply on Tuesday and closed below 270. The index did, however, hold its flat 50-day SMA and the breakout level near 2675.
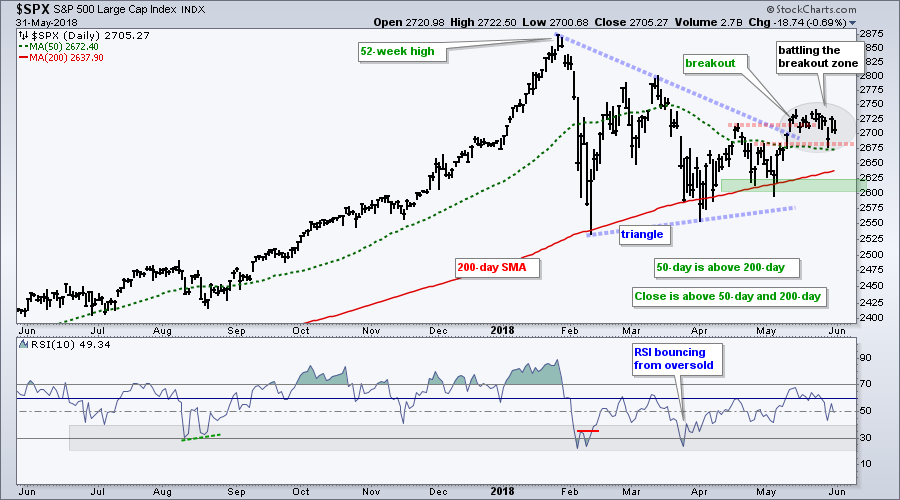
As noted on Wednesday, Tuesday's decline is strike one against the bulls. I would use the 50-day SMA for strike two. A close below 2670 would break the 50-day and the wedge line put forth in Wednesday's commentary. A close below 2600 would trigger strike three and the bulls were be out. Before getting too bearish, keep in mind that the bulls are still at bat and only have one strike right now.
Seasonality and the Turn of the Month
The recovery from Tuesday's sharp decline was impressive and could be part of the turn-of-the-month seasonal bias. As noted in this System Trader article in March, the last four days of the month and first four days (eight total) have a strong bullish bias. Over the last 24 years, SPY was up 66% of the time with an average gain of 2.15% over this eight day period.
The turn of the month bias will soon give way to the worst four months of the year. Most of us are familiar with the best six months strategy. The S&P 500 outperforms from November to April and underperforms from May to October. Hence, the term “sell in May and go away”.
I tested different combinations and found that the two cycles are eight months (best) and four months (worst). The best eight months runs from October to May and the worst four months runs from June to September, which includes the dog days of summer.
Over the last 24 years, if one bought SPY on October 1st and sold on June 1st (best 8 months), the Compound Annual Return would be around 10% (9.97% to be exact). There were 21 winning periods and 3 losing periods.
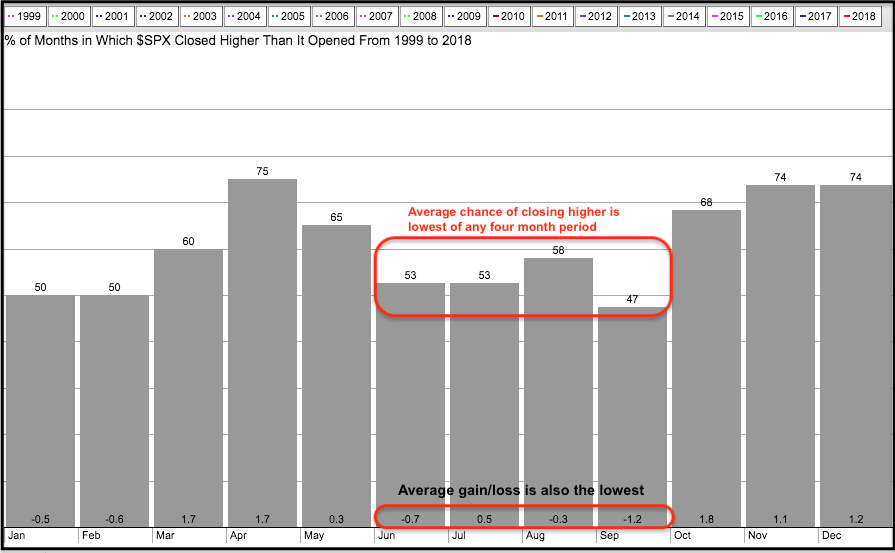
Conversely, those buying on June 1st and selling on October 1st (worst 4 months) would see a -.39% Compound Annual Return. This Compound Annual Return is negative despite the fact that the index closed higher 17 times and lower 7 times. The negative return stems from big losses in 2001, 2002, 2008 and 2011 (15-22%).
Seasonality is very tricky and I think it is best to simply watch the chart. Put seasonality on the back burner and only consider it when the chart confirms. In other words, a break down in the S&P 500 would carry more weight when seasonality is unfavorable.
Here is Ryan Detrick's take in a CNBC video: June is a historically weak month for the S&P 500, but Ryan Detrick of LPL Financial says this year looks a little different.
QQQ Holds Up better than SPY
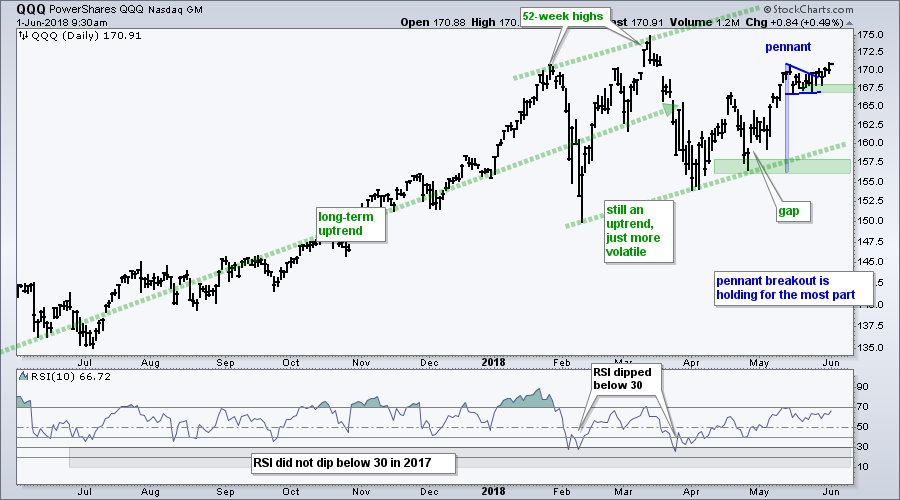
The Nasdaq 100 ETF (QQQ) held up quite well during Tuesday's selling pressure and did not break short-term support. There were a few dips into the pennant zone, but the ETF managed to recover by the close. Thus, the pennant breakout remains in play and I will mark support at 167 (closing basis). The following $NDX stocks hit new highs this week: ADBE, ADI, ADP, ALGN, CSX, ILMN, INTC, INTU, JBHT, MSFT, MU, NFLX, SIRI and TRIP (15!).
Small-caps Hold Breakout
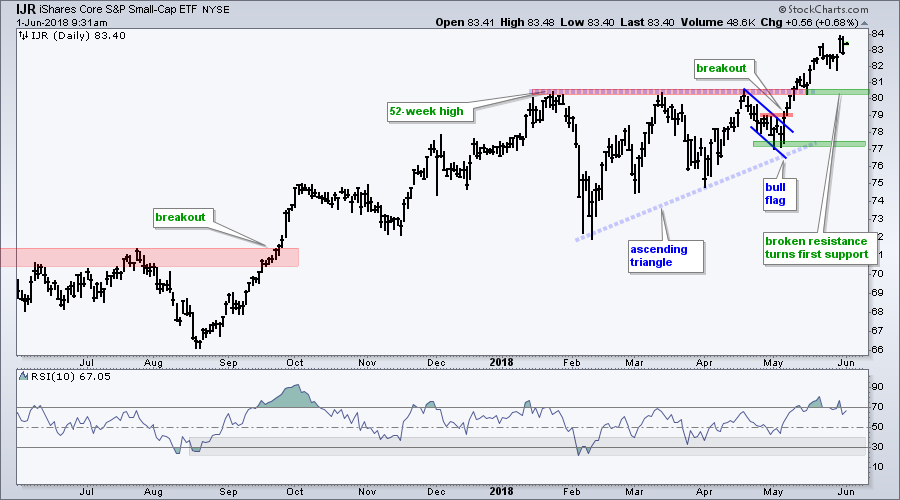
The S&P SmallCap iShares (IJR) also held up well on Tuesday and then surged to a new high on Wednesday. The ETF gave up most of these gains on Thursday and this just confirms the fickleness of the current market. At this point, the pop and drop is just noise and the bigger breakout remains in play. Broken resistance turns first support in the 80-81 area.
XLK and XLY Hold Up the S&P 500
The Technology SPDR (XLK) and the Consumer Discretionary SPDR (XLY) are holding up fine and keeping the S&P 500 SPDR afloat. Note that these two sectors account for around 39% of the S&P 500 SPDR (SPY).
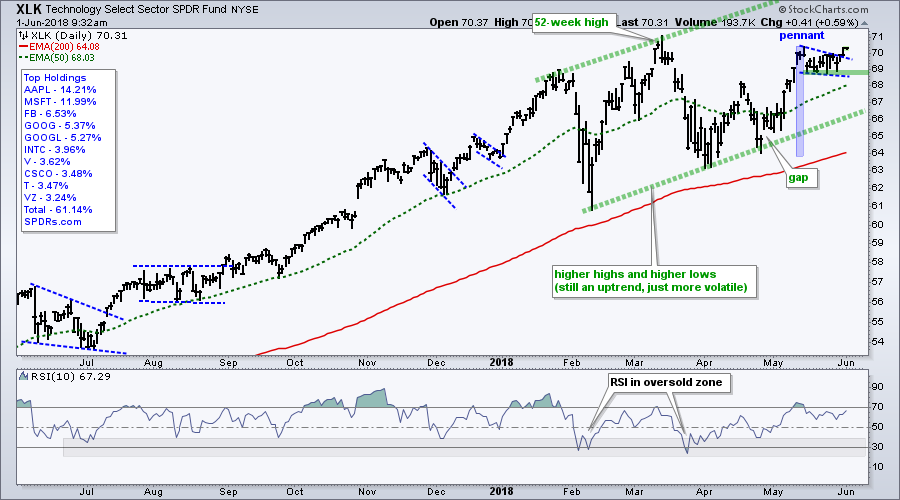
As with QQQ above, the chart below shows XLK with a long-term uptrend and a pennant breakout, albeit a tentative breakout. The pennant lows mark first support and a break would reverse the short-term upswing.
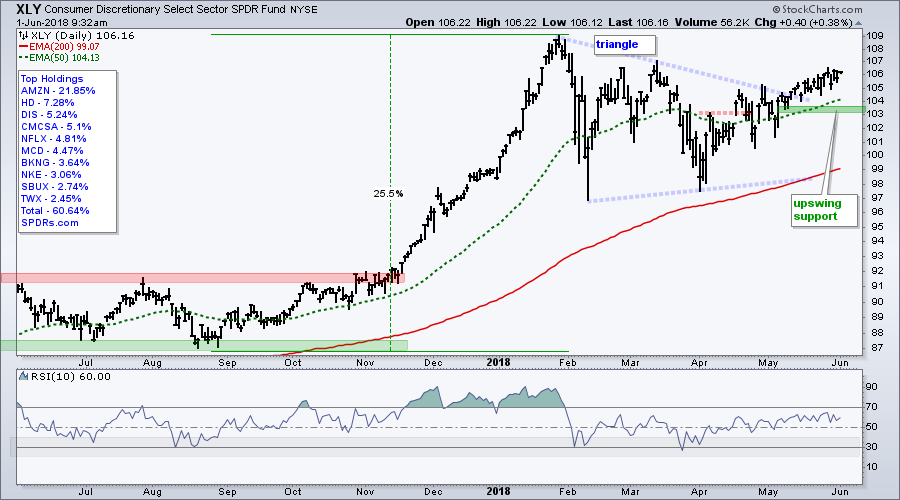
The next chart shows the Consumer Discretionary SPDR (XLY) working its way above the triangle line. It is not the most explosive of breakouts, but the trend is up and AMZN hit a new (closing) high this week (not an intraday high). I am marking upswing support at 103.
Mind the Gap in XLF
The next three sectors account for around 38% of the S&P 500 SPDR. The Financials SPDR (XLF) weighs in at 14.23%, the Health Care SPDR (XLV) accounts for 13.91% and the Industrials SPDR (XLI) is 9.91%. These three are weighing on the broader market and this is why SPY is going nowhere.
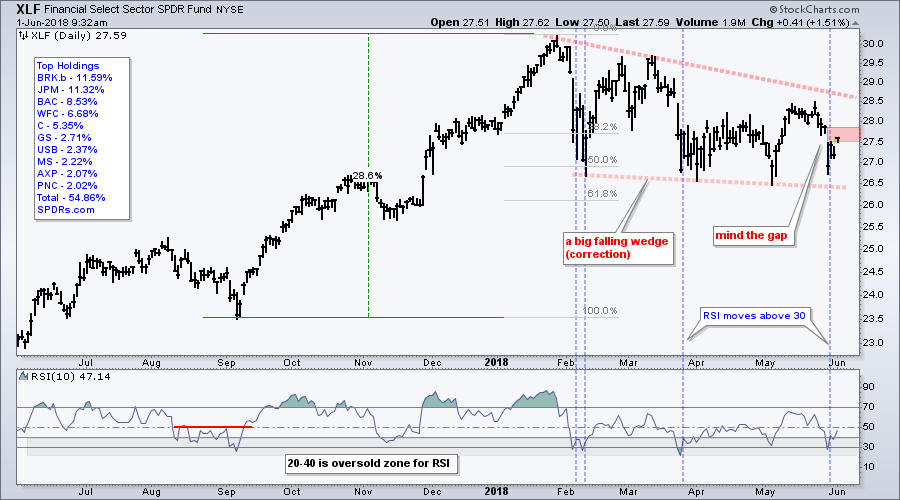
The first chart shows XLF plunging with a gap down on Tuesday. The ETF managed to firm the last two days, but the gap and plunge remain. On the positive side, RSI moved back above 30 for a bullish mean-reversion signal. Price-wise, look for XLF to fill the gap and close above 28 to regain the bullish edge.
XLI Falls after Breakout
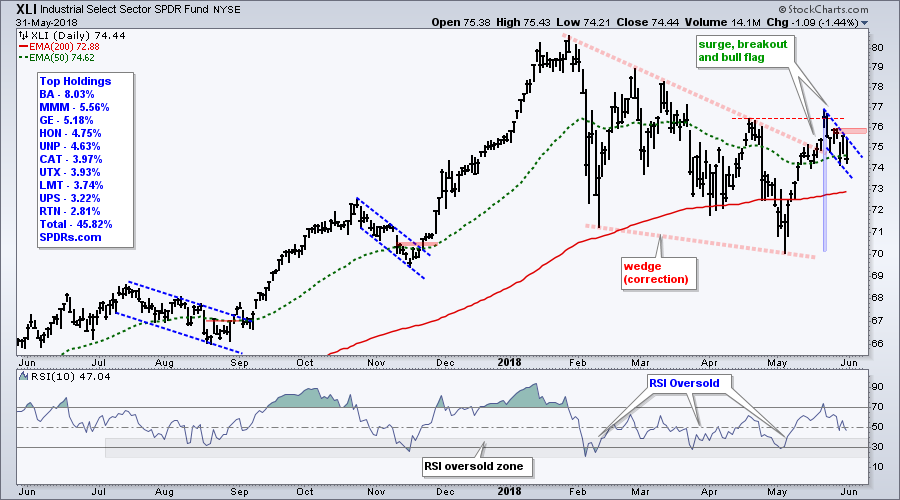
The next chart shows XLI with a breakout surge in late May and a plunge the last six days. This could be just a bull flag after a sharp surge. Look for a break above 76 to trigger a bullish signal.
XLV Fails at Resistance
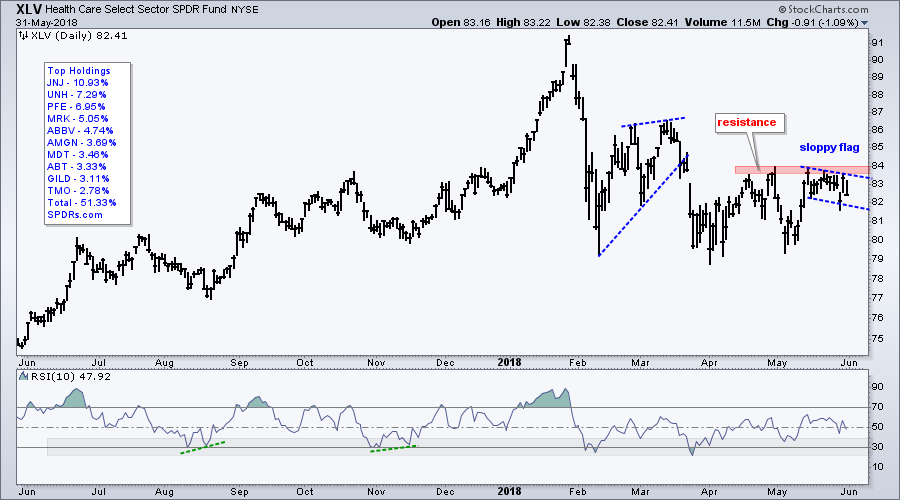
The next chart shows XLF surging to resistance in mid May and then working its way lower the last two weeks. The ETF recovered after Tuesday's plunge, but did not follow through and break resistance. A break above 84 is needed to reverse the downtrend in XLV.
The five sectors just covered account for 77% of the market and will tip the balance. Watch XLK and XLY for breakdowns to tilt the balance to the bears. Watch XLF, XLI and XLK for upside breakouts that would tilt the balance to the bulls. It only takes one to tilt the balance either way.
Treasury Bond ETFs Challenge Resistance
The 7-10 YR T-Bond ETF (IEF) and the 20+ YR T-Bond ETF (TLT) surged with the biggest nine-day advance since early July 2017. Despite the big move, the long-term trend is down for both. Even so, both are near their moment-of-truth and further strength could trigger upside breakouts. IEF is near resistance from the early April high, while TLT is near resistance from broken support and the early April high.
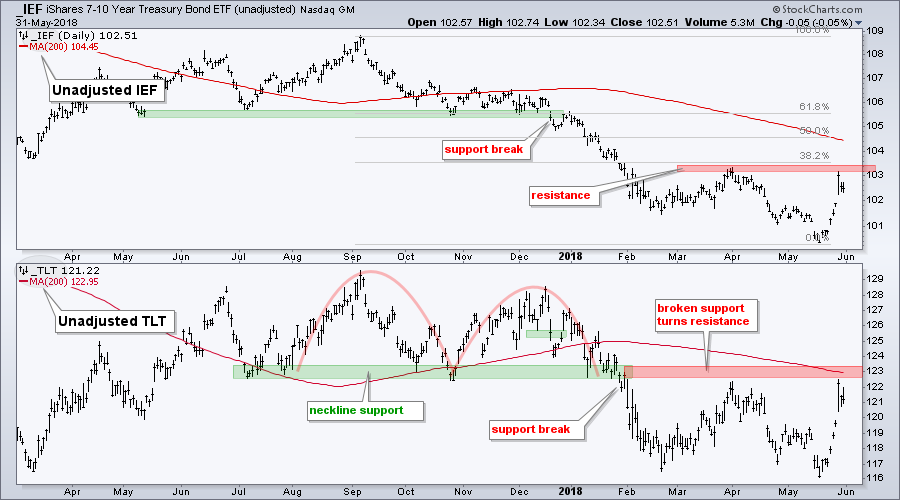
The bond market is often considered smarter than the equity market so we should pay attention. Further strength in bonds would show money moving into safe-havens and this would be negative for risk assets, such as stocks.
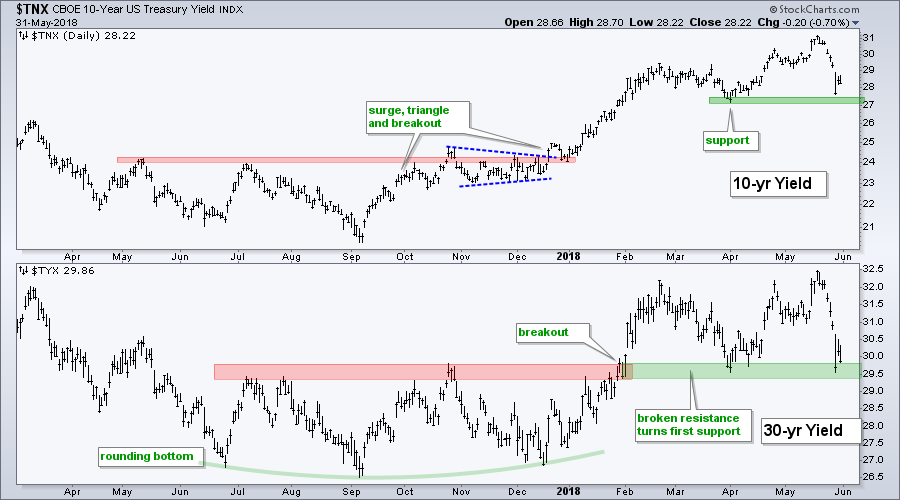
The next chart shows the 10-yr T-Yield ($TNX) and 30-yr T-Yield ($TYX) for reference. Support breaks and further declines in yields would be negative for banks, but positive for utilities and REITs.
German 10-yr Hits 52-week Low
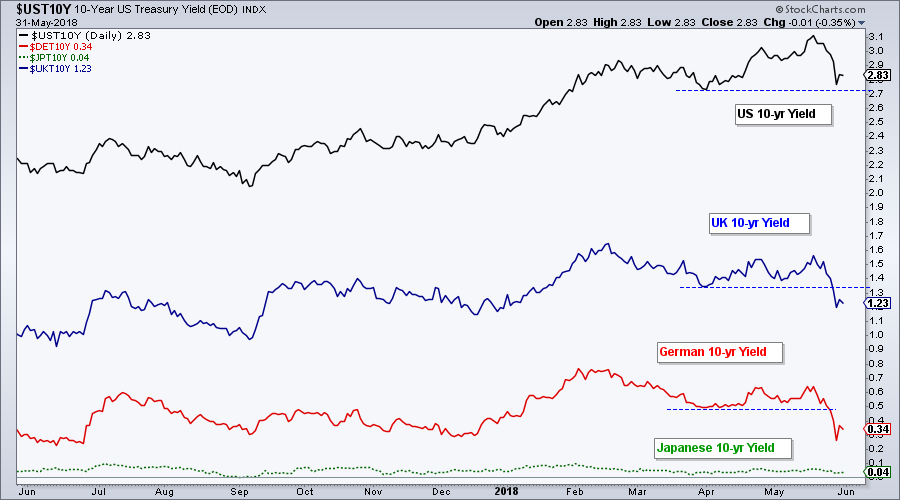
The next chart shows the 10-yr T-Yields for the US, UK, Germany and Japan. Notice that the UK 10-yr (blue) broke below the early April low and the German 10-yr moved to a 52-week low this week. This means money moved into German Bunds, which are safe-haven assets. This is not a vote of confidence for the European economy or European banks.
Notes from the Art's Charts ChartList
- The Internet ETF (FDN) is the strongest tech-related ETF with a new high this week.
- The Broker-Dealer iShares (IAI) and Regional Bank SPDR (KRE) are still in uptrends, but both got spooked this week with sharp declines.
- The Semiconductor iShares (SOXX) held its pennant breakout.
- The Transport iShares (IYT) is consolidating near the breakout zone.
- The Biotech iShares (IBB) and the Biotech SPDR (XBI) broke out of small consolidations.
- The Agribusiness ETF (MOO) could be forming a bull flag.
- The Copper Miners ETF (COPX) is at support as RSI moves back above 30.
- The Steel ETF (SLX) has a mean-reversion setup working with downswing resistance set at 49.
Plan Your Trade and Trade Your Plan.
- Arthur Hill, CMT
Senior Technical Analyst, StockCharts.com
Book: Define the Trend and Trade the Trend
Twitter: Follow @ArthurHill


