- SPX New Highs Continue to Drag.
- Triangle Breakout Holds.
- Bulls and Bears Fight to Go Nowhere.
- Watching the Swing within the Wedge.
- IJR Holds above Breakout Zone.
- QQQ and XLK Form Tight Consolidations.
- XLF Stalls Near April High.
- XLI Stays Strong as XLV Hits Make-or-Break Level.
- Semis are Leading and Biotechs Stall after Surge.
- Notes from the Art's Charts ChartList.
 As Divided as Ever...
Stocks went nowhere the last two weeks as the S&P 500 traded within a 40 point range the last ten days. This is around 1.5% of Thursday's close and marks a very tight range. Range trading is nothing new because the S&P 500 has been stuck in a range the entire year, and this range is narrowing.
Outside of small-caps and a few groups, it's been a frustrating year for bulls and bears as neither can hold the upper hand for long. The leadership groups are small-caps, healthcare providers (IHF), medical devices (IHI), regional banks (KRE) and internet (FDN) because they recorded 52-week highs over the past week. Also note that five of the nine small-cap sectors hit new highs (PSCD, PSCE, PSCF, PSCH, PSCI).
Yesterday marked the 100th day of trading in 2018 and the market is quite split internally as well. I ran a little scan to count the winners and losers in the S&P 500, S&P Mid-Cap 400 and S&P Small-Cap 600. For reference, $SPX is up 2% in 2018, $SML is up 7.35% and $MID is up 2.68%.
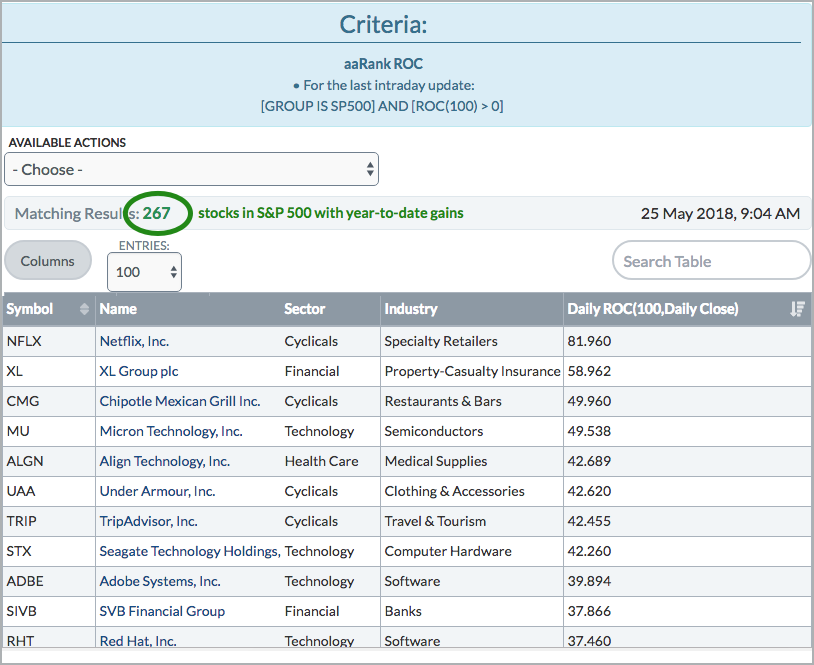
267 stocks (53.4%) in the S&P 500 are up year-to-date, while 219 stocks (54.75%) in the S&P Mid-Cap 400 are up and 366 stocks (61%) in the S&P Small-Cap 600 are up. Put another way, some 45% of stocks in $SPX and $MID are down year-to-date. $SML shows more external and internal strength, but it is not overwhelming.
These splits mean it is important to focus on strength and avoid weakness. In other words, it is a stock/ETF picker’s market because we have yet to get a tide that lifts all boats, or even 75% of them.
SPX New Highs Continue to Drag
S&P 600 High-Low% ($SMLHLP) and S&P 400 High-Low% ($MIDHLP) expanded this week, but S&P 500 High-Low% ($SPXHLP) remained lethargic. $SML High-Low Percent surged to +15% and small-caps are clearly leading. $MID High-Low Percent surged above +10% to join the party, but $SPX High-Low Percent remains stuck in single digits (<10%).
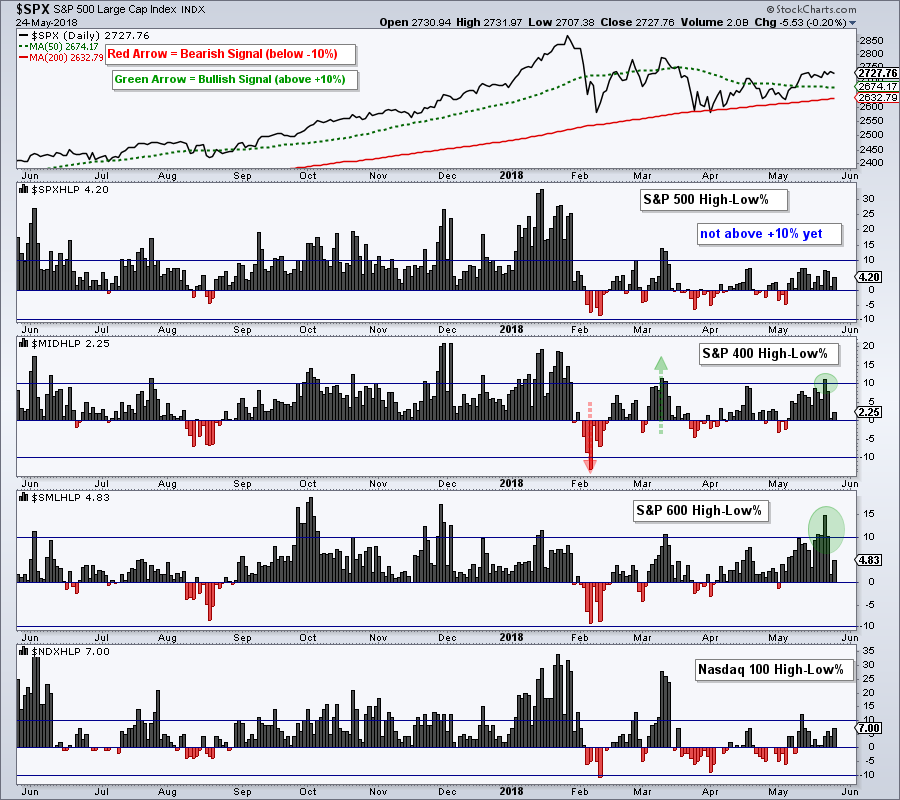
Even though I am bullish on stocks overall, lack of leadership within large-caps
is an issue that needs to be resolved with an expansion in new highs.
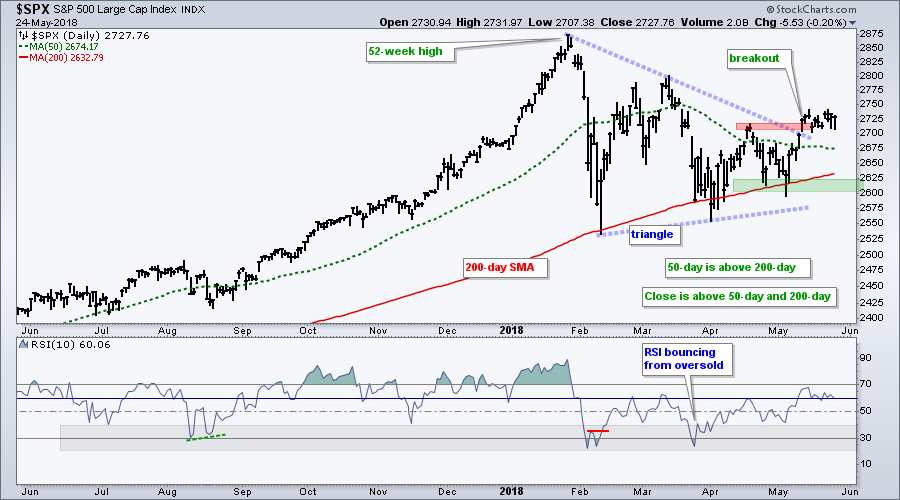
Triangle Breakout Holds
My base case remains bullish for the S&P 500, and the stock market in general. The long-term trend is up, the index broke out of a triangle consolidation and stalled after this breakout. The breakout is largely holding and remains bullish as long as it holds. Overall, this breakout signals a continuation of the prior advance, which was from November 2016 to January 2018. Despite the lack of new highs, the projection is for new highs in the coming weeks and months. Long-term support is set at 2600 for now.
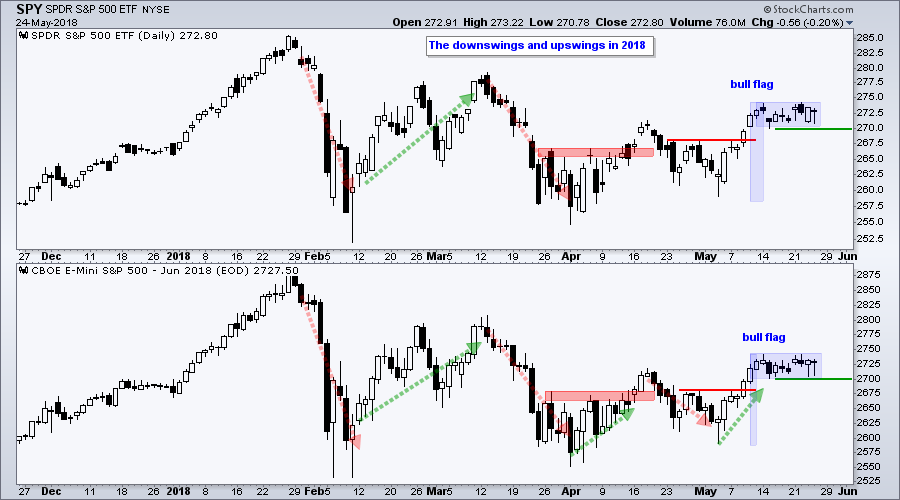
Bulls and Bears Fight to a Draw
You gotta hand it to the bulls, and the Houston Rockets for that matter! SPY dipped below 271 with rather strong selling pressure early Wednesday and Thursday. The ETF rallied back both times to close above 272.5 and deny the bears a short-term support break.
The chart below shows SPY and the June E-mini over the last six months. The current swing is up with bull flags taking shape. A break above the flag highs would argue for a continuation higher, while a break below the flag lows would be short-term bearish (270 for SPY and 2700 for the E-mini).
Watching the Swing within the Wedge
The next chart shows close-only prices and a rising wedge in play. The triangle and short-term upswings on the prior charts remain my base case, but a break below short-term support would call for a re-evaluation and put the rising wedge in play.
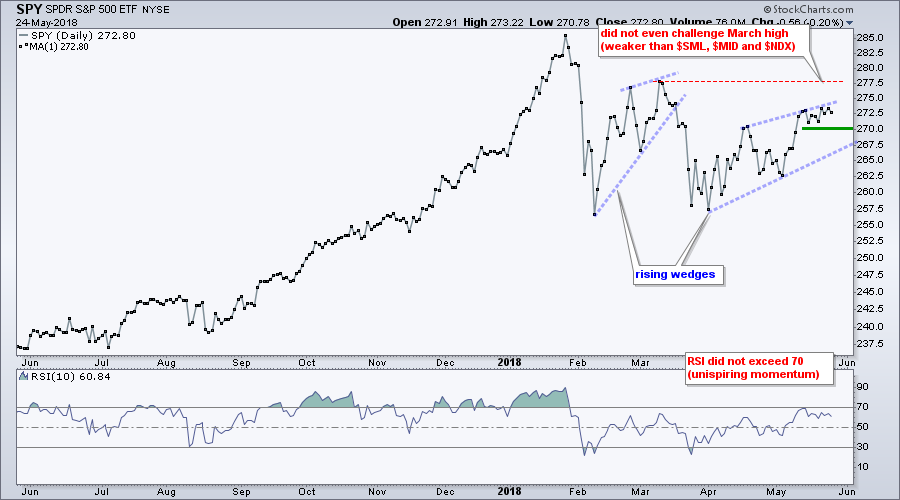
A rising wedge is a bearish continuation pattern and this is the second one in the last few months. The trend is up as long as it rises and confirmation is required for this pattern to actually be bearish. A close below 270 would reverse the swing within the pattern and this would be the first sign of trouble.
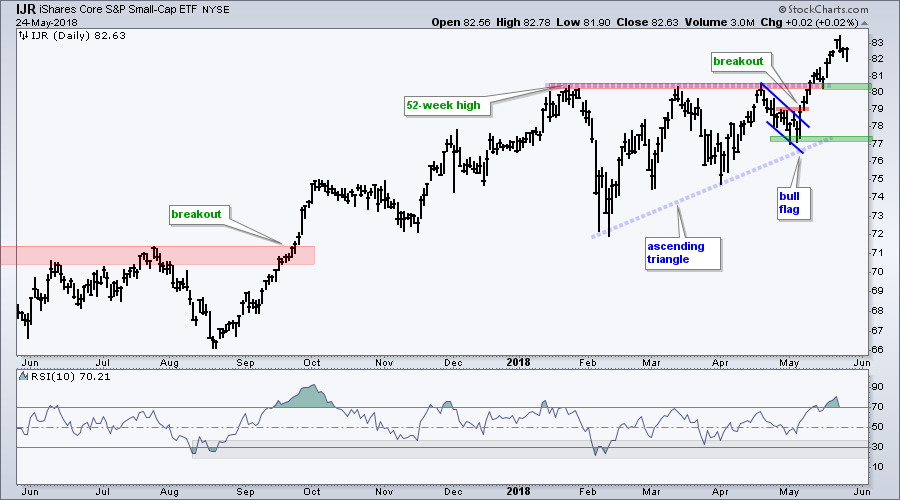
IJR Holds above Breakout Zone
Small-caps gave up a little ground with a decline on Tuesday, but the S&P SmallCap iShares (IJR) remains the leader and well above the breakout zone. The breakout zone around 80.5 turns first support to watch should we get a pullback.
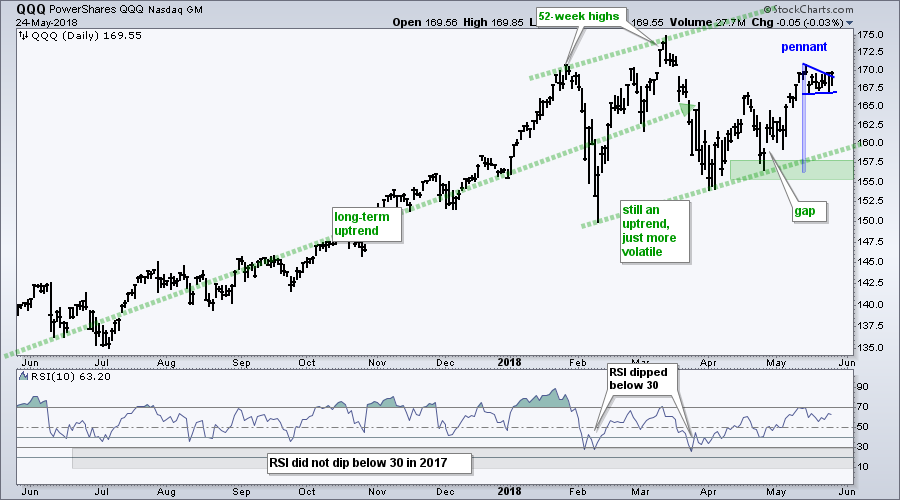
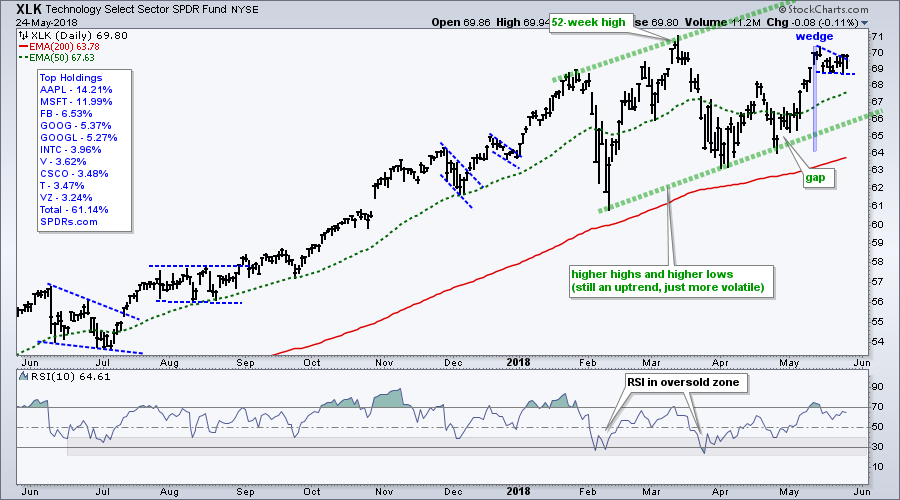
QQQ and XLK Form Tight Consolidations
The QQQ price chart is somewhere in between SPY and IJR - stronger than SPY, but not as strong as IJR. QQQ was dragging its feet Monday and Tuesday because it fell back after the morning gaps. This changed as the ETF closed strong on Wednesday and Thursday. It now looks like QQQ is breaking out of a small pennant and this is short-term bullish.
The next chart shows XLK with a small wedge, which is a bullish continuation pattern. The wedge represents a small correction after a sharp advance and XLK edged above the upper line on Thursday.
XLF Stalls Near April High
I drew a bull flag in the Financials SPDR (XLF) and got the old whipsaw as the ETF broke out and then dropped. The flag was quite tight and there was not a lot of room for error.
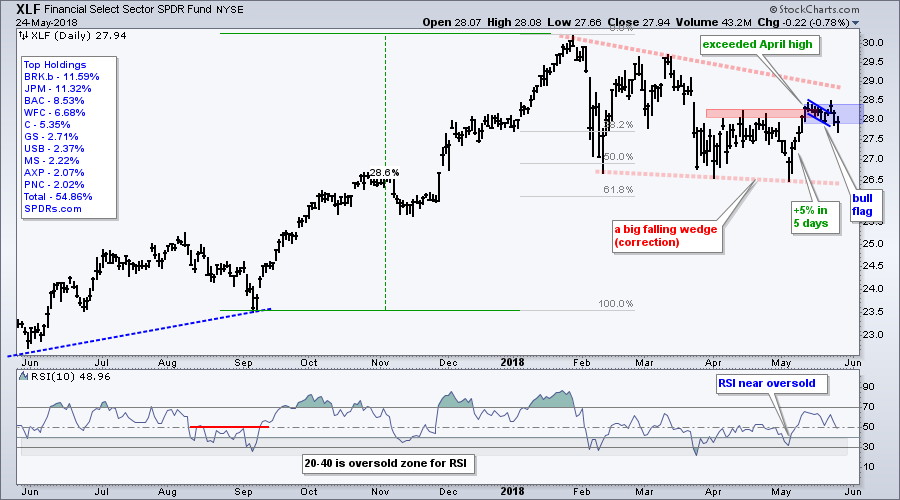
Now what? Well, I still think the glass is half full because XLF did exceed its April high with a strong surge in early May (5% in 5 days). The decline over the last ten days could still be part of the corrective process with the blue shading marking this consolidation. A close above 28.4 would trigger another breakout.
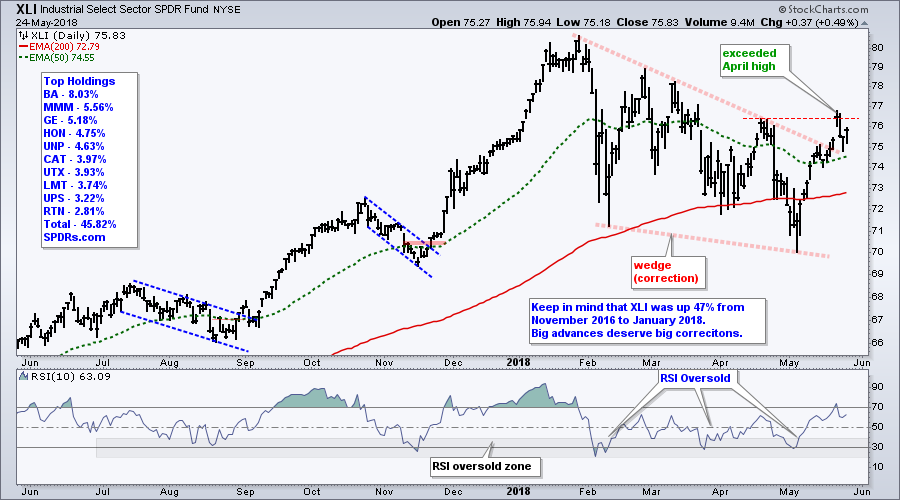
XLI Stays Strong
The Industrials SPDR (XLI) led the market from May 3rd to 21st with a 7+ percent surge. Note that XLI is the second best performing sector this month (XLK is tops). It is good to see industrials rebound so strongly and the price chart looks bullish. Notice that XLI broke out of a falling wedge that represented a big correction. This signals an end to the correction and a resumption of the bigger uptrend. XLK may seem short-term overextended, but I think we should view pullbacks as opportunities.
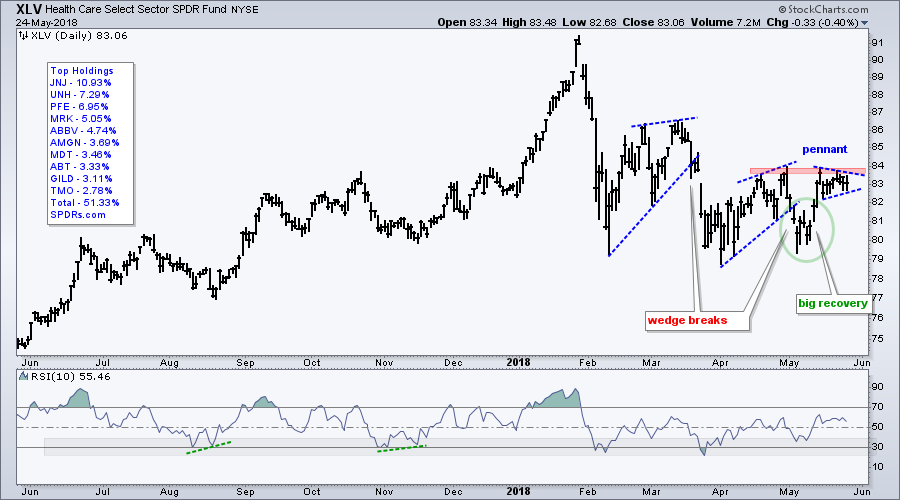
XLV Hits Make-or-Break Level
The Health Care SPDR (XLV), which is the third largest sector in the S&P 500 (13.85%) is at a make-or-break point. The ETF broke wedge support with a sharp decline in early May, but quickly firmed and surged back to the prior high in the 84 area. A pennant formed and this is a short-term bullish continuation pattern. Look for a breakout at 84 to turn bullish on healthcare again.
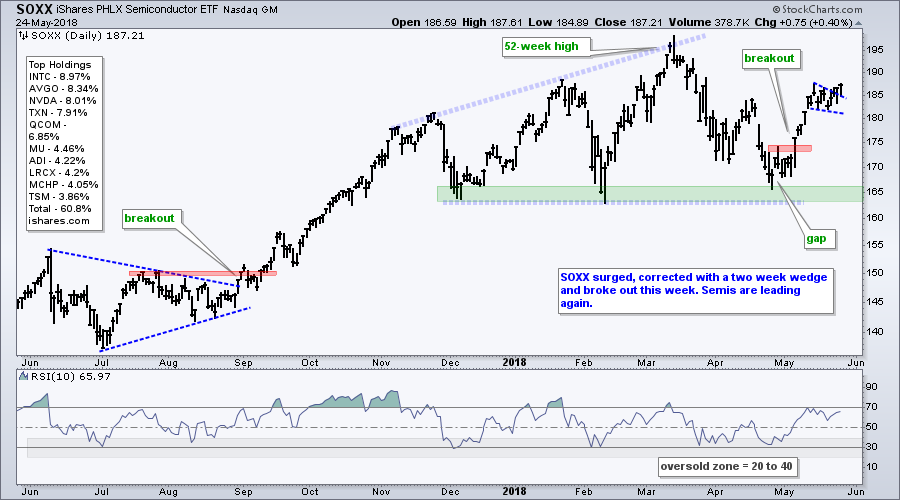
Semis are Leading
Lots of flags, pennants and wedges formed as the market stalled over the last two weeks. I am encouraged with the Semiconductor iShares (SOXX) because it broke out over the last two days and appears to be continuing its May surge. Notice that a small wedge/pennant formed after this surge and price exceeded the upper line. This argues for a challenge to the March highs and this is bullish for tech.
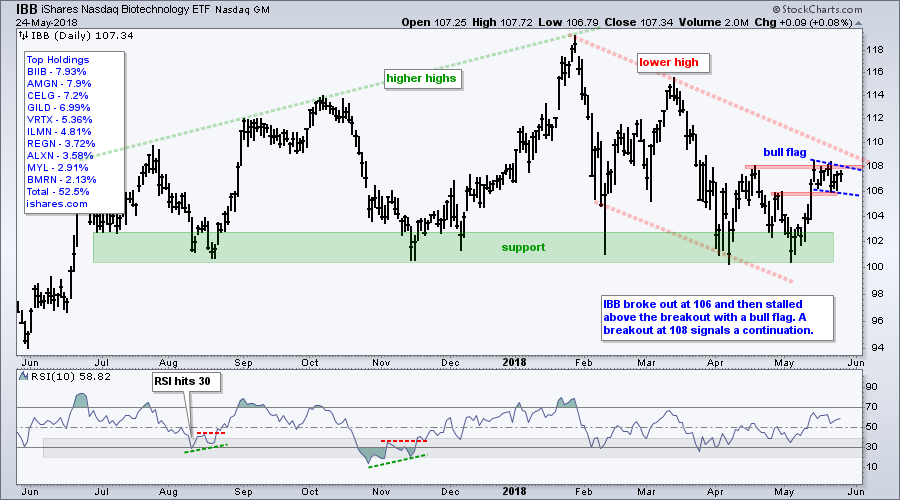
Biotechs Stall after Surge
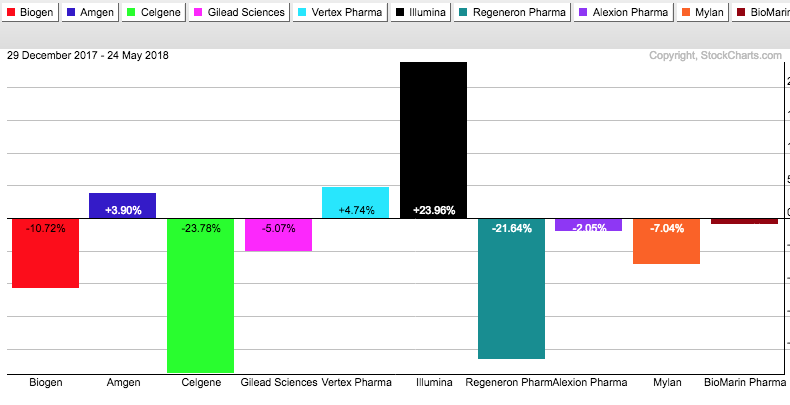
The Biotech iShares (IBB) represents big biotech stocks and many of these are struggling in 2018. Note that Biogen (BIIB) is down 10.72% year-to-date, while Celgene (CELG) and Regeneron (REGN) are down 20+ percent. Amgen (AMGN), Illumina (ILMN) and Vertex (VRTX) are the only three top holdings with year-to-date gains.
The chart shows IBB breaking first resistance at 106 and then stalling with a bull flag. The April high marks resistance at 108 and a breakout here would also confirm the bull flag. This could call for a continuation of the May surge and open the door to a bigger wedge breakout.
Notes from the Art's Charts ChartList
- The Cloud Computing ETF (SKYY), Cyber Security ETF (HACK) and Software iShares (IGV) hit new highs in mid May, fell back a little and firmed this week. They are in long-term uptrends and these uptrends could be poised to resume.
- The Internet ETF (FDN) formed a small ascending triangle over the last two weeks.
- The Semiconductor iShares (SOXX) broke out of a small wedge this week and semis are leading again.
- The Broker-Dealer iShares (IAI) is holding its triangle breakout.
- The Regional Bank SPDR (KRE) is leading with a new high this week.
- The Biotech iShares (IBB) formed a bull flag above its short-term breakout.
- The Medical Devices ETF (IHI) and HealthCare Providers ETF (IHF) hit new highs this week and are leading the market.
- The Copper Miners ETF (COPX) continues to struggle and remains in a trading range.
- The Metals & Mining SPDR (XME) broke out of a big falling wedge.
- Click here for the ChartList (updated Friday, May 25th)
Plan Your Trade and Trade Your Plan.
- Arthur Hill, CMT
Senior Technical Analyst, StockCharts.com
Book: Define the Trend and Trade the Trend
Twitter: Follow @ArthurHill


