- Biotech ETFs Near New Highs
- Fab Five Lead QQQ Higher.
- SOXX Turns Up within Triangle.
- A Mean-Reversion Setup for Analog Devices.
- Two Inside Days for Cisco.
- A Flag Breakout for ICE.
- Perkin Elmer Perks Up.
 ... IBB and XBI Near New Highs
... The Biotech iShares (IBB) surged over 15% the last ten weeks and is on the verge of a new high. It has been a wild ride in 2018 with the ETF exceeding 118 twice and dipping below 102 three times. At this point, IBB looks both short-term overbought and strong. Renewed vigor in large-cap biotechs is a positive for the group and the healthcare sector.
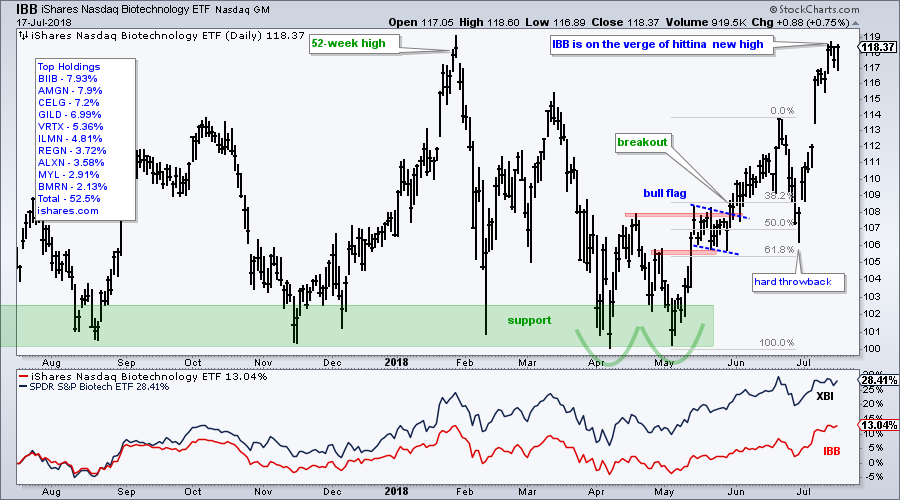
Despite this renewed vigor, IBB is still lagging the Biotech SPDR (XBI) over the past year. IBB is up 13% since late July and XBI is up more than double (28.4%). They are both up around 17% from the May low.
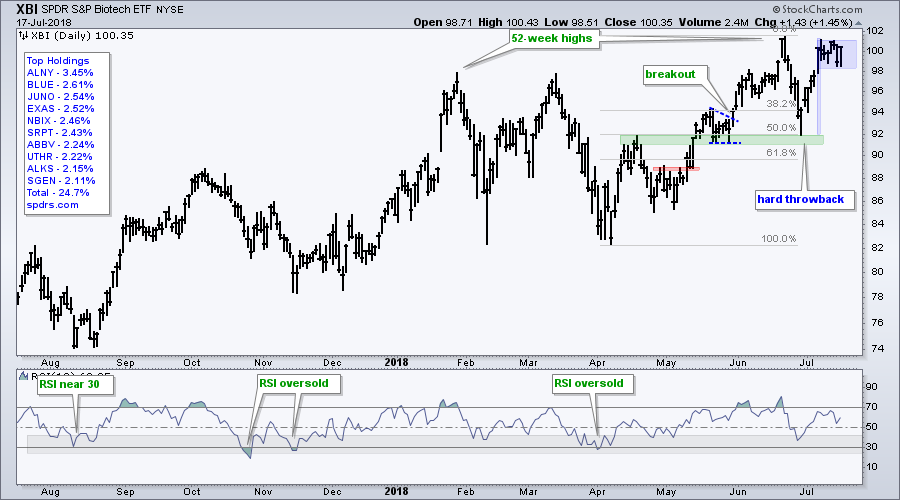
The next chart shows the Biotech SPDR (XBI) setting up with a bull flag. After a 52-week high in late June and hard throwback into early July, the ETF reversed near broken resistance and the 50% retracement. A flat flag formed the last seven days and an upside breakout would be short-term bullish.
Fab Five Lead QQQ Higher
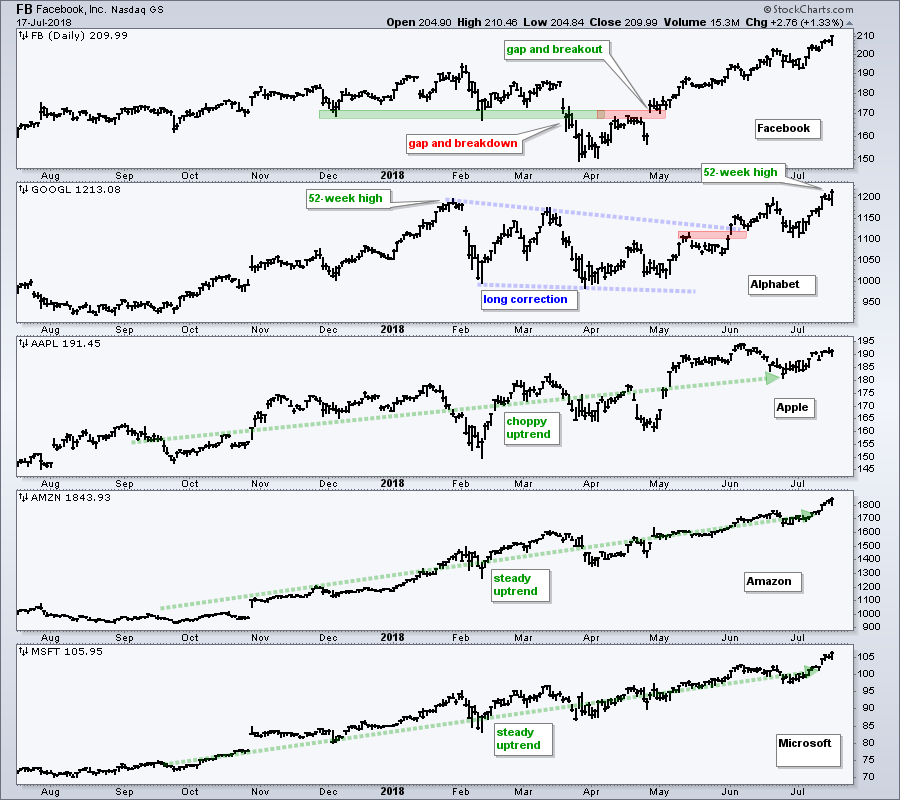
Led by the fab five, QQQ hit a 52-week high on Tuesday and continues to lead the major index ETFs. Note that Facebook (6.01%), Alphabet (9.31%), Apple (11.22%), Amazon (10.67%) and Microsoft (9.71%) account for 47% of QQQ. Four of the five hit new highs on Tuesday and Apple is within 2% of a new high. New highs are bullish and affirm the long-term trends in this stocks, and QQQ.
The chart below shows all five. I thought Facebook was broken after the March breakdown, but it proved me wrong with a gap and breakout in early May. The stock went on to record new highs in June and July. Alphabet broke out of a long consolidation in early June and hit new highs in late June and July. Apple is in a choppy uptrend with a series of higher highs and higher lows. Amazon and Microsoft are in steadier uptrends because the price ranges are a bit tighter.
SOXX Turns Up within Triangle
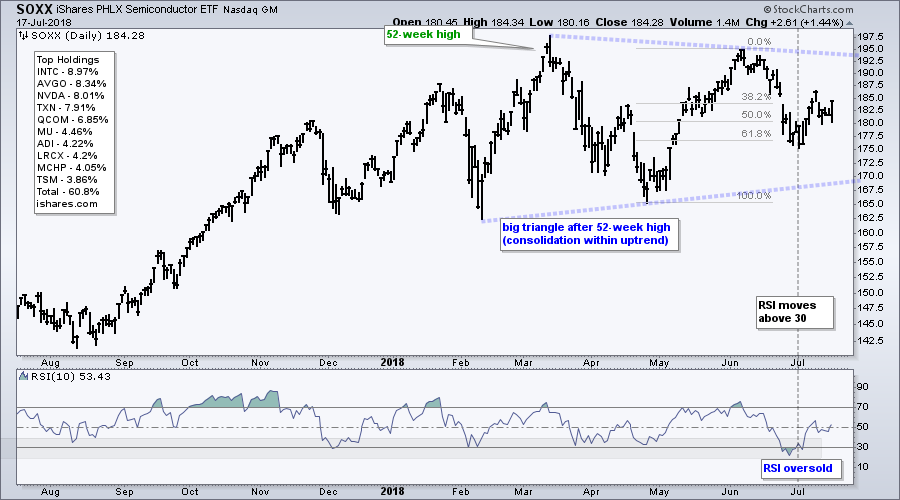
The Semiconductor iShares (SOXX) is lagging the other tech-related ETFs, but the pattern at work looks like a large triangle consolidation within a bigger uptrend. This makes it a big bullish continuation pattern. First and foremost, SOXX hit a 52-week high in March and the 50-day EMA is above the 200-day EMA (not shown). SOXX became short-term oversold in late June and RSI moved back above 30 on July 2nd. It looks like an upturn within the triangle is underway.
RSI(5) versus RSI(10)
I typically use RSI(5) for the major index ETFs (SPY, IJR, MDY, QQQ) and RSI(10) for stocks, sector ETFs and industry group ETFs. The major index ETFs are broad-based with 100 or more stocks so a more sensitive RSI makes sense. Sector ETFs, industry group ETFs and stocks trade different than broad indexes so I use RSI(10) for a little less sensitivity. The line shapes for both indicators look the same. but RSI(5) will cross the 30/70 level more often than RSI(10). Put them both on the chart and compare.
Stocks to Watch
It is earnings season so I tried to find some stocks that do not report in the next 1-2 weeks. The earnings date is posted on the chart, but you may want to double check. I use Zacks and IBD to find the earnings dates.
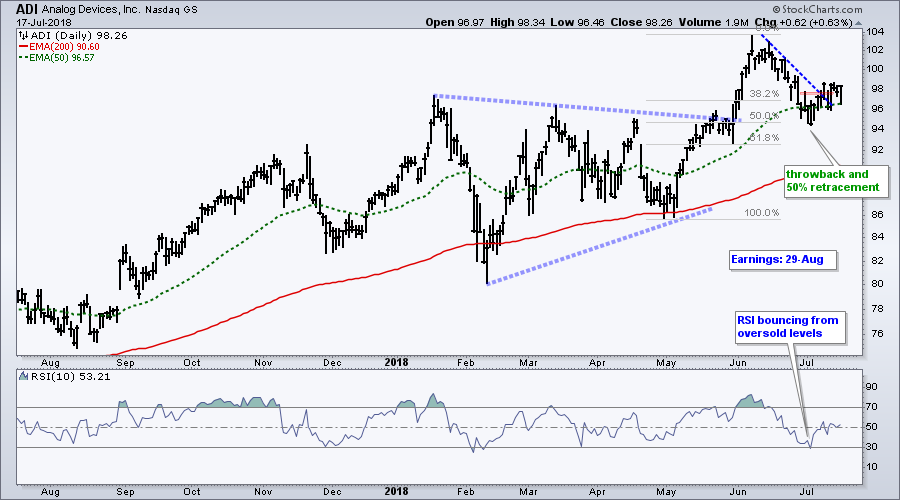
A Mean-Reversion Setup for Analog Devices
The first chart shows Analog Devices (ADI) with a triangle breakout, 52-week high and throwback that retraced 50% of the May-June advance. RSI became oversold during this throwback and recently moved back above 30. Thus, a mean-reversion setup is in play.
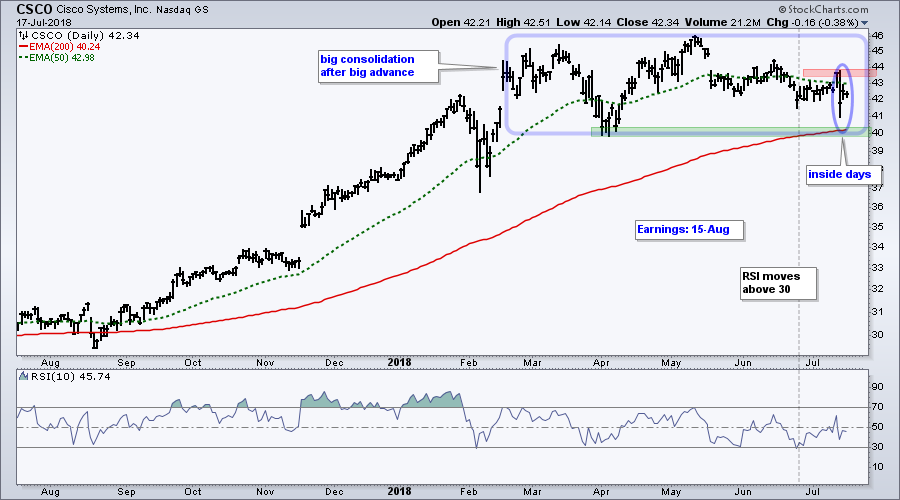
Two Inside Days for Cisco
Cisco is lagging its big tech brethren as it consolidates after a big advance. The long-term trend is still up and this could be a big rest before the next move. CSCO fell sharply last Friday and then stalled with inside days on Monday-Tuesday. These show indecision that could lead to a reversal. Watch 44 for an upside breakout.
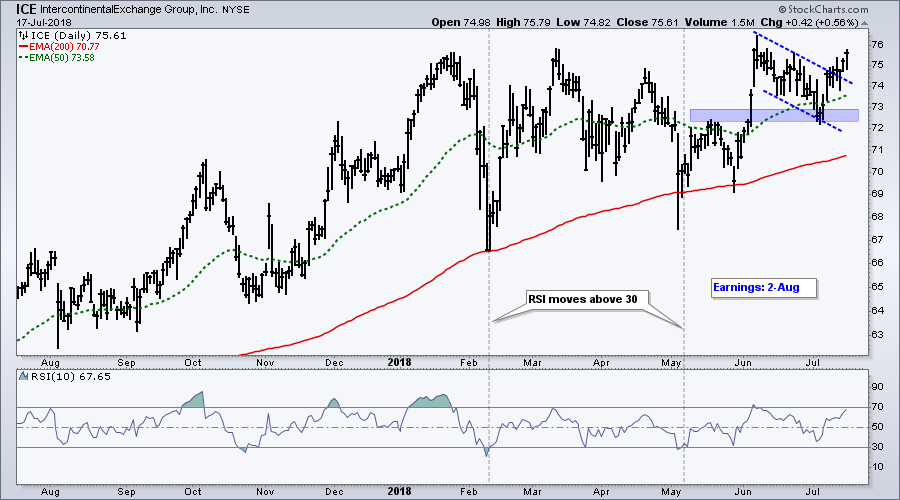
A Flag Breakout for ICE
IntercontinentalExchange Group (ICE) is breaking out of a flag formation and close to a new high.
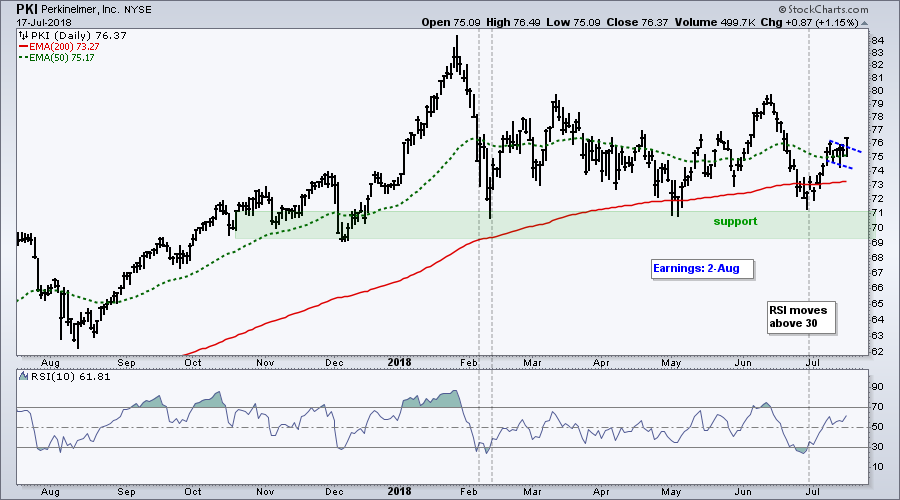
Perkin Elmer Perks Up
2018 has been a rough year for Perkin Elmer (PKI), but this healthcare stock bounced off support in late June, formed a small flag the prior five days and broke out on Tuesday. Also notice that RSI moved above 30 in late June.
On Trend on Youtube
Available to everyone On Trend with Arthur Hill airs Tuesdays at 10:30AM ET on StockCharts TV and repeats throughout the week at the same time. Each show is then archived on our Youtube channel.
Topics for Tuesday, July 17th:
- Index New Highs Still Dragging, but Net Bullish
- Tech, Staples and Healthcare Lead New High List
- Materials SPDR and Top Component Look Weak
- XLE Forms Bull Pattern as XES Hits Moment-of-truth
- Stocks to Watch (Big Banks and Big Healthcare)
- Click here to Watch
Questions, Comments or Feedback?
I cannot promise to response to all correspondence, but I will read it and take into under consideration. I greatly appreciate all feedback because it helps me improve the commentary and provides ideas for the future. Sorry, I do not take symbol requests.

Plan Your Trade and Trade Your Plan.
- Arthur Hill, CMT
Senior Technical Analyst, StockCharts.com
Book: Define the Trend and Trade the Trend
Twitter: Follow @ArthurHill


