- A Breadth Burst for the Finance Sector.
- Industrials and Finance Lead July Surge.
- Ranking by %Above 200-day EMA.
- Finding these Symbols.
 ... Signals from %Above Indicators
... The percentage of stocks above the 20-day EMA is a short-term breadth indicator that measures participation. StockCharts calculates and publishes this indicator for the major stock indexes and sectors. We also have the percent above 50-day EMA and 200-day EMA. The 20-day EMA is the shortest of the three and should be used to gauge short-term breadth.
The chart below shows S&P 500 %Above 20-day EMA (!GT20SPX) and the same indicator for the nine sector SPDRs. The horizontal lines are set at 70%, 50% and 30%. Chartists can use this indicator to identify short-term oversold conditions when it dips below 30% and reversals when it pops above 50%.
For example, the Technology SPDR has been one of the strongest sectors in 2018 and the second window shows the XLK %Above 20-day EMA (!GT20XLK) dipping below 30% four times this year. These dips signal a pullback that could present an opportunity to buy the dip. This indicator popped above 50% on July 5th.

The indicator is certainly not perfect and can be prone to whipsaws. This means chartists should also check the price chart for confirming signals. Elsewhere on the chart, notice that Consumer Discretionary %Above 20-day EMA (!GT20XLY) was the only one that did not dip below 30% from mid May to mid July (relative strength). The Finance %Above 20-day EMA (!GT20XLF) moved from 3% to 88% over the last three weeks. This amounts to an upside breadth thrust, which is bullish for the sector.
I really don't use the "overbought" level very much (70%). First, we are in a bull market and the 50-day EMA is above the 200-day EMA for eight of the nine sectors. The Consumer Staples SPDR (XLP) is the only sector with an active death cross. It does not make sense to look for bearish setups in uptrends, or in a bull market for that matter.
Industrials and Finance Lead July Surge
I created a ChartList with these indicators and then viewed the ChartList in Summary format. This view allows me to sort by the “Close” or “Change (Chg)” columns for ranking. The image below shows a sort by the close, which puts the strongest at the top and the weakest at the bottom. The Financials SPDR (XLF) is the strongest because 88% of its stocks are above the 20-day EMA. Elsewhere notice that the Industrials SPDR (XLI) moved into third place with a big gain (+14.29) on Wednesday. These two sectors have been lagging in 2018, but both are catching fire here in July.
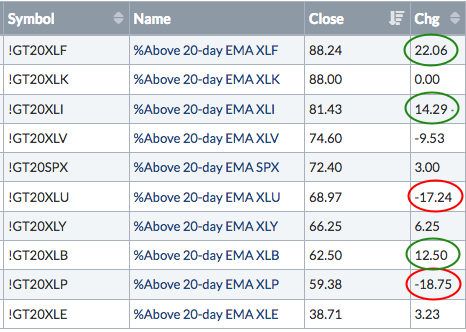
The red and green ovals highlight the big movers on Wednesday. In addition to finance and industrials, we also saw a big move in the Materials SPDR (XLB) as the %Above 20-day EMA increased 12.50 to 62.50%. Note that 12.5 represents the absolute change in the indicator’s value. The %Above 20-day EMA fell sharply for the Utilities SPDR (XLU) and the Consumer Staples SPDR (XLP) as money moved out of these two sectors.
Ranking by %Above 200-day EMA
Chartists can use the %Above 200-day EMA for a longer-term perspective. The table below shows this indicator for the S&P 500 and the nine sector SPDRs. Notice that utilities, technology and energy are leading. Finance is lagging that S&P 500 because its %Above 200-day EMA is less than that of the S&P 500. However, notice that the Finance %Above 200-day EMA (!GT200XLF) surged 13.24 to 70.59%. Again, this sector is perking up internally.

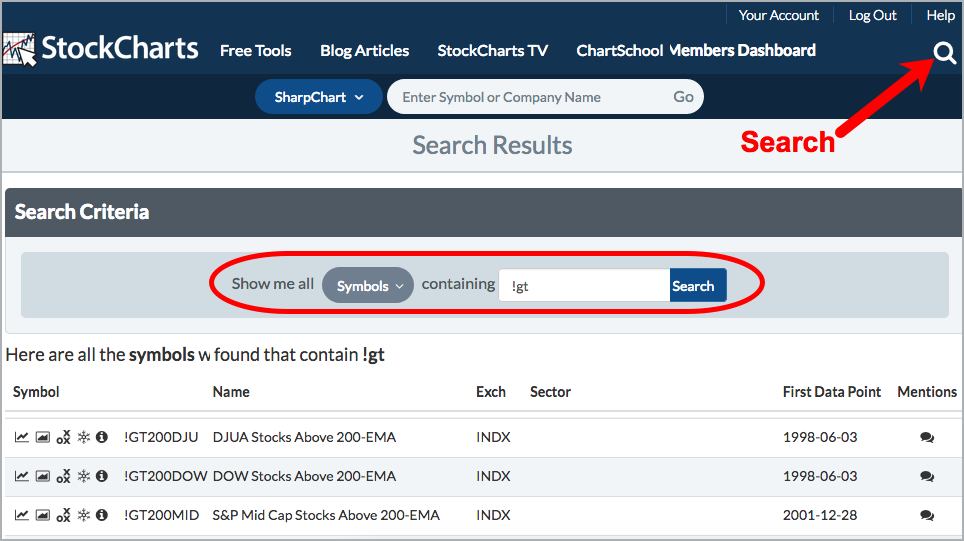
Finding these Symbols
Chartists looking for these symbols simply need to search the term "!GT" because all symbols begin with !GT (sans quotes). These symbols can then be used to create a SharpChart or ChartList.
Questions, Comments or Feedback?
I cannot promise to response to all correspondence, but I will read it and take into under consideration. I greatly appreciate all feedback because it helps me improve the commentary and provides ideas for the future. Sorry, I do not take symbol requests.

Plan Your Trade and Trade Your Plan.
- Arthur Hill, CMT
Senior Technical Analyst, StockCharts.com
Book: Define the Trend and Trade the Trend
Twitter: Follow @ArthurHill


