- An Island Reversal for SPY.
- XLI and Lead the Gap Parade.
- SOXX Leads Tech Lower with Gap.
- IAI Forges Lower Highs.
- ITB Hits New Low for Year.
- Utes and Telecom Hold Up.
 ... There were short-term reversals last week as a number of stocks and ETFs gapped up on Tuesday and then gapped down last Friday. The S&P 500 SPDR (SPY) provides a good example of this reversal. In fact, SPY even formed an island reversal.
Before going into the explanation, note that this is a short-term reversal and not enough to affect the long-term uptrend. In addition, any pullback at this stage would still be considered a correction within an uptrend.
The chart below shows SPY opening above 285 with a gap up, stalling above 285 for three days and then opening below 285 with a gap down. The red oval highlights this island reversal, which is short-term bearish. At this point, the pattern remains in play as long as the gap is unfilled. Look for a close back above 285.1 to negate this pattern.
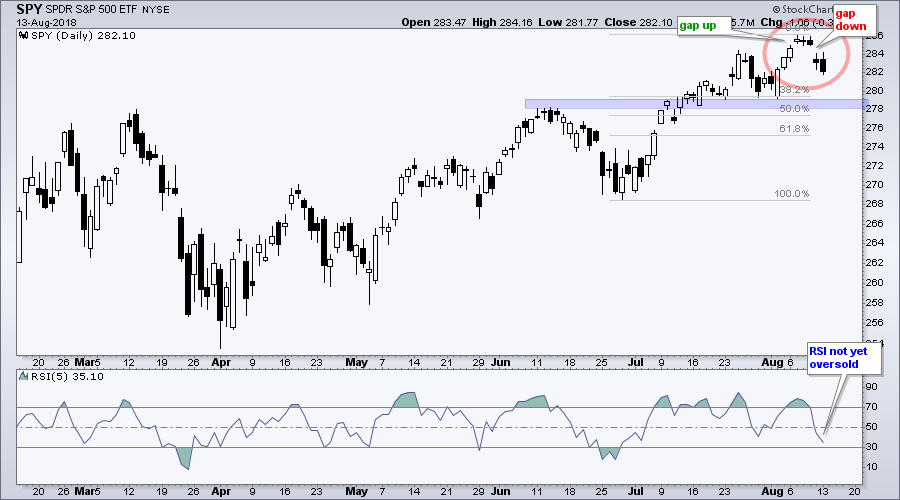
As long as this pattern is active and the ETF is not short-term oversold, the downside target is in the 278-279 area. Broken resistance, the late July and early August lows, and the 38-50% retracement zone mark potential support here. The indicator window shows RSI moving to its lowest level since late June (35.1). A dip below 30 would create a short-term oversold condition that could precede a bounce. Chartists should then watch for a move back above 30, such as in late June.
XLI and Lead the Gap Parade
The Industrials SPDR (XLI) and the Financials SPDR (XLF) weighed on the broader market as both fell rather sharply over the last two days. Note that both ETFs attempted to break above resistance last week, but failed to hold these breakouts and gapped down. I am not going to call these failed breakouts because both were up sharply in July and ripe for a corrective. The gaps and two-day decline, however, are short-term bearish and a bit disconcerting because XLI and XLF are important sectors.
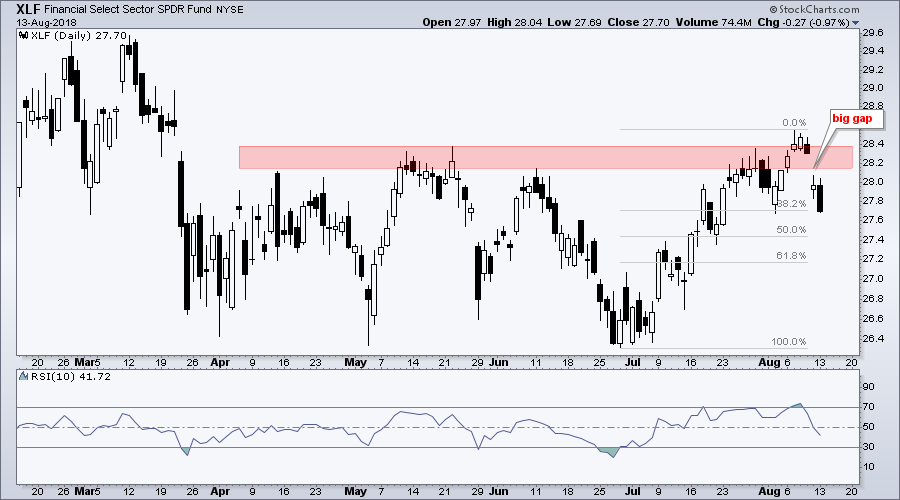
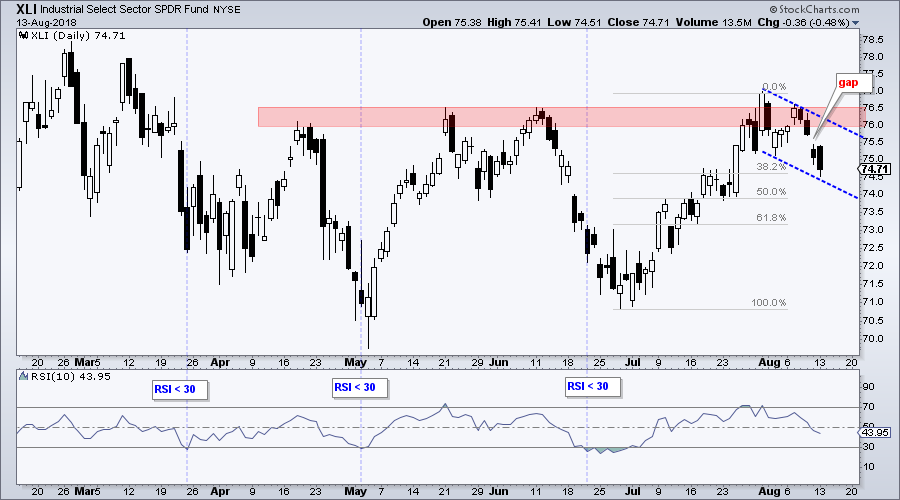 Picking support and/or a reversal zone after these gaps is a challenge because the gaps represent strong selling pressure, if just for one to two days. The charts show the Fibonacci Retracements Tool to mark potential support near the 50% retracements. Chartists can also watch RSI for a dip below 30, which would signal a short-term oversold condition that could give way to a bounce. Note that I am using RSI(10) because these sector SPDRs are a little more volatile that SPY, for which I am using RSI(5).
SOXX Leads Tech Lower with Gap
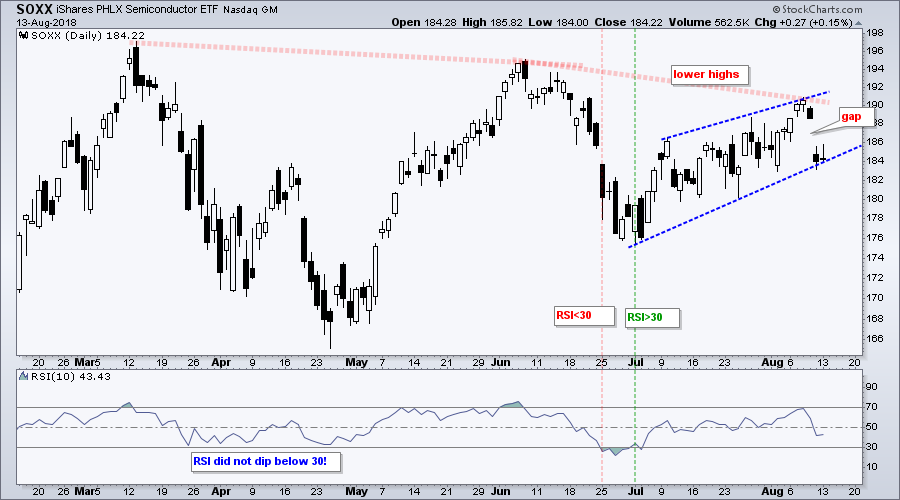
There are also some concerns among the industry group ETFs. First, the Semiconductor iShares (SOXX) formed lower highs from March to June and from June to August. SOXX led the technology sector lower on Friday with a big gap down and the ETF is on the verge of breaking the wedge line. This would signal a continuation of the June decline and target a move below the June-July low.
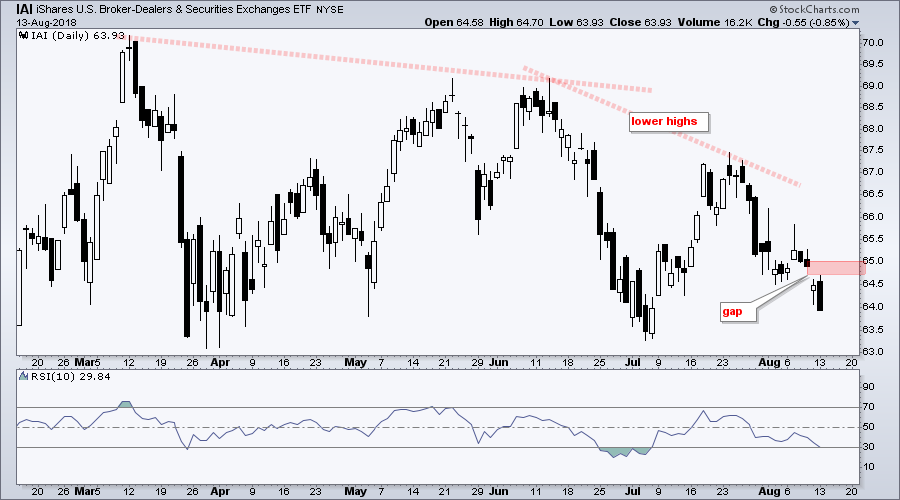
IAI Forges Lower Highs
The Broker-Dealer iShares (IAI) is underperforming because it formed a lower high from March to June and from June to July. This means selling pressure is coming in at lower levels (sooner). The ETF fell sharply in late July, firmed for a week or so and then gapped down on Friday. This makes IAI one of the weakest industry group ETFs right now. The gap zone is the first level to watch for a bullish revival (breakout at 65).
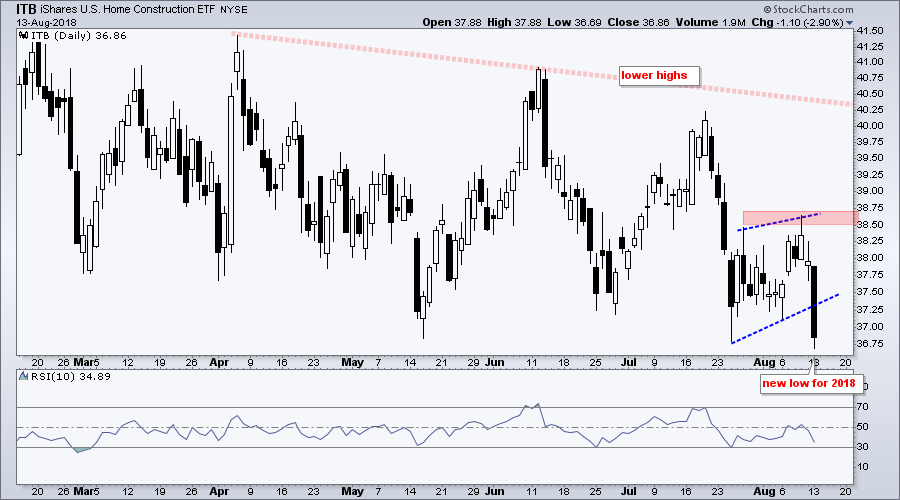
ITB Hits New Low for Year
The Retail SPDR (XRT) hit a new high last week and is helping the Consumer Discretionary SPDR (XLY). The Home Construction iShares (ITB), however, is another story as the ETF fell sharply the last two days and hit a new low for 2018. The chart shows ITB forming lower highs the last six months and breaking a wedge line on Monday. The August highs mark first resistance.
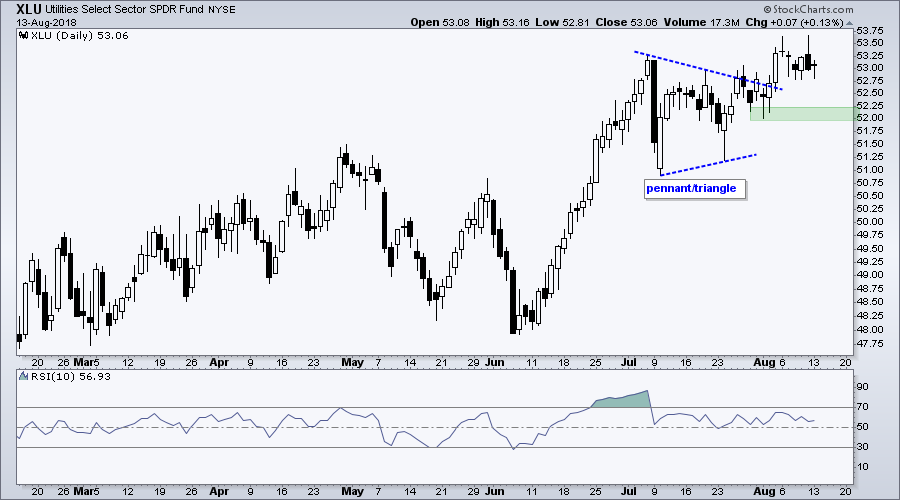
Utes and Telecom Hold Up
The Utilities SPDR (XLU) broke out of a triangle/pennant in late July and hit its highest level of 2018. The breakout is holding and bullish until proven otherwise. The early August lows mark first support in the 52-52.25 area.
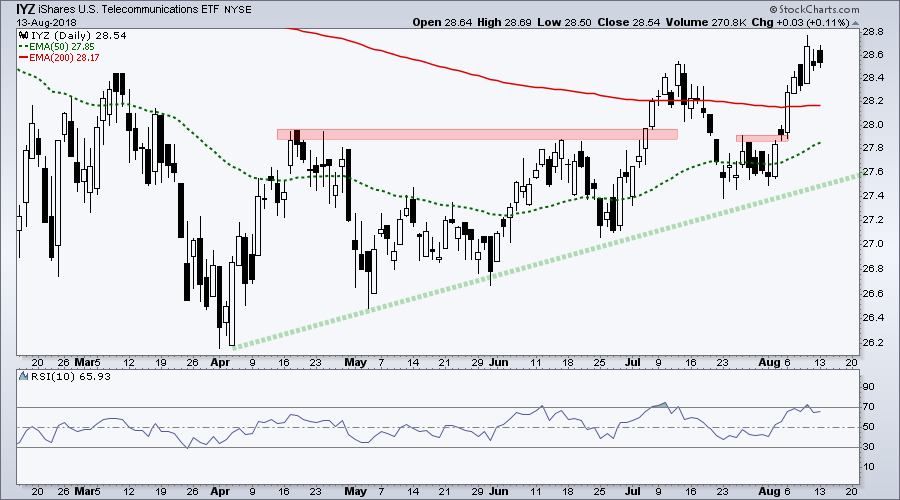
The Telecom iShares (IYZ) has also perked up quite a bit with higher highs and higher lows since April. In fact, the ETF is one of the leading industry-group ETFs over the last three weeks (+3.56%). The chart below shows IYZ moving above its 200-day EMA for the second time in as many months and this means the long-term downtrend may be reversing.
Questions, Comments or Feedback?
I cannot promise to response to all correspondence, but I will read it and take into under consideration. I greatly appreciate all feedback because it helps me improve the commentary and provides ideas for the future. Sorry, I do not take symbol requests.

Plan Your Trade and Trade Your Plan.
- Arthur Hill, CMT
Senior Technical Analyst, StockCharts.com
Book: Define the Trend and Trade the Trend
Twitter: Follow @ArthurHill


