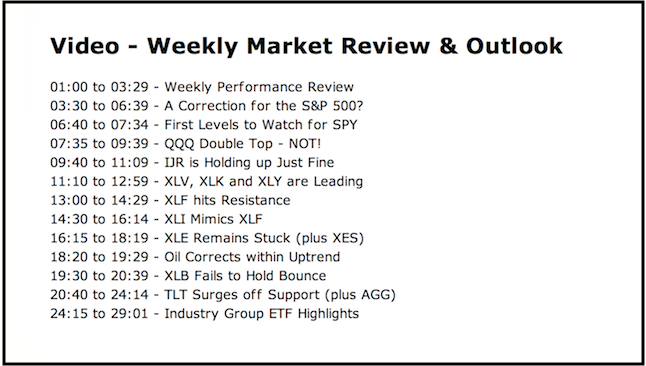
- Weekly Performance Review.
- Market Overview.
- A Correction for the S&P 500?
- First Levels to Watch for SPY.
- QQQ Double Top - NOT!
- IJR is Holding up Just Fine.
- XLV, XLK and XLY are Leading.
- XLI and XLF Hit Resistance.
- XLE Remains Stuck (plus XES).
- Oil Corrects within Uptrend.
- XLB Fails to Hold Bounce.
- TLT Surges off Support (plus $TNX).
- Industry Group ETF Highlights.
 Today's report comes to you from ChartCon in Seattle. The speaker lineup is great with something for everyone, from newbie to seasoned trader.
It was a mixed week for stocks with the large-caps edging lower and small caps finishing with modest gains. The Dollar may have had something to do with this because the US Dollar ETF surged over 1%. This Dollar surge may also be part of a risk-off move because money moved into safe-haven bonds as the 20+YR T-Bond ETF surged over 1%.
It is interesting that the S&P 500 SPDR (SPY) is up around 7% year-to-date and the 20+YR T-Bond ETF (TLT) is down around 3.5%. So far this year, risk-on stocks are performing well, but risk-averse bonds are not. However, as so often happens, this picture changes when we adjust the timeframe. As the PerfChart below shows, SPY and TLT are both up around 4.5% the last sixty days. It is a bit unusual to both gaining.
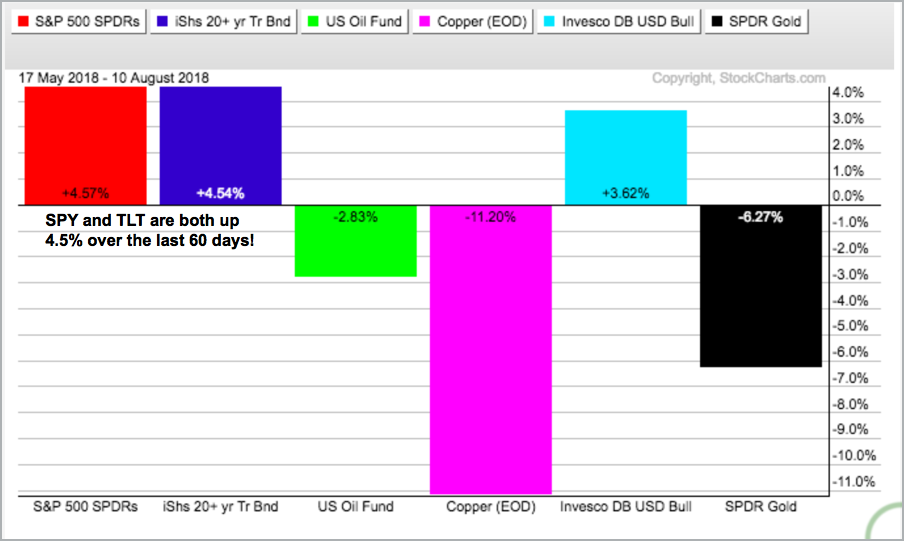
Despite an uptick in volatility and some risk aversion this week, most of the bigger trends remain in place. The S&P 500, the Dollar and oil are in long-term uptrends. Gold, copper, and the 20+ YR T-Bond ETF are in long-term downtrends, but bonds could be building a base so I will be watching resistance going forward.
Programming Note: I am on holiday next week with the ChartCon team. I hope to make a few brief updates, but will not be doing the Weekly Market Review and Outlook next week. After flying back across the Atlantic, I will be back in the saddle on Tuesday, August 21st.
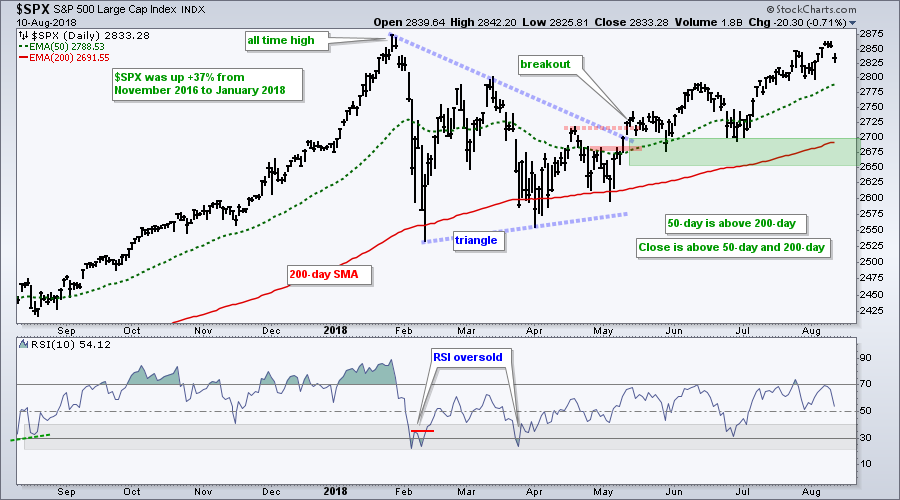
A Correction for the S&P 500?
The S&P 500 fell a whopping .71% on Friday and this is hardly enough to affect the bigger uptrend. The index moved above its July high in early August for another higher high. Overall, the May breakout is the last big signal from the index and we remain "on signal". The triangle breakout zone, the May-July lows and the rising 200-day EMA mark long-term support. We could see some backing and filling in the coming weeks, but the bigger uptrend suggests that we will hit new highs in the coming months.
First Levels to Watch
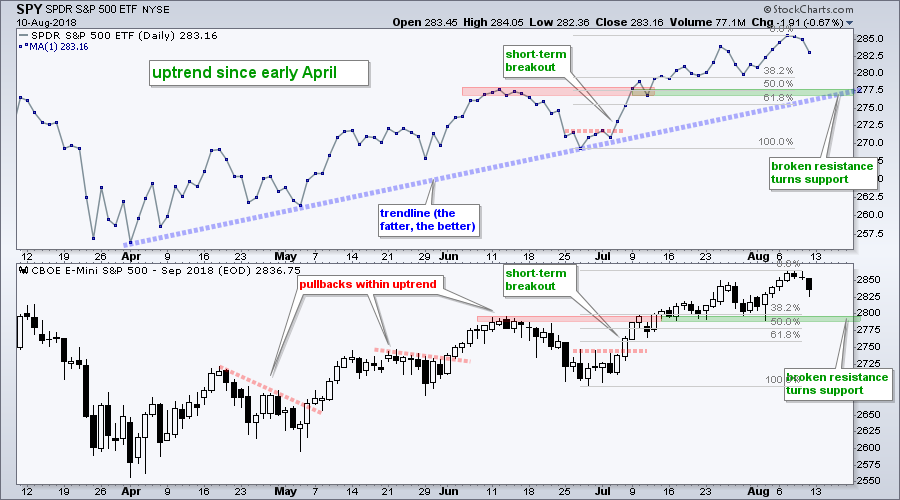
The next chart focuses on the uptrend that began with the April low using SPY and the E-mini. Both broke above their June highs with the July advance and these breakout areas turn into the first support zone. The E-mini actually tested this support in the 2800 area, but SPY held above it in late July. Focusing on SPY, we could see a pullback to the 278 area and this would represent a 50% retracement of the advance from late June to early August. Such a move could set up a mean-reversion opportunity.
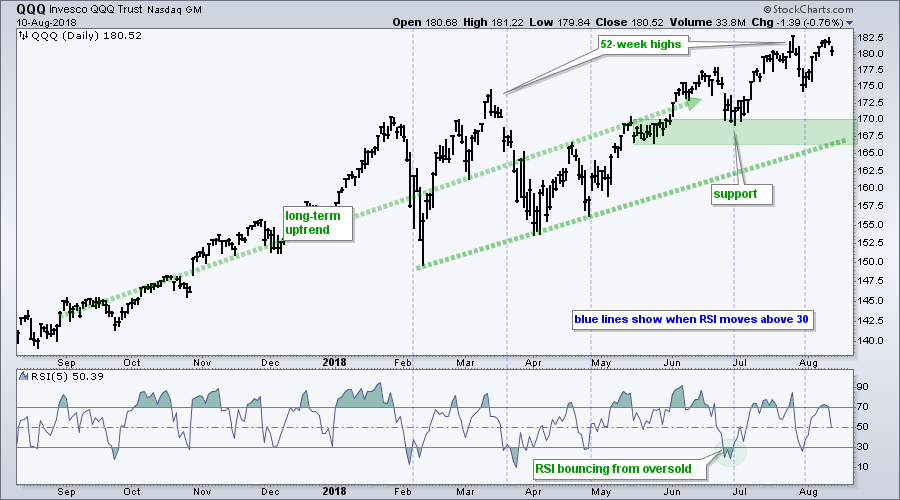
QQQ Double Top - NOT!
The Nasdaq 100 ETF (QQQ) advanced to the July high and then fell on Friday. It may seem as if a double top is taking shape, but I am not in this camp. Double tops are usually larger and they are distribution patterns. Furthermore, a “potential” double top emerges every time prices approach a prior high and back off. Go through the chart and see how many potential double tops you can find in an uptrend. Most do not pan out because a trend continuation is more likely than a trend reversal. The trend is the most important factor here and the trend is up.
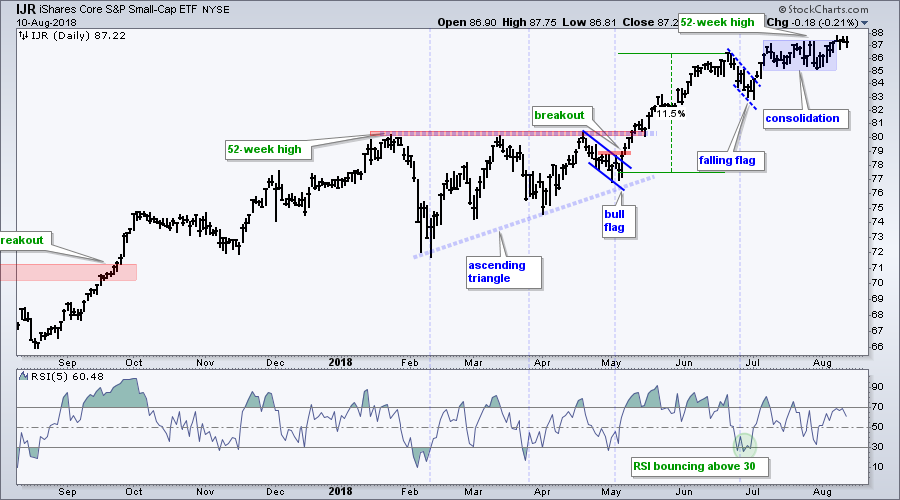
IJR is Holding up Just Fine
The S&P SmallCap iShares (IJR) is the leader of the big three because it recorded a 52-week high this week, as did the S&P Small-Cap 600 ($SML). The ETF broke out of a falling flag in late June, consolidated for a few weeks and edged above the consolidation highs this week. It is not a "breakout" per se, but IJR is clearly in an uptrend and small-caps continue to lead.
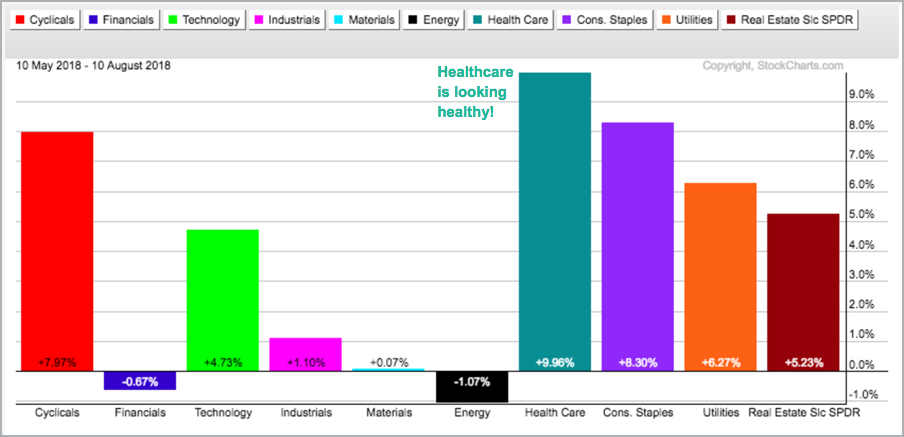
Healthcare, Tech and Discretionary Lead
The Health Care SPDR (XLV), Consumer Discretionary SPDR (XLY) and Technology SPDR (XLK) remain the top sectors overall. XLV is leading with the biggest gain over the last three months (9.96%). XLY hit a new 52-week high this week, as did the Retail SPDR (XRT). XLK shows the biggest year-to-date gain (14.96%). These three sectors account for around 53% of SPY and this is enough to keep the broader market afloat.
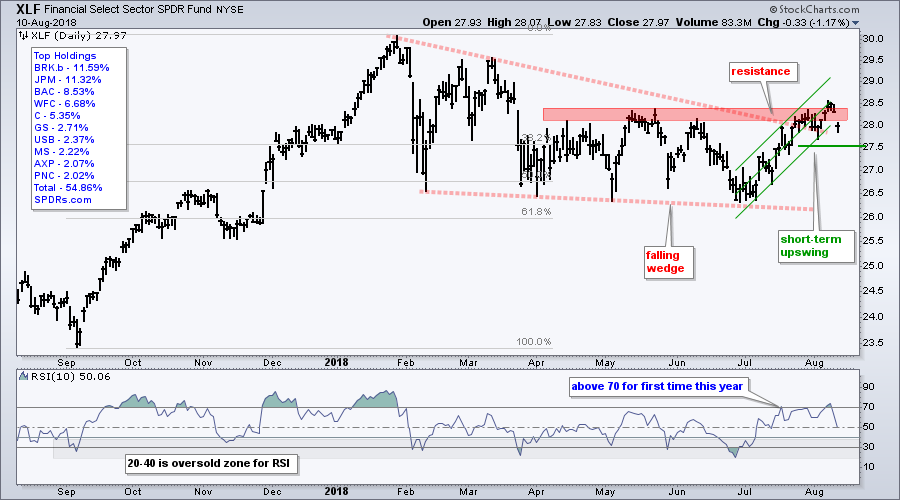
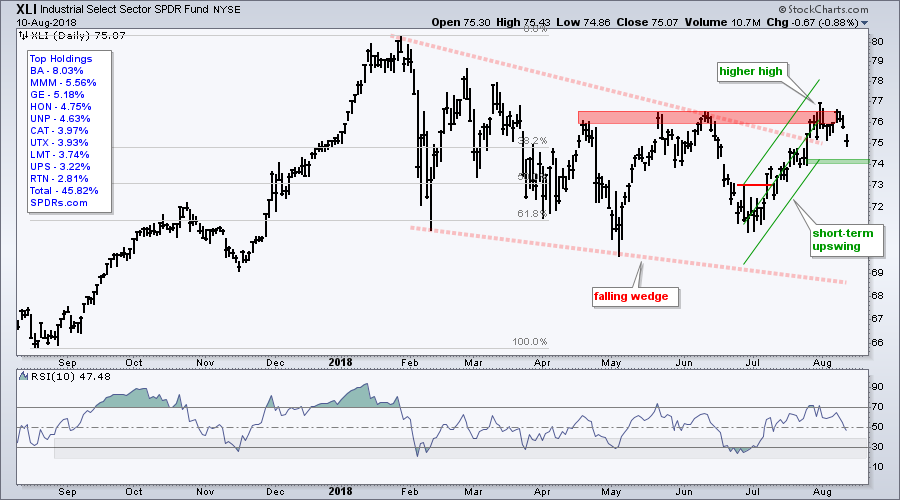
XLF and XLI hit Resistance Zone
The Industrials SPDR (XLI) and the Financials SPDR (XLF) show the biggest gains over the last five weeks, but both are barely positive year-to-date and hitting resistance. Breakouts in these two would be quite positive for the S&P 500 so I will be watching them closely.
The first chart shows XLF surging to resistance from the May-June highs and then falling on Friday with a gap. Actually, XLF broke above resistance for a day or two. The gap looks bad on the 15 minute chart, but the ETF is still in a short-term upswing on the daily chart. I am marking upswing support at 27.5, a break of which would reverse the upswing and could weigh on the broader market. XLF is the third biggest sector (14%) in the S&P 500.
The next chart shows XLI doing the same thing: breaking above resistance for a day and then falling back. The Raff Regression Channel and late July low mark upswing support at 74. A break here would reverse the upswing and be negative for XLI.
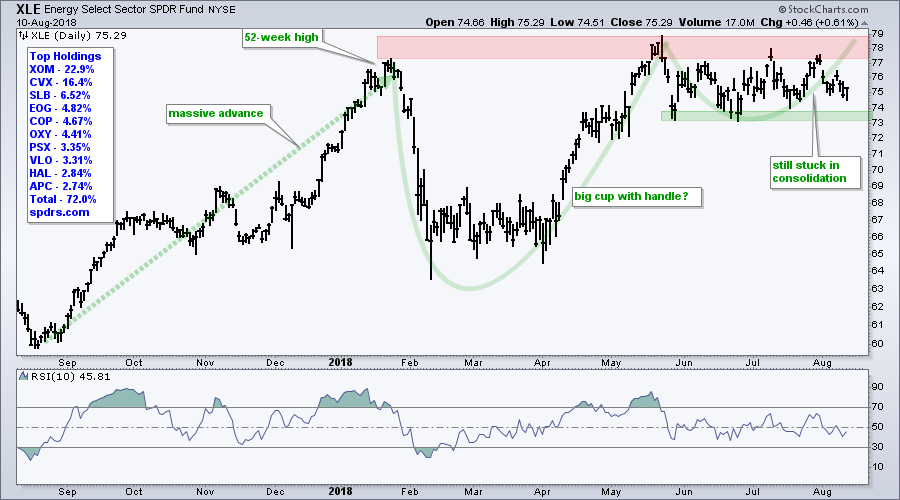
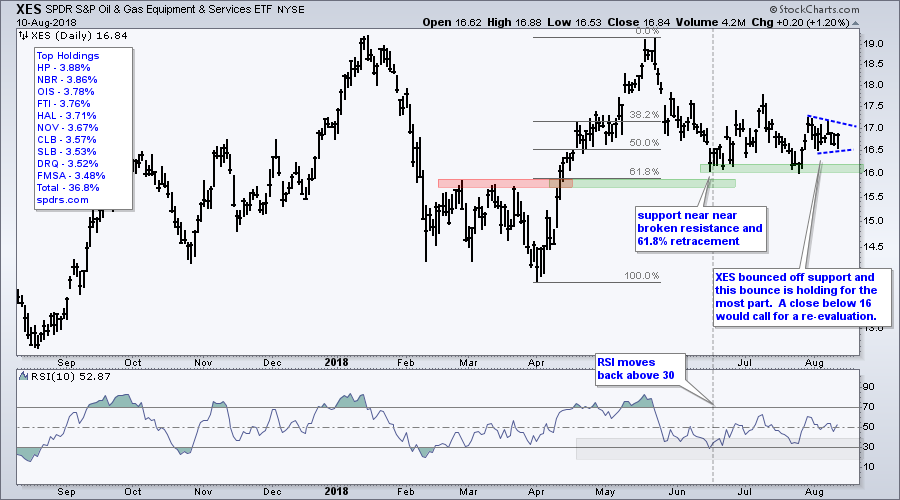
XLE Remains Stuck (plus XES)
The Energy SPDR (XLE) remains stuck in a consolidation, which still looks like a handle from a cup-with-handle pattern. This is a bullish continuation pattern and a break above rim resistance would confirm it. One could also view the handle as a flag/triangle line consolidation after the April-May surge. Either way, a breakout at 78 would be bullish.
The next chart shows the Oil & Gas Equip & Services SPDR (XES) surging off support with a move from 16 to 17 and then consolidating the last two weeks. This could be a short-term bullish consolidation and a breakout at 17.1 would be bullish. Overall, the ETF is basically flat since October and I am marking support at 16. I will give the bulls the benefit of the doubt as long as 16 holds.
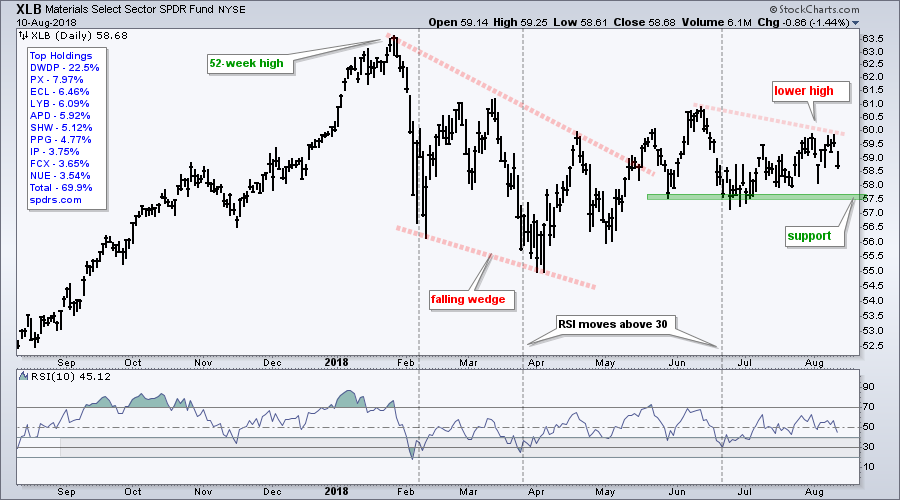
XLB Fails to Hold Bounce
The Materials SPDR (XLB) seemed to be bouncing off support and then got whacked with a 1.5% decline on Friday, which was the largest decline of the sector SPDRs. Overall, XLB broke out of a falling wedge correction in May, but has struggled since the breakout. The May-June lows established support in the 57.5 area and the bulls have a slight edge as long as this holds. A close below 57 would be bearish.
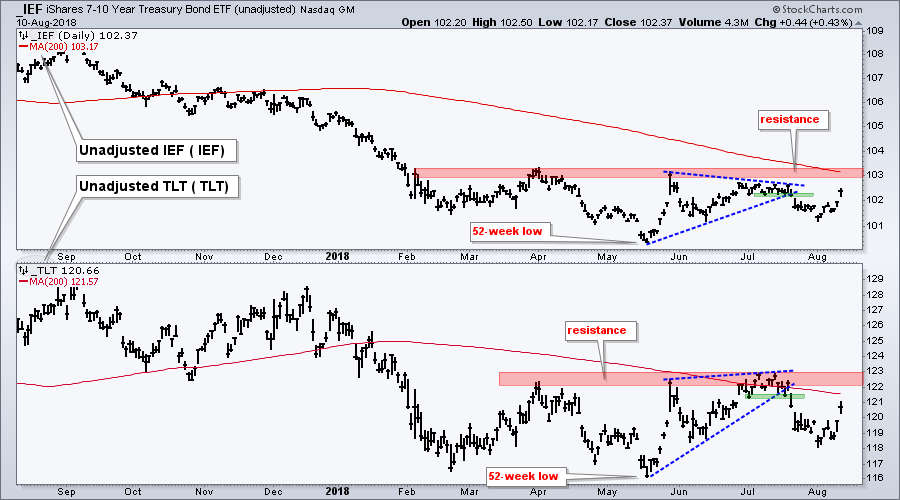
TLT Surges within Consolidation (plus $TNX)
The 7-10 YR T-Bond ETF (IEF) and 20+ YR T-Bond ETF (TLT) broke down in the second half of July, but found bids in August and surged the last seven days. The bigger trends are still down, but I will be watching resistance levels closely in the coming days and weeks. Note that IEF and TLT hit new lows in May and both are below their falling 200-day EMAs. Despite these downtrends, both firmed the last few months and consolidated. In fact, TLT has been trading in the 116 to 123 area since February. Even though this could be a base, it is not confirmed and we need a breakout at 123 to actually reverse the downtrend (103ish for IEF).
The next chart shows weekly bars for the 10-yr T-Yield ($TNX) and the 30-yr T-Yield ($TYX). Yields moved higher from September to February and then stalled the last six months or so. The 10-year is stalling in the 2.7-3% area (27 to 30 on the chart), while the 30-year is stalling in the 2.9-3.2% area. The big trends are up, but I am watching support closely because breakdowns would be long-term bearish for yields (bullish for bonds).
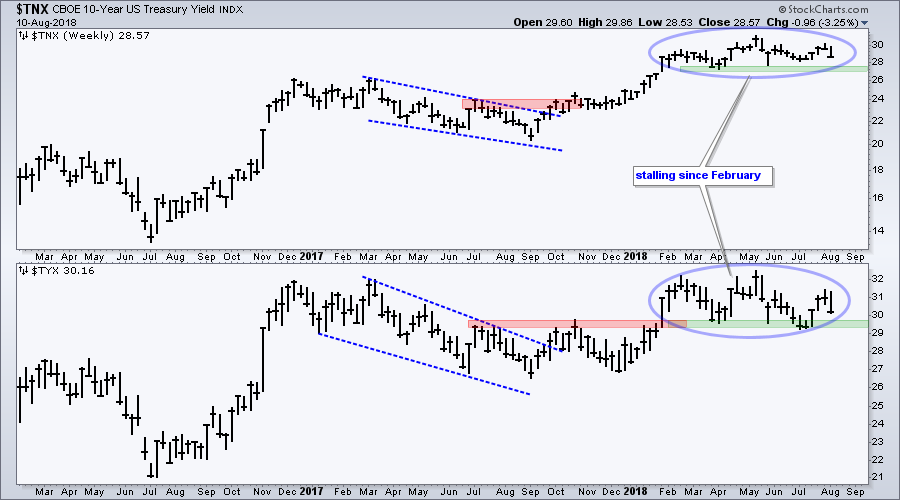
Yields should be watched from a macro standpoint because lower Treasury yields could be negative for stocks. Yields fall and bonds rise when the economic outlook dims, disinflation picks up or investors seek safe-havens. Money spent buying bonds is money that will not find its way into the stock market.
Notes from the Art's Charts ChartList
- The Home Construction iShares (ITB) remains one of the weakest industry group ETFs, but the Retail SPDR (XRT) is one of the strongest with a 52-week high this past week.
- The Cloud Computing ETF (SKYY) and Cyber Security ETF (HACK) pulled back into late July and got mean-reversion bounces in August. Short-term traders should watch this bounces closely (two week uptrends).
- The Semiconductor iShares (SOXX) formed lower highs this year and fell sharply on Friday. The six week rising wedge is still rising, but watch support closely.
- The Broker-Dealer iShares (IAI) has a large descending triangle working.
- The Regional Bank SPDR (KRE) is struggling to follow through on its mean-reversion bounce.
- The iShares Aerospace & Defense ETF (ITA) is consolidating around a triangle breakout and could be poised to resume its advance.
- The Biotech SPDR (XBI) is having trouble following through on its mean-reversion bounce and should be watched closely.
- HealthCare Providers ETF (IHF) is still one of the strongest groups and formed a 52-week high this week.
- Hard assets continue to fall hard as the Copper Miners ETF (COPX) and Gold Miners ETF (GDX) hit new 52-week lows.
- Click here for the Art's Charts ChartList
Questions, Comments or Feedback?
I cannot promise to response to all correspondence, but I will read it and take into under consideration. I greatly appreciate all feedback because it helps me improve the commentary and provides ideas for the future. Sorry, I do not take symbol requests.

Plan Your Trade and Trade Your Plan.
- Arthur Hill, CMT
Senior Technical Analyst, StockCharts.com
Book: Define the Trend and Trade the Trend
Twitter: Follow @ArthurHill


