- Oil Bounces off Support
- XLE: Support Break or Oversold Opportunity?
- Biotechs Get a Bounce (IBB, XBI)
- Schwab Firms at Support
- Stocks to Watch: GSP, FFIV, TXN
- On Trend Highlights and Link
 Oil Bounces off Support
The Light Crude Continuous Contract ($WTIC) fell over 10% from early July to mid August, but this decline is still considered a correction within a bigger uptrend. Why? Well, oil hit a 52-week high in early July, the 50-day EMA is above the 200-day EMA, both EMAs are rising and price is above the 200-day EMA. Thus, the bulk of the evidence points to a long-term uptrend.
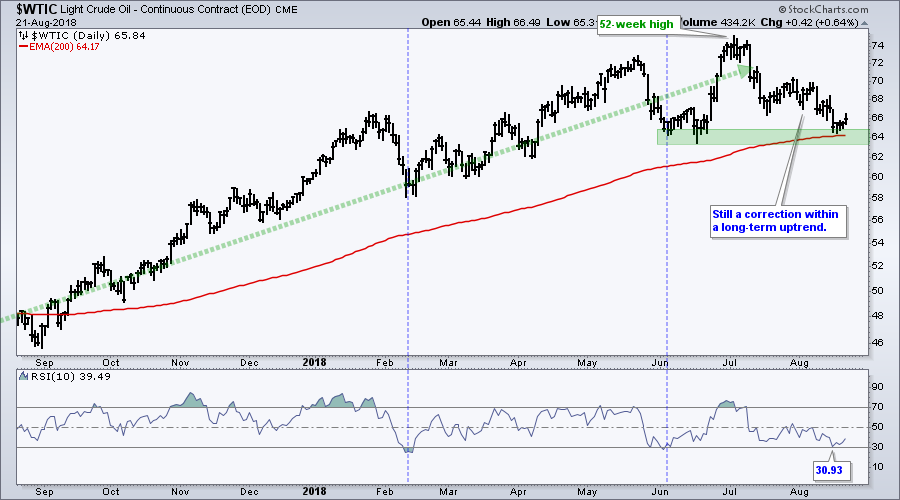
If we assume that the long-term trend is up, then a price decline is considered a correction within this bigger uptrend. Notice that oil established support in the mid 60s in June and is testing this zone here in August. In addition, RSI dipped to 30.93 and almost became oversold. The combination of "almost oversold" and support could lead to a bounce in crude, which is actually underway the last few days.
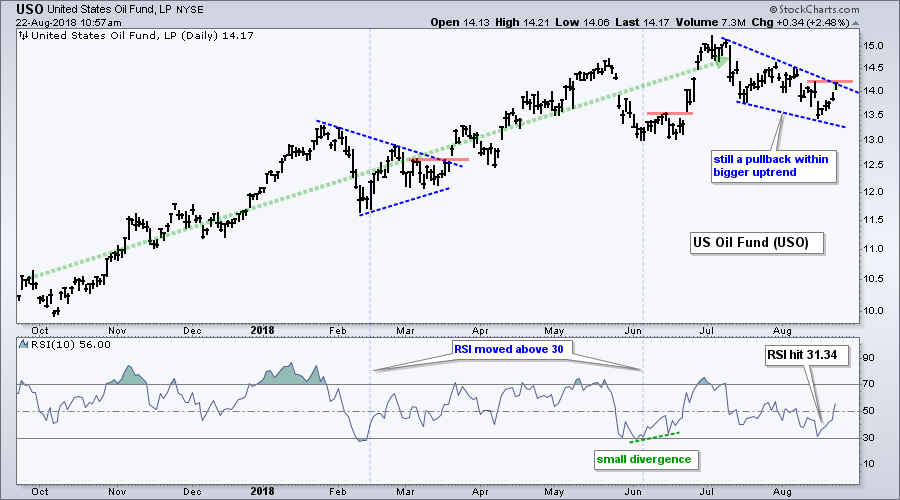
The next chart shows the USO Oil Fund (USO) holding just above its June low as a falling wedge forms. RSI hit 31.34 on the dip and almost became oversold. The wedge line and August 14th high mark first resistance to watch for a breakout.
XLE: Support Break or Oversold Opportunity?
I covered the Energy SPDR (XLE) and the Oil & Gas Equip & Services SPDR (XES) in Tuesday's video for On Trend and will expand in today's written commentary. XLE provides a good example of how the pattern/price trader sees things and how an indicator/mean-reversion trader would see something else.
Yep, you can see anything you want to see in this business.
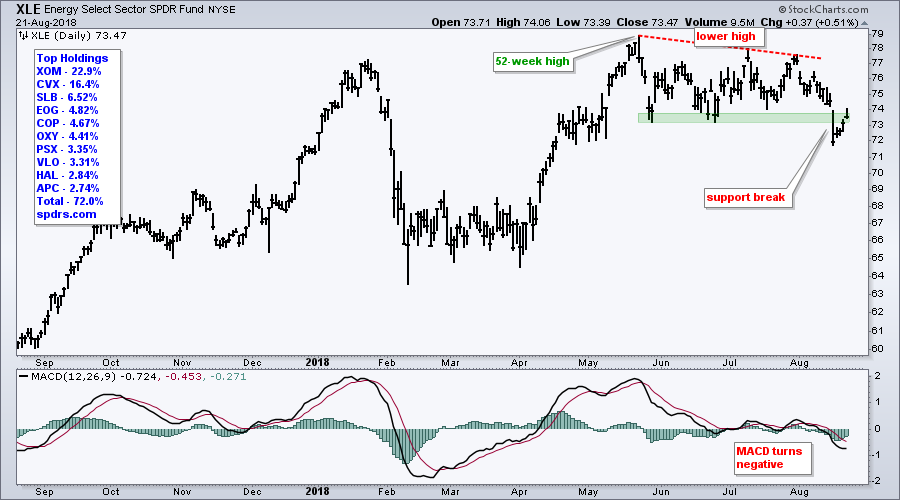
On the price chart, XLE formed a lower high from May to July and broke the May-June lows with a sharp decline last week. MACD moved into negative territory and to its lowest level since late March. Yep, it sure looks bearish.
But wait! The next chart makes a bullish argument. The long-term trend is up because the ETF scored a 52-week high in mid May and the 50-day EMA is above the 200-day EMA. The decline, while suddenly sharp, retraced 50% of the prior advance and bounced off the rising 200-day EMA. This is a good spot for the correction to end and bigger uptrend to resume. In addition, RSI became oversold and moved above 30 for a mean-reversion signal.
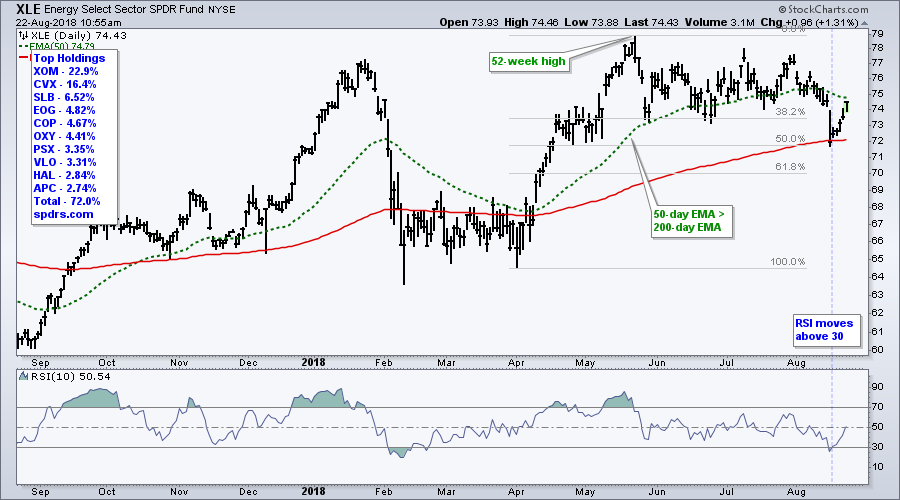
What are we to believe? Personally, I prefer the second chart because the long-term trend is clearly up and this makes the pullback a correction within that bigger uptrend, which is the dominant force. While we never know how far a correction will extend, the odds usually favor something between a 33% and 66% retracement (1/3 to 2/3). This pullback started from a 52-week high and retraced half of the prior advance, which makes it pretty normal for a correction within a bigger uptrend.
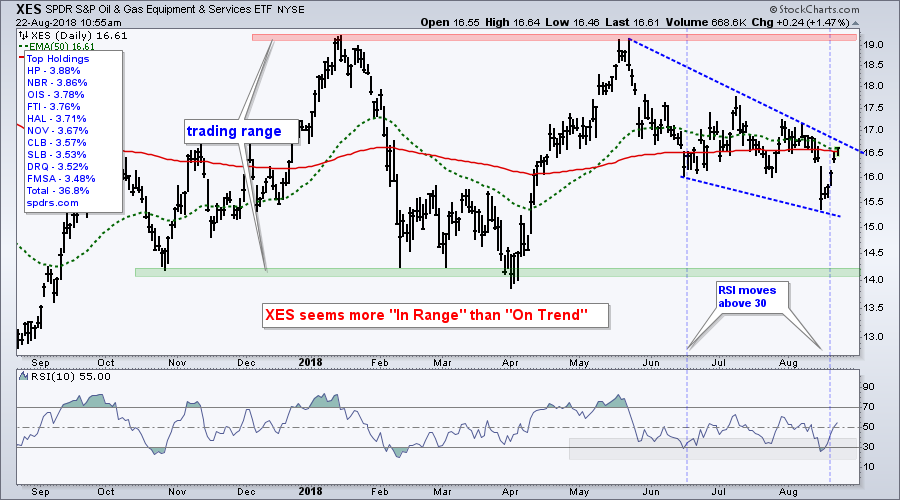
The next chart shows the Oil & Gas Equip & Services SPDR (XES), which is more within a trading range that an uptrend. The ETF, however, did become oversold last week and bounced the last four days.
Biotechs Get a Bounce
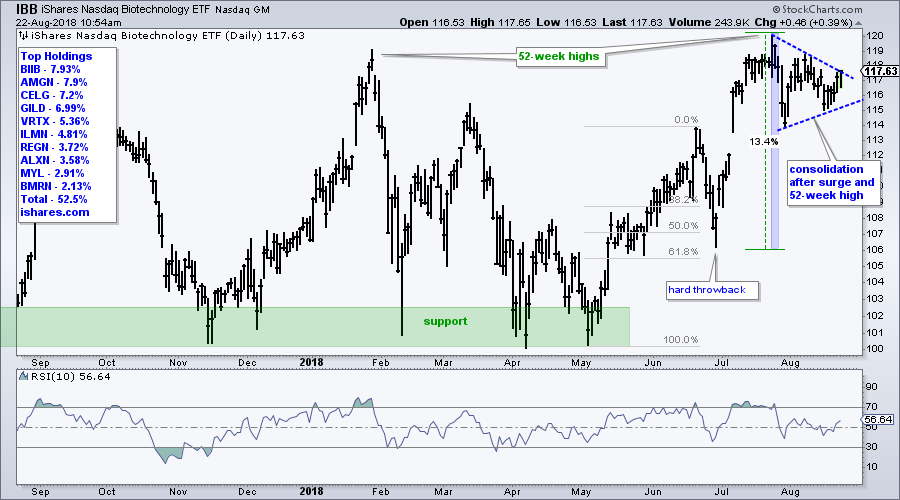
The healthcare sector is one of the leading sectors in 2018 and over the last few months. Within the sector, the Biotech iShares (IBB) and the Biotech SPDR (XBI) are perking up. The first chart shows IBB surging over 13% to a new high and then consolidating with a triangle. A consolidation after a big advance is a bullish continuation pattern and an upside breakout is expected.
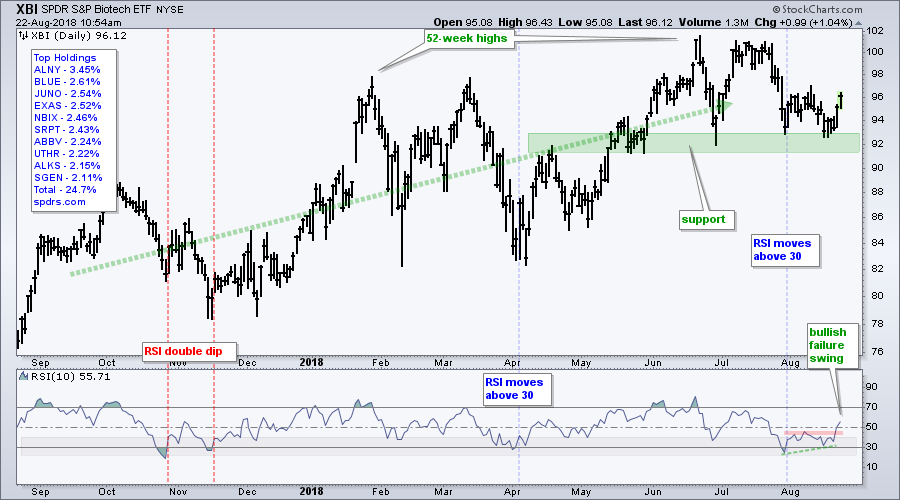
The next chart shows XBI bouncing off support as RSI formed a bullish failure swing. This bullish setup forms when RSI dips below 30, bounces, pulls back, holds above 30 and then exceeds its prior peak. These failure swings were developed by Wells Wilder, creator of RSI.
Schwab Firms at Support
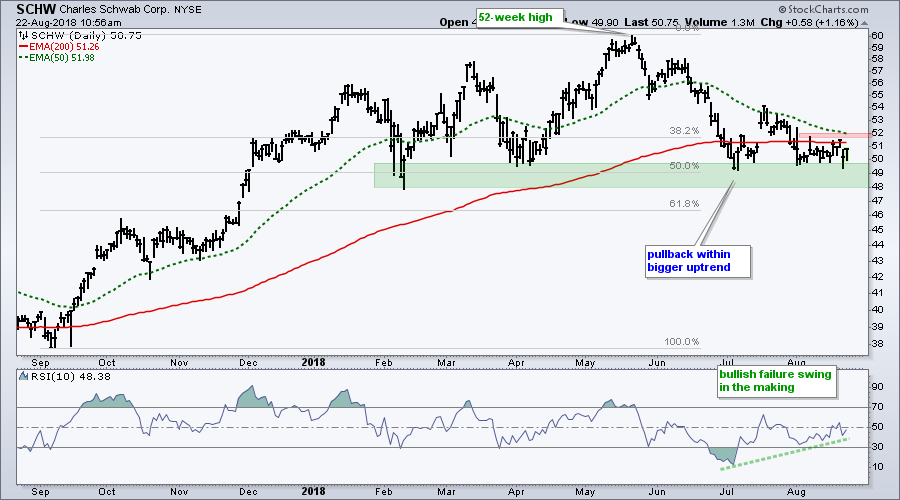
Charles Schwab (SCHW), E-trade (ETFC) and TD Ameritrade (AMTD) moved lower yesterday as JP Morgan (JPM) announced plans to offer free trading. As an aside, this may say more about JP Morgan's situation than the discount brokers. In any case, SCHW is still firming at support with a bullish failure swing working in RSI. Look for a break above 52 to turn bullish.
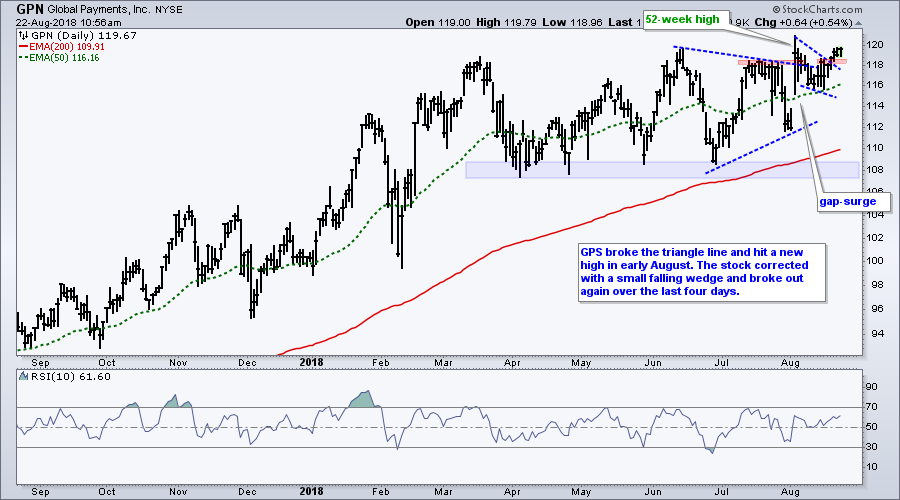
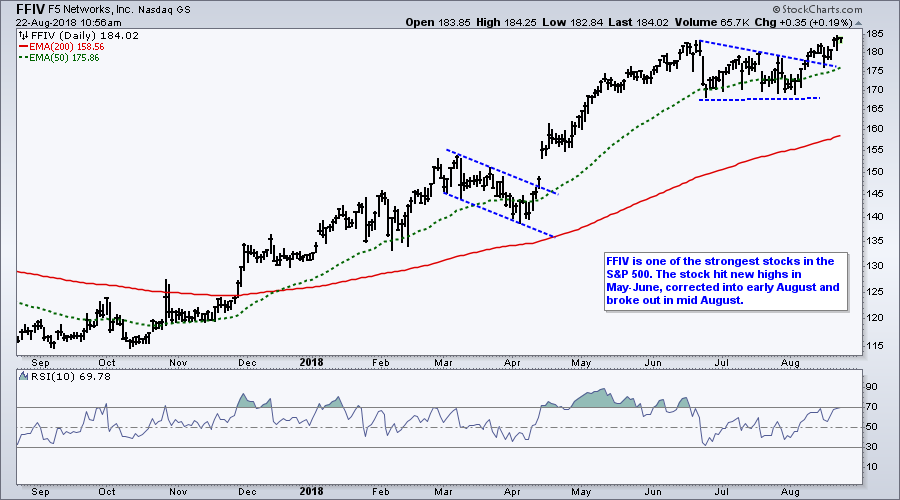
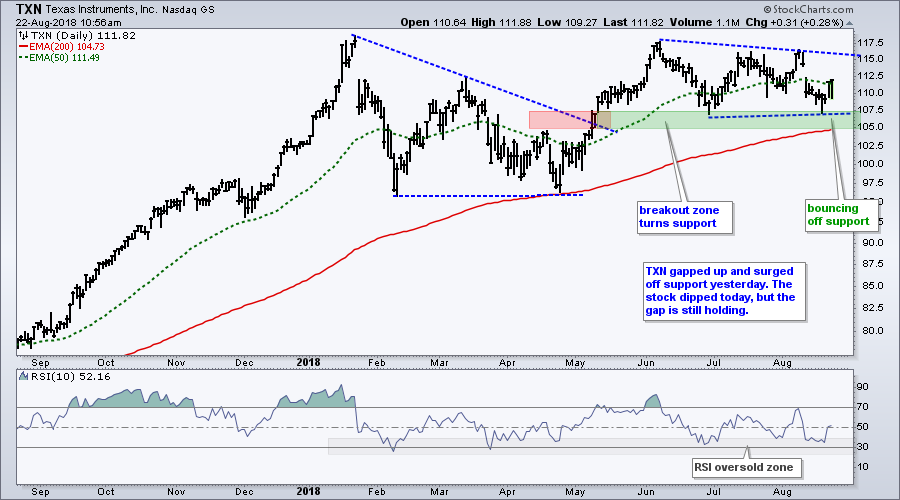
Stocks to Watch: GSP, FFIV, TXN
On Trend on Youtube
Available to everyone On Trend with Arthur Hill airs Tuesdays at 10:30AM ET on StockCharts TV and repeats throughout the week at the same time. Each show is then archived on our Youtube channel.
Topics for Tuesday, August 21th:
- Bull Flags in XLK, HACK and SKYY
- XLI Breaks out as XLF Fills Gap
- XLE - Support Break vs. Oversold Setup (plus XES, USO)
- XRT Leads Consumer Discretionary SPDR (plus ITB)
- IAI Tests Support as KRE Turns Up (plus SCHW and ETFC)
- Stocks to Watch: ANSS, FFIV, JBHT, LMT, ULTA and more
- Click here to Watch
Questions, Comments or Feedback?
I cannot promise to response to all correspondence, but I will read it and take into under consideration. I greatly appreciate all feedback because it helps me improve the commentary and provides ideas for the future. Sorry, I do not take symbol requests.

Plan Your Trade and Trade Your Plan.
- Arthur Hill, CMT
Senior Technical Analyst, StockCharts.com
Book: Define the Trend and Trade the Trend
Twitter: Follow @ArthurHill


