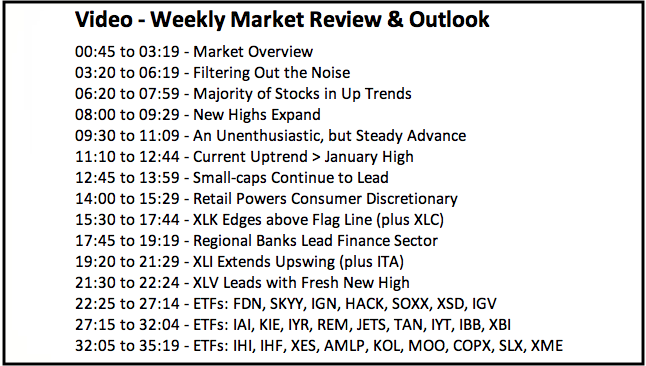
- Market Overview
- Majority of Stocks in Up Trends
- New Highs Expand in $SPX, $MID and $SML
- An Unenthusiastic, but Steady Advance
- Current Uptrend > January High
- Small-caps Continue to Lead
- Retail Powers Consumer Discretionary
- XLK Edges above Flag Line (plus XLC)
- Regional Banks Lead Finance Sector
- XLI Extends Upswing (plus ITA)
- XLV Leads with Fresh New High
- Notes from the Art's Charts ChartList
 There sure is a lot of noise out there. There are economic reports and surprises, earnings beats and misses, valuation concerns, politics, talking heads and more. Thankfully, technical analysts and chartists have a means to filter out this noise and see the end result. Price.
Price bundles all these hopes and fears into one indisputable data point. You will rarely hear anyone arguing about the price on the ticker or the true level of an index. We can debate tariffs, valuations, economics and earnings until we are blue in the face, but price is price.
While chartists cannot debate one price point, we can, and do, debate multiple price points, or charts. One chartist may see an overbought situation while another chartist might see a strong trend. It is all in the eyes of the beholder.
When analyzing charts, I try to remove as much guesswork as possible. The trend is clearly up and strong when a stock, ETF or index hits a 52-week high. This is pretty much undeniable as far as I am concerned. Well guess what? The S&P Mid-Cap 400, S&P Small-Cap 600 and the Russell 2000 hit new highs this week. Not just new highs, mind you, but all-time highs.
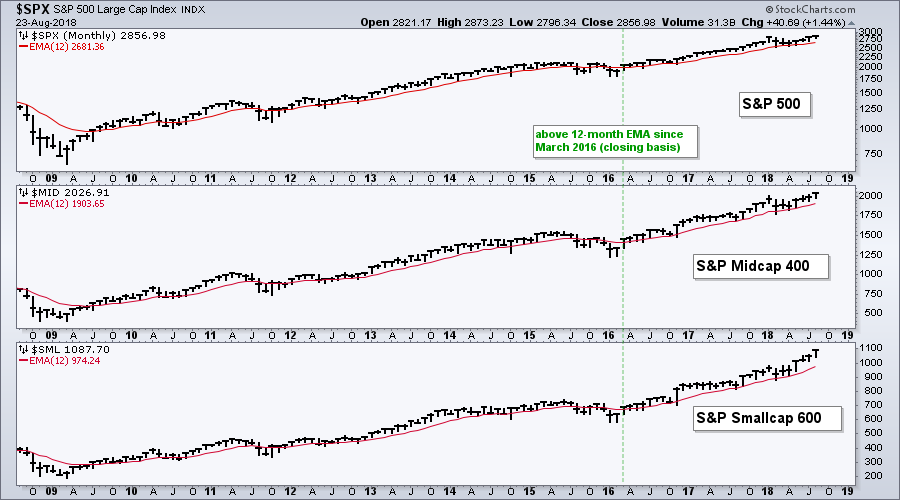
Elsewhere, the S&P 500 is around .50% from a new high. This looks like the stuff of a bull market. As the chart above shows, all three indexes have been above their 12-month EMAs since March 2016. I would not become concerned until we see one or more of these indexes close below their 12-month EMAs.
Majority of Stocks in Up Trends
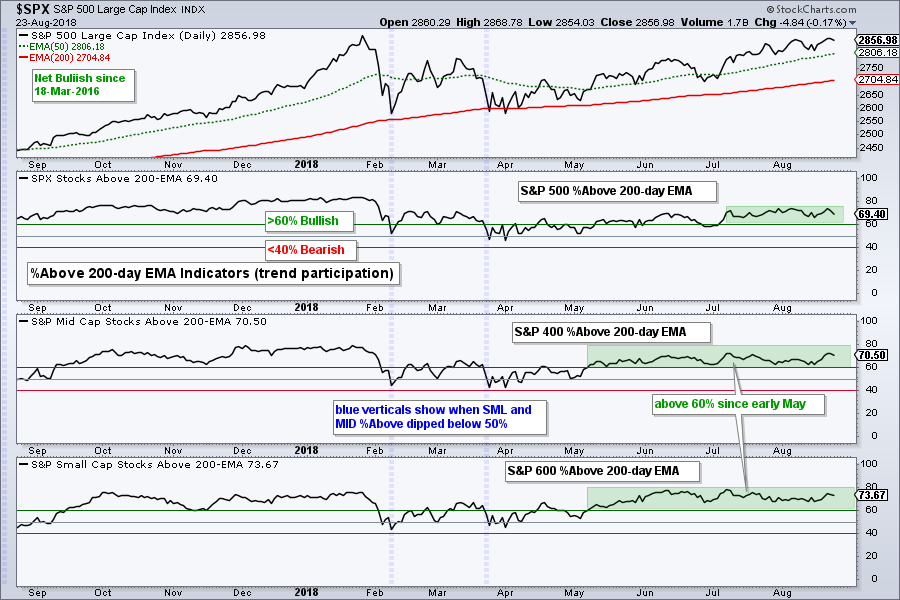
In addition to new highs in several key indexes, the bulk of the breadth evidence is bullish. Some 70% of stocks in the S&P 1500 are above their 200-day EMAs (long-term uptrends). New highs are easily outpacing new lows and the AD Percent indicators are more positive than negative. Notice that each of the preceding terms are linked to an article explaining their use.
The %Above 200-day EMA has been above 60% for the S&P Mid-Cap 400 and S&P Small-Cap 600 since early May, while this indicator for the S&P 500 has been above 60% since early July. This indicator may be below the levels seen in January, but it is still more bullish than bearish. If you are looking for a worry point, watch for a move below 60% in two of the three. The bulls are clearly in charge until such a move.
New Highs Expand
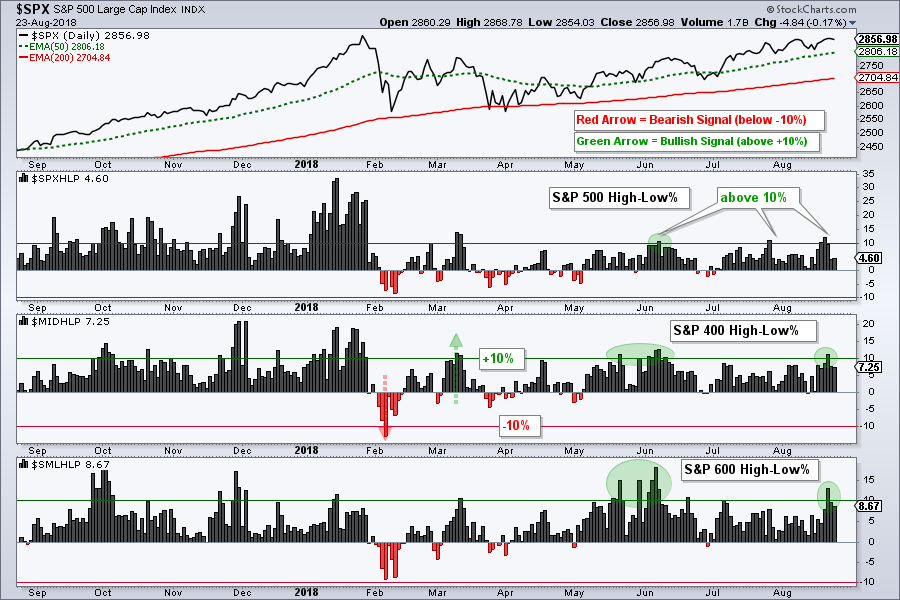
The High-Low Percent indicators for the S&P 500, S&P Mid-Cap 400 and S&P Small-Cap 600 exceeded +10% this week. This shows a mild expansion of new highs and keeps the edge with the bulls. Yes, I realize that there are fewer new highs than in January, but this indicator is clearly more bullish than bearish right now. Live in the present!
An Unenthusiastic, but Steady Advance
The tepidness of the advance since April can be seen in the 10-day EMA of AD Percent. This indicator turns bullish with a breadth thrust above +30% and bearish with a thrust below -30%. Technically, the indicator turned bearish in early February when all three exceeded -30%. Since this signal, the 10-day EMA of S&P SmallCap AD Percent ($SMLADP) is the only one to hit +30% again. Also notice that small-caps held up better in late March by not dipping below -30%.
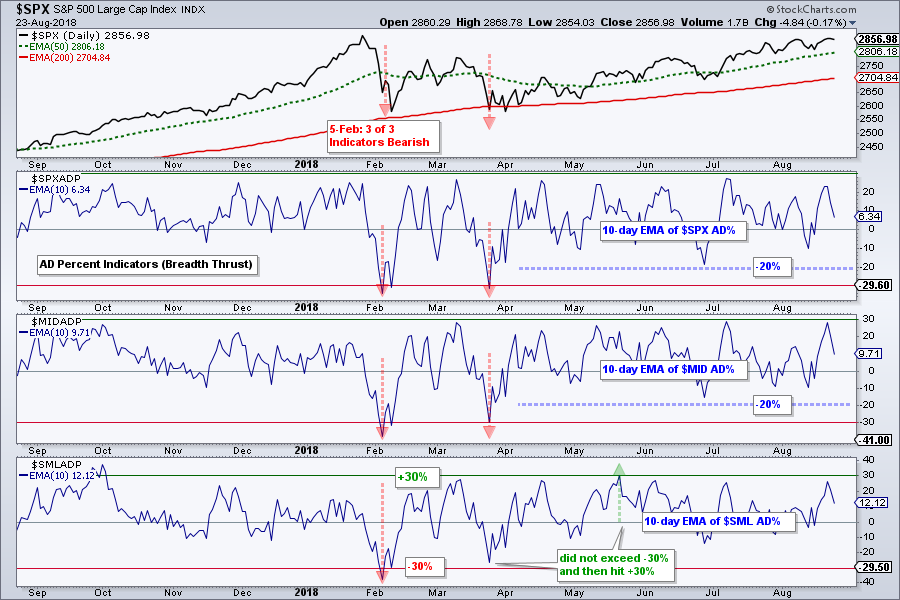
The inability of the indicators for the S&P 500 and S&P Mid-Cap 400 to exceed +30% shows a lack of enthusiasm over the last few months. However, I would not consider this bearish. Less bullish is not the same as bearish. These indicators exceeded +20% several times since March and have not been below -20%. On balance, they are more bullish than bearish and this is what really counts.
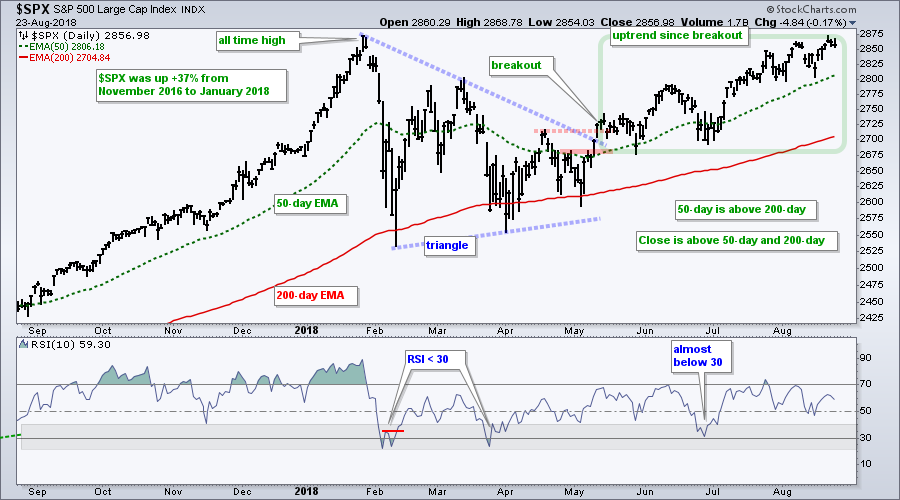
Current Uptrend > January High
The S&P 500 advanced to the January high on Tuesday and edged lower the last two days. I do not consider this a significant resistance level because breadth indicators are net bullish and the long-term trend is up. Higher highs are expected when the bulk of the evidence is bullish. We could see a dip below the 50-day EMA and the 2800 level, but this would still be within the realm of a bigger uptrend. In fact, such a dip would likely provide an opportunity to partake in the bigger uptrend.
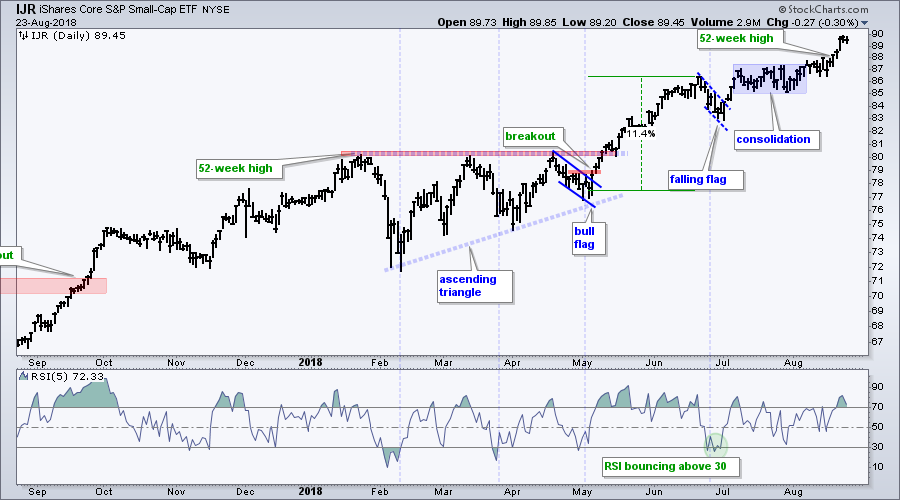
Small-caps Continue to Lead
The S&P SmallCap iShares (IJR) is the best performing major index ETF this month. IJR is up 3.82%, QQQ is up 2.47% and SPY is up 1.59%. On the price chart, IJR broke out of a consolidation in early August and recorded another new high this week. As noted in On Trend on Tuesday, the Russell 2000 iShares (IWM) formed an ascending triangle and broke out. Thus, small-caps are still the place to be in 2018.
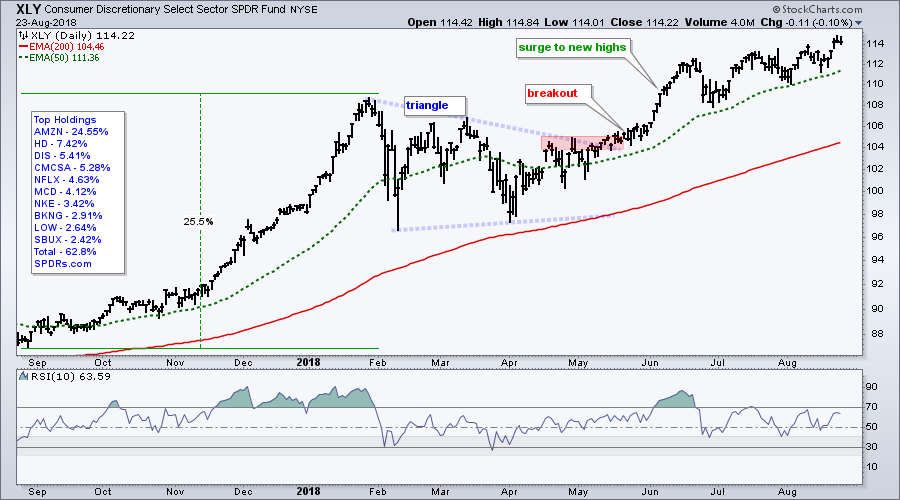
Retail Powers Consumer Discretionary Sector
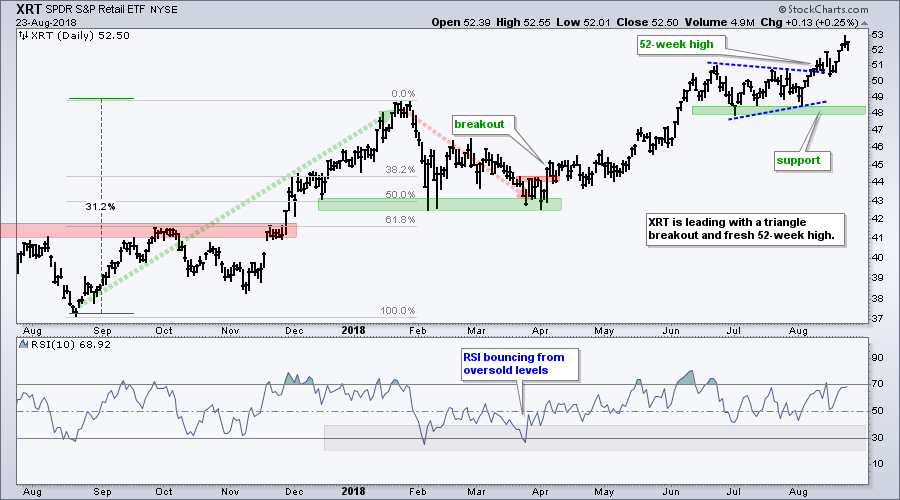
The Consumer Discretionary SPDR (XLY) hit a new high this week with help from the Retail SPDR (XRT), which also hit a new high. The first chart shows XLY surging to a new high in June and then working its way higher the last two months. The uptrend slowed since mid June, but it is still an uptrend and still bullish.
The next chart shows the Retail SPDR (XRT) breaking out of a triangle consolidation in early August and hitting new highs over the last two weeks. XRT is a broad-based ETF and new highs reflect broad strength in retail. Most retail stocks are domestically oriented and this could explain strength in small-caps.
XLK Edges above Flag Line (plus XLC)
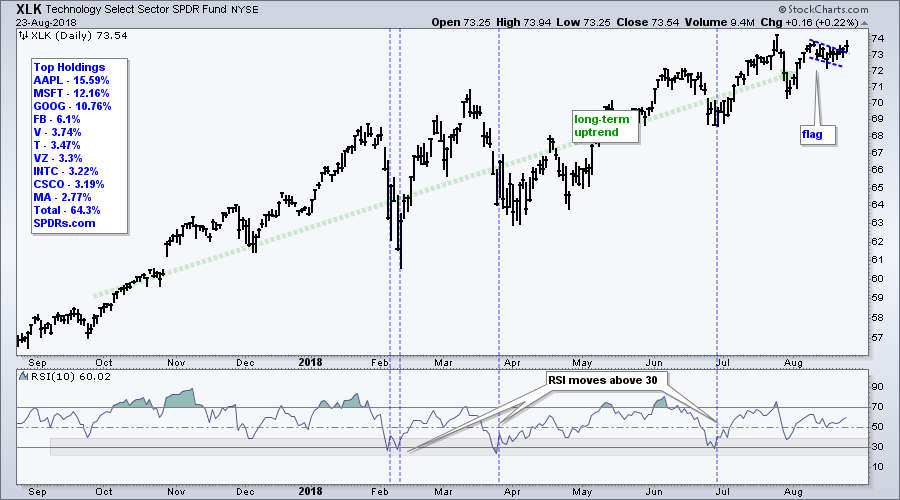
The Technology SPDR (XLK) remains in a long-term uptrend and the short-term pullback reversed with a flag breakout this week. The breakout is looking at little tentative, but price remains above the breakout at 73.
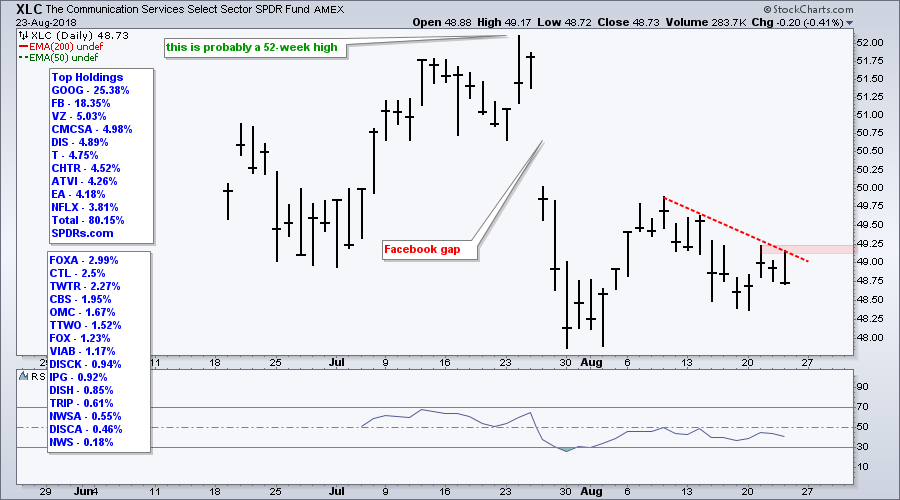
The Communication Services SPDR (XLC) is struggling in August and lagging the broader market. Note that several of these stocks are still part of the Technology SPDR. Chartists looking for clues on XLK may watch XLC for a breakout at 49.25.
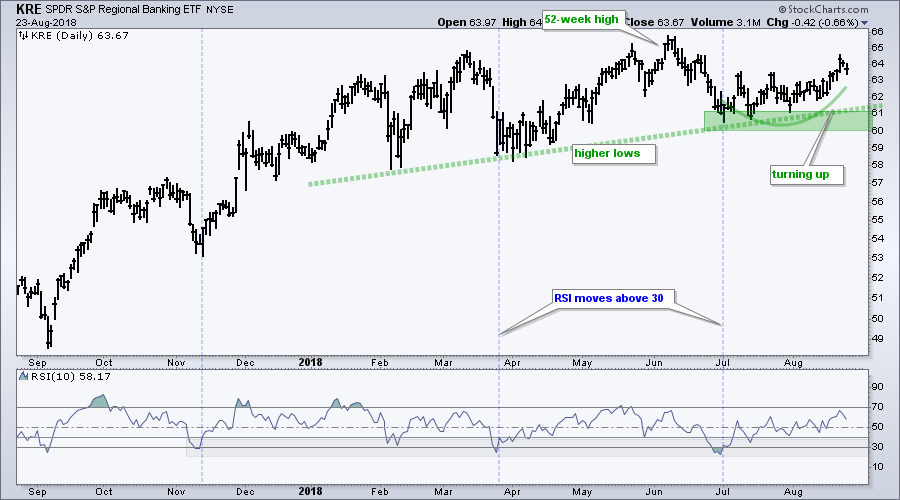
Regional Banks Lead Finance Sector
The Financials SPDR (XLF) is a bit confused over the last few months. The ETF traced out lower lows from February to July, but then surged and forged a higher high in early August. Trading has been quite choppy this year and I am focused on the upswing since early July. XLF established support at 27.5 with two bounces in August and this is the first level to watch for a reversal.
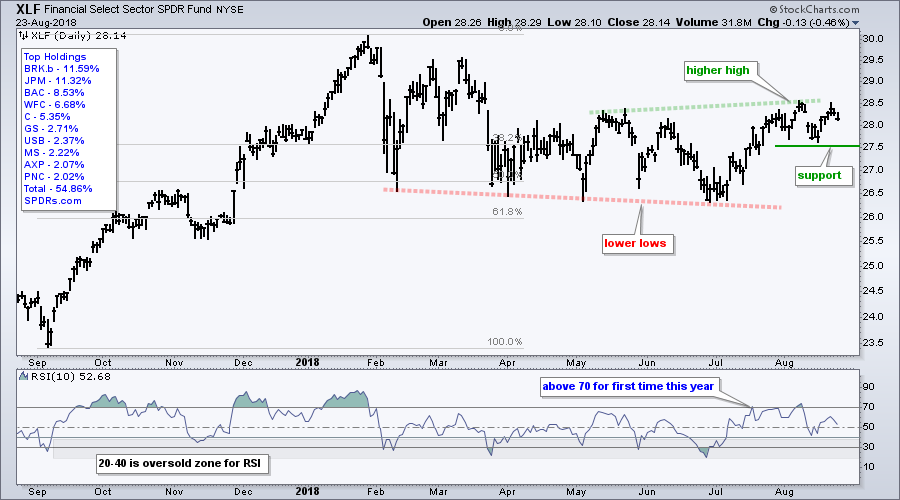
Within the finance sector, the Broker-Dealer iShares (IAI) continues to struggle and looks poised to break support from the March-July lows. The Regional Bank SPDR (KRE) looks much better as it held above its spring lows and turned up in August. Note that IAI is down .87% in August and KRE is up 3.51%. I featured potential bullish setups in ETFC and SCHW in On Trend on Tuesday, but will now stay away from these two.
XLI Extends Upswing (plus ITA)
The Industrials SPDR (XLI) has also struggled this year, but the trend since May is up and this is net positive for the market. Notice that XLI formed higher highs in May and August, as well as a higher low from May to early July. As with XLF, I am watching the upswing that started in early July for clues. A break below 74 would reverse this upswing and call for a reassessment.
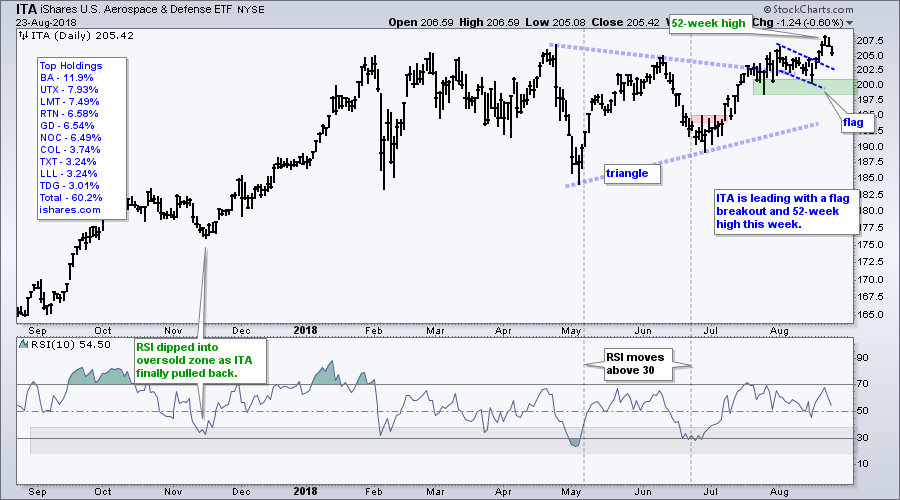
Within the industrials sector, I am seeing leadership from the iShares Aerospace & Defense ETF (ITA), which broke out of a triangle in early August and a falling flag in mid August. The ETF also recorded a 52-week high earlier this week and is leading.
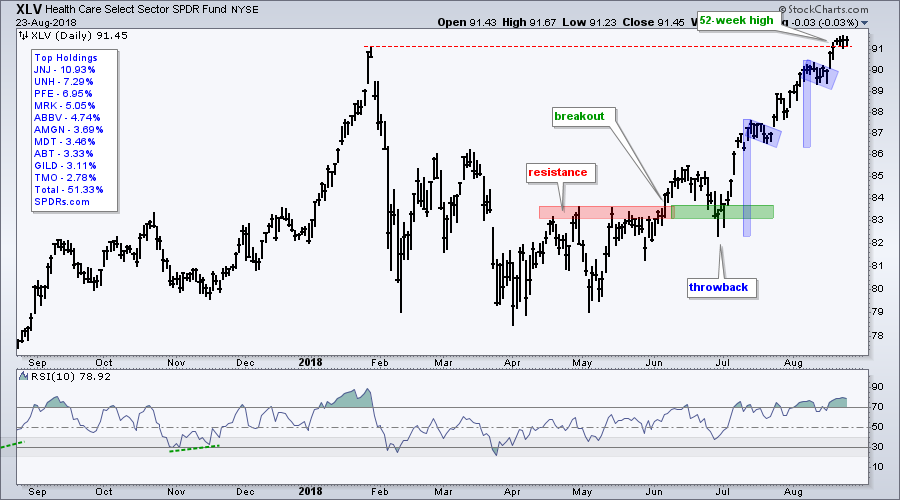
XLV Leads with Fresh New High
The Health Care SPDR (XLV) is the leader among the sector SPDRs because it recorded a 52-week high this week and is the best performing sector over the last three months. Also note that the Medical Devices ETF (IHI) and HealthCare Providers ETF (IHF) hit new highs this week.
Notes from the Art's Charts ChartList
- The Home Construction iShares (ITB) bounced this week with a gap-surge, but it is still in a downtrend overall and still one of the weakest industry group ETFs.
- The Cloud Computing ETF (SKYY) broke out of a bull flag, while the Software iShares (IGV) broke out of a small pennant. The Networking iShares (IGN) and Cyber Security ETF (HACK) are leading the tech-related ETFs with a 6-7% surges this month.
- The Semiconductor iShares (SOXX) forged a 4-candlestick reversal within a large triangle consolidation.
- The Airline ETF (JETS) finally broke out this week and reversed a downtrend that was in place since early April.
- The Biotech iShares (IBB) is trying to break out of a triangle and the Biotech SPDR (XBI) is bouncing off support.
- The Coal ETF (KOL) is forming a bearish head-and-shoulders, of the continuation variety.
- The Agribusiness ETF (MOO) bounced off support to keep its uptrend alive.
- The Oil & Gas Equipnent &Services SPDR (XES) surged to the upper line of a falling wedge.
- The GDX, COPX, XME and SLX broke down in August and these are weighing on the materials sector.
- Click here for the Art's Charts ChartList
Questions, Comments or Feedback?
I cannot promise to response to all correspondence, but I will read it and take into under consideration. I greatly appreciate all feedback because it helps me improve the commentary and provides ideas for the future. Sorry, I do not take symbol requests.

Plan Your Trade and Trade Your Plan.
- Arthur Hill, CMT
Senior Technical Analyst, StockCharts.com
Book: Define the Trend and Trade the Trend
Twitter: Follow @ArthurHill


