- XLF Stalls at Resistance.
- IAI Breaks Triangle Line (plus key stocks).
- Regional Bank SPDR Falters.
- XLP goes from Laggard to Leader (plus key stocks).
- Checkpoint, Biomarin, Cerner and Walgreens.
- Interview with Financial Sense.
 XLF Stalls at Resistance
The Financials SPDR (XLF) led the market higher from late June to early August with an 8% advance, but the ETF has been struggling to hold above its spring highs since early August. The chart shows XLF with the red zone marking resistance. XLF appeared to breakout with a surge in late August, but fell right back over the last two weeks. The fall back could be a falling flag of sorts and a breakout at 28.5 would be bullish.
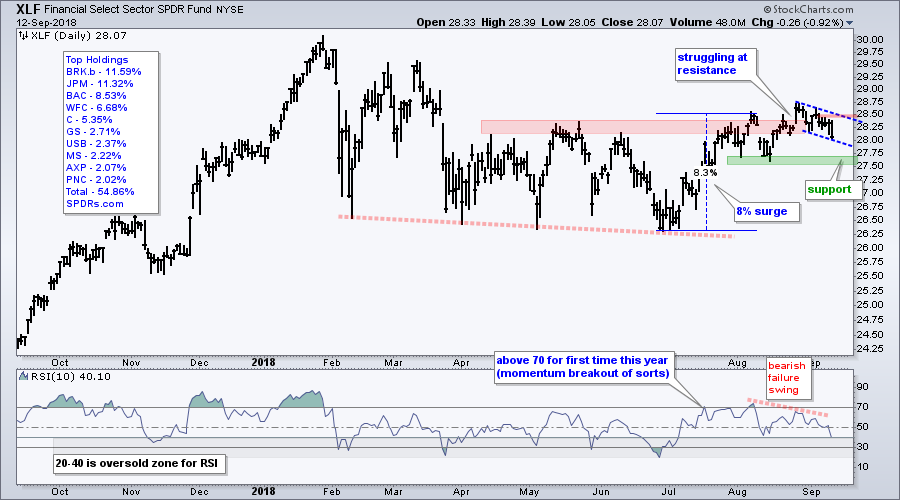
I still think the cup is half full for XLF, but I am watching support at 27.50 closely. A break below this level would reverse the upswing that began in late June and put XLF back in bear mode. The indicator window shows RSI with a move above 70, a bounce that failed below 70 and a move below the mid August low. According to Wells Wilder, creator of RSI, this is a bearish failure swing.
IAI Breaks Triangle Line
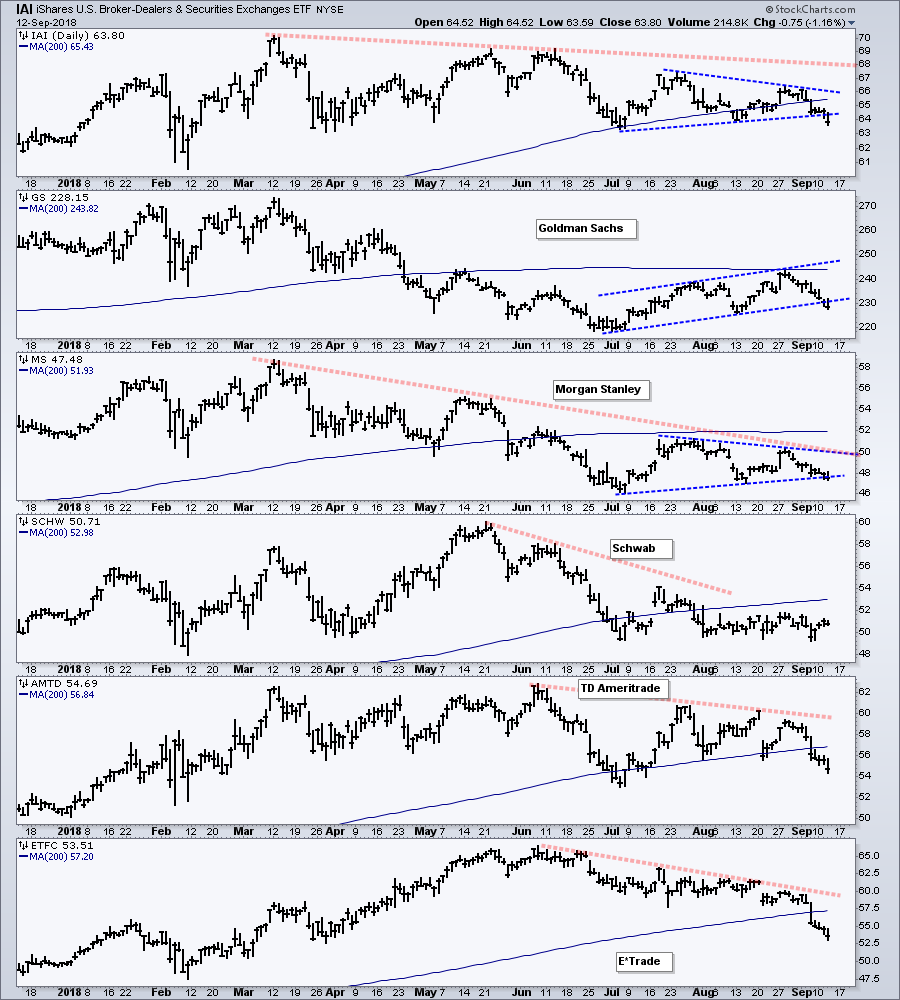
The Broker-Dealer iShares (IAI) and its key stocks are weighing on the finance sector. Notice that IAI, Goldman Sachs (GS), Morgan Stanley (MS), Charles Schwab (SCHW). TD Ameritrade (TDAM) and ETrade (ETFC) are all below their 200-day SMAs. IAI has been trending lower all year and recently broke a triangle line. GS bounced into late August and then turned down in September with a channel line break. MS has been trending lower since March and is poised to break a triangle line.
Regional Bank SPDR Falters
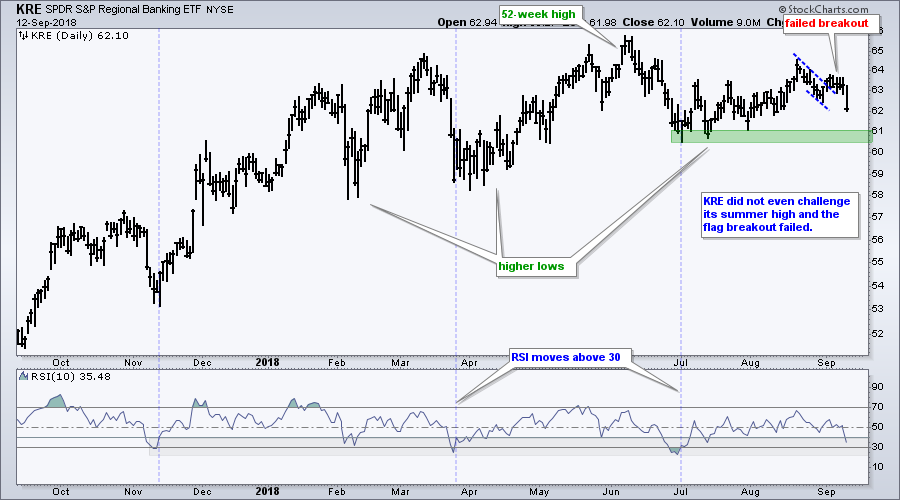
The Regional Bank SPDR (KRE) fell sharply on Wednesday and its flag breakout failed to hold. Overall, KRE has been lagging since July because it did not challenge its June high, whereas SPY recorded a new high. The oversold bounce in early July never got going and the flag breakout in early September failed to hold. Bottom Line: there are stronger charts out there.
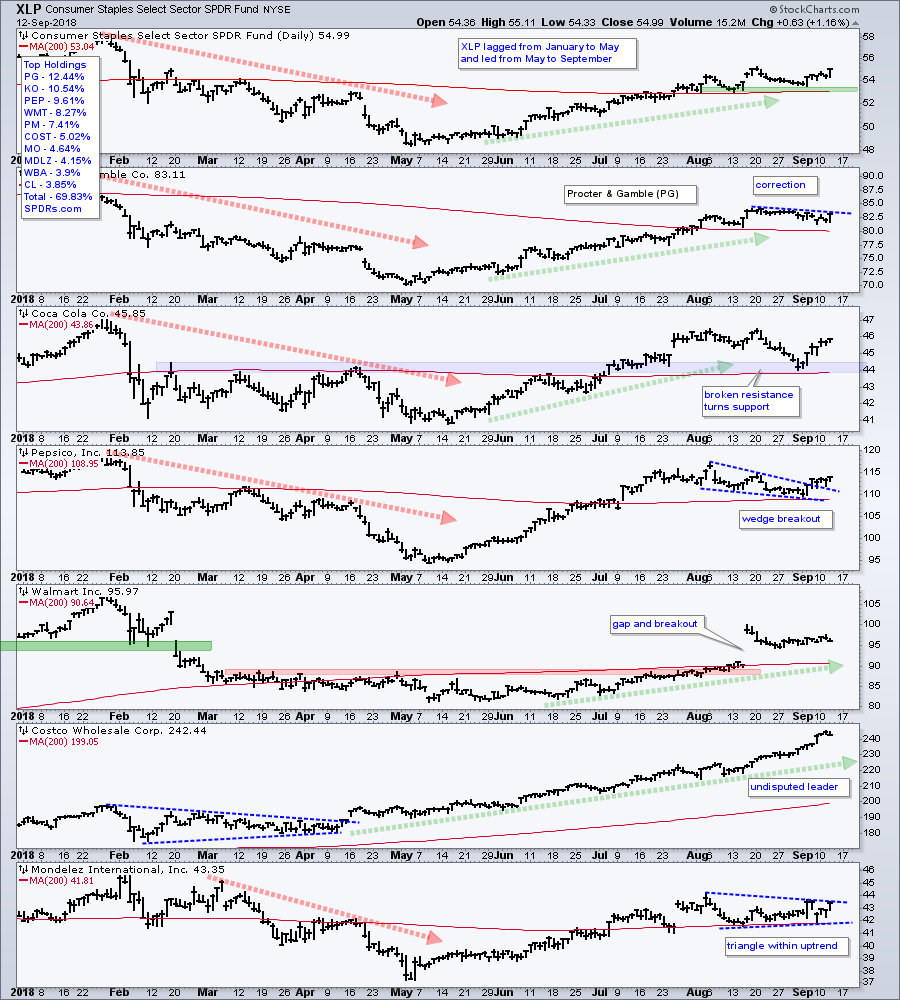
XLP goes from Laggard to Leader
The Consumer Staples SPDR (XLP) fell from January to early May and then rose from early May to early September. Overall, the ETF is up over 13% since early May, but still down around 2% year-to-date. Recent price action counts more and XLP is holding above its 200-day SMA. The chart also shows six leading stocks in the sector and all six are above their 200-day SMAs.
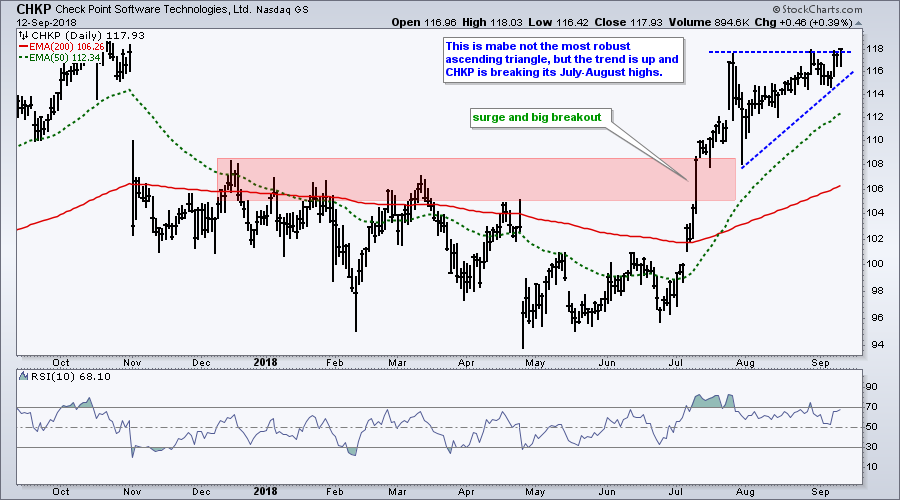
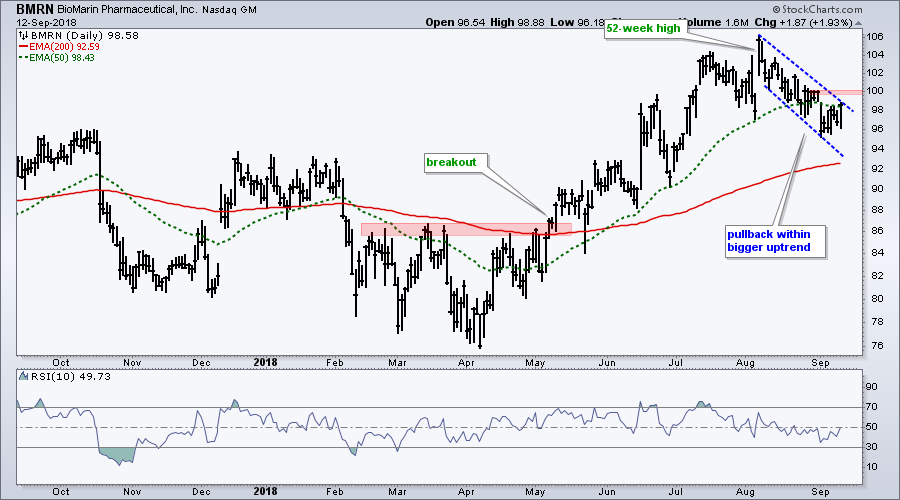
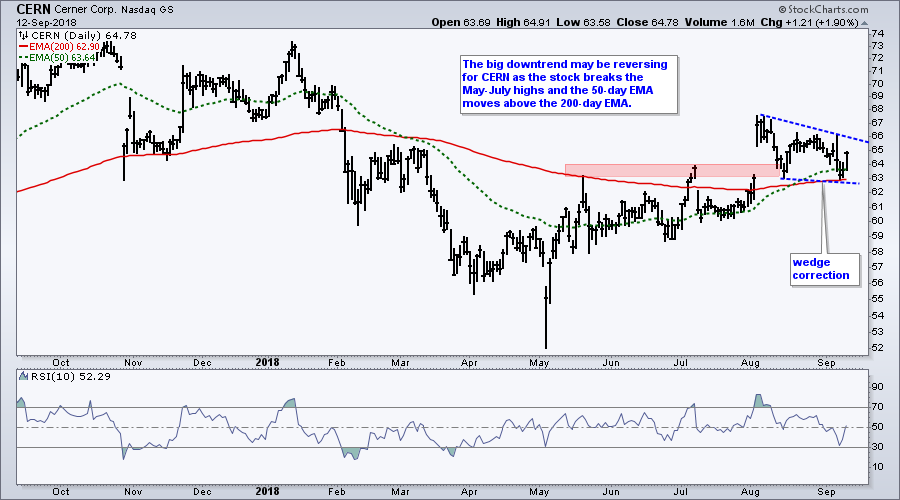
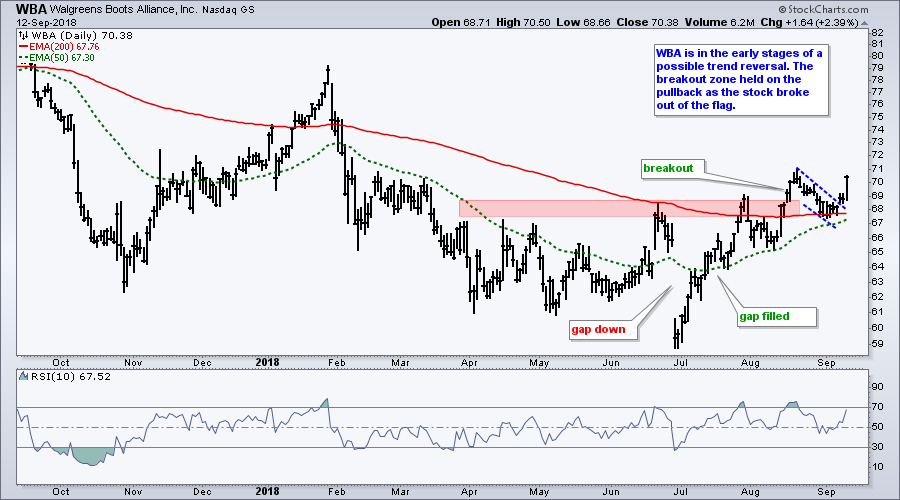
Checkpoint, BioMarin, Cerner and Walgreens
Interview with Financial Sense
I have an interview with Jim Puplava of Financial Sense today and this will be on their site this weekend. I put together some talking points and thought I would share them.
Broad market uptrend:
- Still a bull market in stocks (since May breakout in SPX).
- Grinding higher is still an uptrend, just slower.
- New highs in SML, MID, SPX and NDX recently.
Breadth good enough:
- AD Lines hit new highs in late August (SPX, MID, SML and NDX)
- New highs outpacing new lows.
- Over 60% of stocks are above their 200-day EMAs.
Risk On:
- Stocks still outperforming bonds (SPY:IEF ratio).
- Junk bonds still outperforming Treasuries (JNK:IEF ratio)
- 2-year yield at multi-year highs (fed tightening, inflation or both)
- TLT is in long-term downtrend and turned down again the last few weeks
- DAX, SSEC and EEM not a problem (until they are!)
Miscellaneous
- QQQ and IJR are still leaders year-to-date
- XLK, XLY and XLV hit new highs recently (53.7% of SPX)
- XLI is starting to lead with six month high.
- ITA and IYT are leading with new highs (defense and rails)
- XLF remains stuck near resistance, but has yet to break down.
- IAI has been weak all year (GS, MS, SCHW, TDAM, ETFC weak)
- KRE turned down this week.
- IGV and HACK are the strongest tech-related ETFs
- XLP continues to perform well (PG, PEP, MDLX)
Questions, Comments or Feedback?
I cannot promise to response to all correspondence, but I will read it and take into under consideration. I greatly appreciate all feedback because it helps me improve the commentary and provides ideas for the future. Sorry, I do not take symbol requests.

Plan Your Trade and Trade Your Plan.
- Arthur Hill, CMT
Senior Technical Analyst, StockCharts.com
Book: Define the Trend and Trade the Trend
Twitter: Follow @ArthurHill


