- Market Overview - New Highs Are?
- Breadth Remains Strong Enough.
- Large-caps Lead New High List.
- SPX Turns Up after Mild Pullback.
- Small-caps Lag on Upturn.
- QQQ Bounces from Oversold Level.
- XLY and XLV hit new highs as XLK turns Up.
- XLI Continues to Lead as XLF Lags.
- Bond Correlations Break Down.
- Utes, REITs and Staples Remain Strong.
- Notes from the Art's Charts ChartList.
 ...Market Overview - Broad Strength
...There are pockets of weakness in parts of the world and parts of the US stock market, but the bulk of the evidence remains bullish for the major stock indexes in the US. In addition, there are also some world indexes showing strength. Thus, it is not all bleak out there.
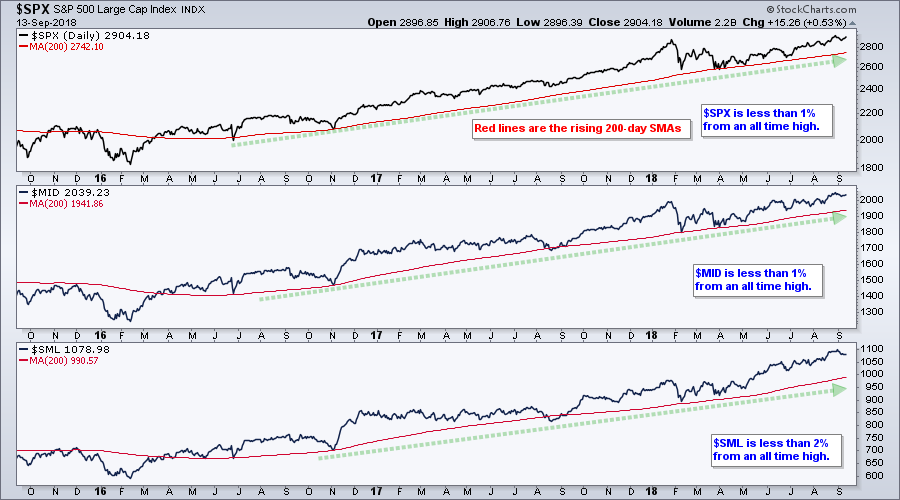
The S&P 500, S&P Mid-Cap 400, S&P Small-Cap 600 and Nasdaq 100 all recorded new highs in late August. The indexes pulled back in September, but the S&P 500 and S&P Mid-Cap 400 are within 1% of their highs and the S&P Small-Cap 600 is within 2% of its high. As a trend follower, I find it pretty much impossible to be bearish of the major indexes right now. Sure, we could see a pullback or correction, but I do not see a major topping pattern or underlying weakness in the breadth indicators.
Breadth Remains Strong Enough
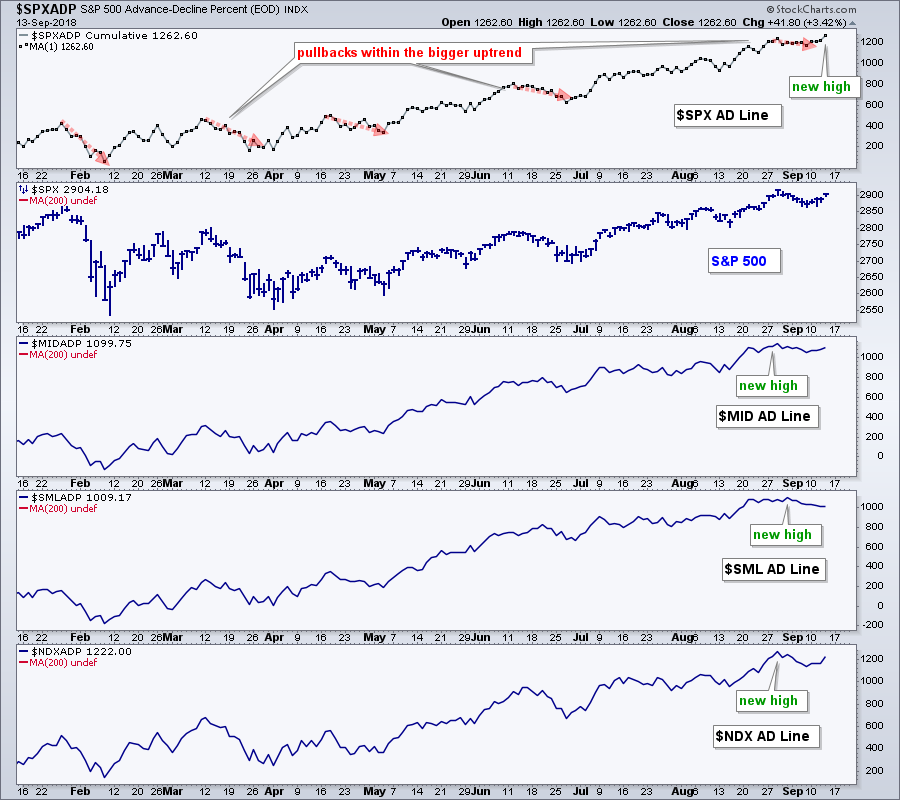
I realize some breadth indicators are not as strong as they were in late January, but I see more bullish breadth than bearish breadth and I do not see any warning signs. The S&P 500 AD Line hit a new high this week and this shows broad strength in the index. The AD Line for the S&P Mid-Cap 400, S&P Small-Cap 600 and Nasdaq 100 hit new highs in late August and then pulled back, but they are in long-term uptrend. I do not see any glaring divergences or signs of internal weakness.
Also consider that over 60% of stocks are above their 200-day EMAs (chart here). The numbers are as follows: $SPX 72.4%, $MID 63.75%, $SML 66.67%. Large-caps are leading and mid-caps are lagging in this category. Note that all four have been above 50% since early April and above 60% since early July. This indicator is not problematic until we see dips below the 50% level.
Large-caps Lead New High List
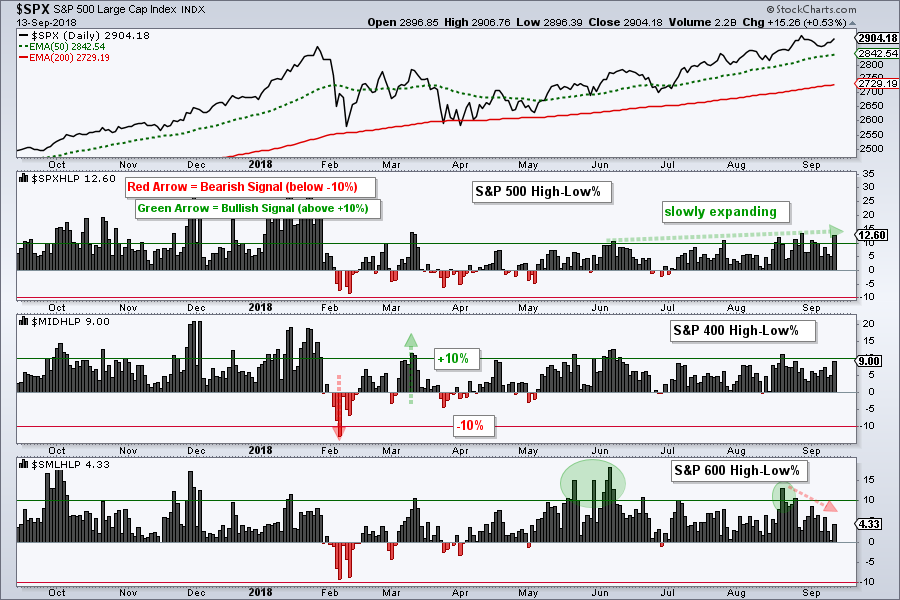
New highs on the S&P 500 moved above 10% for the seventh time since mid August. Even though S&P 400 High-Low% ($MIDHLP) has not been above 10% since August 21st and S&P 600 High-Low% ($SMLHLP) deteriorated the last few weeks, they are still positive and this means new highs are outpacing new lows. At the very least, new high leadership in the S&P 500 tells us to focus on large-caps right now. With the S&P 500, tech, healthcare, industrials and materials are leading the new high list (chart here).
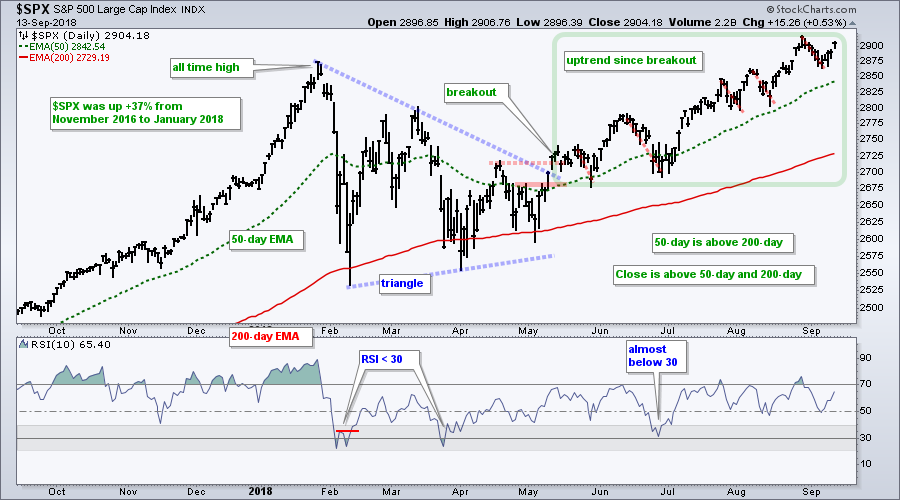
SPX Turns Up after Mild Pullback
The S&P 500 hit a new high above 2900 in late August, dipped below 2875 in early September and turned up over the last four days. As the red dashed lines show, this was the fifth pullback since the May breakout. The rally since July has been quite strong because RSI has not been below 45 since July 3rd.
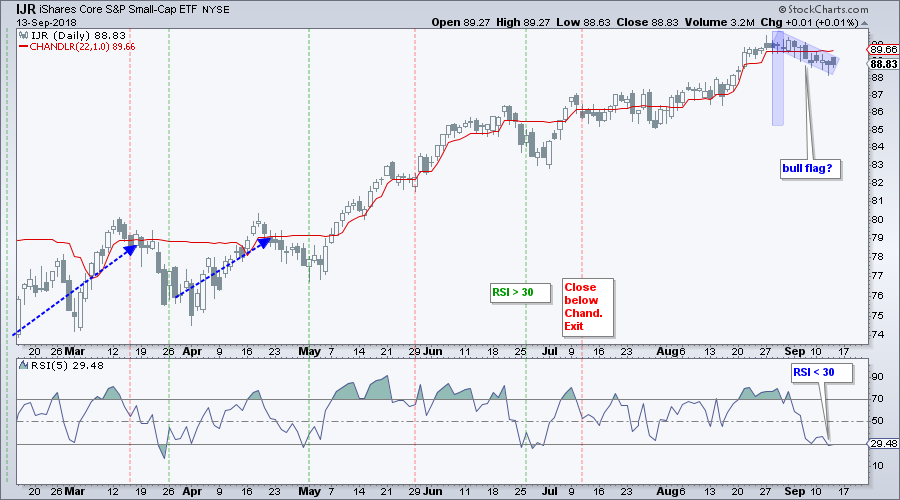
Small-caps Lag on Upturn
The S&P SmallCap iShares (IJR) is lagging this week because it did not turn up. We can blame weakness in six of the nine small-cap sectors. I am not going to read too much into small-cap weakness right now because the bigger trend is up. The pullback over the last two weeks looks like a falling flag of sorts and a breakout would be bullish. Also notice that RSI moved below 30 for the first time since late June. Thus, IJR is also short-term oversold and a mean-reversion setup is brewing.
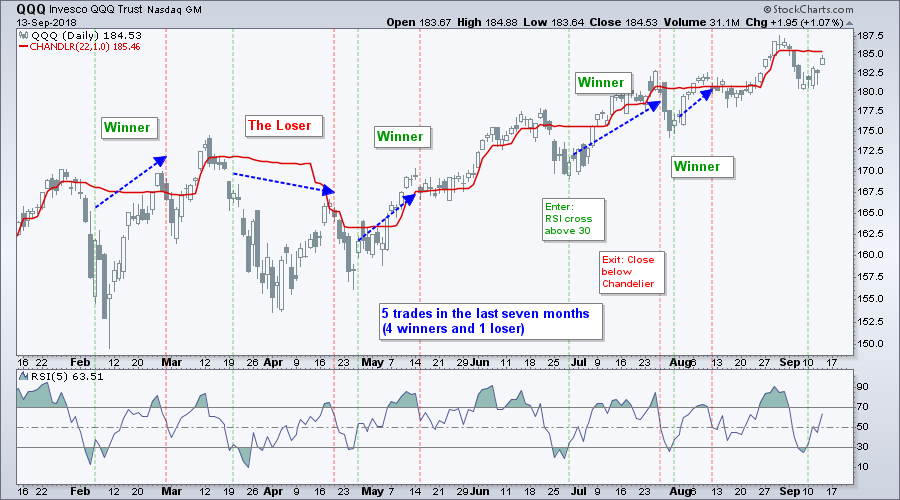
QQQ Bounces from Oversold Level
QQQ was the first to become oversold as it led the decline in late August. RSI moved back above 30 on Monday and QQQ is leading the bounce over the last four trading days. The green lines show prior moves above 30 and the red lines show when the QQQ closed below the Chandelier Exit (22,1). QQQ is currently below the Chandelier Exit and needs to move above for a sell setup to become active.
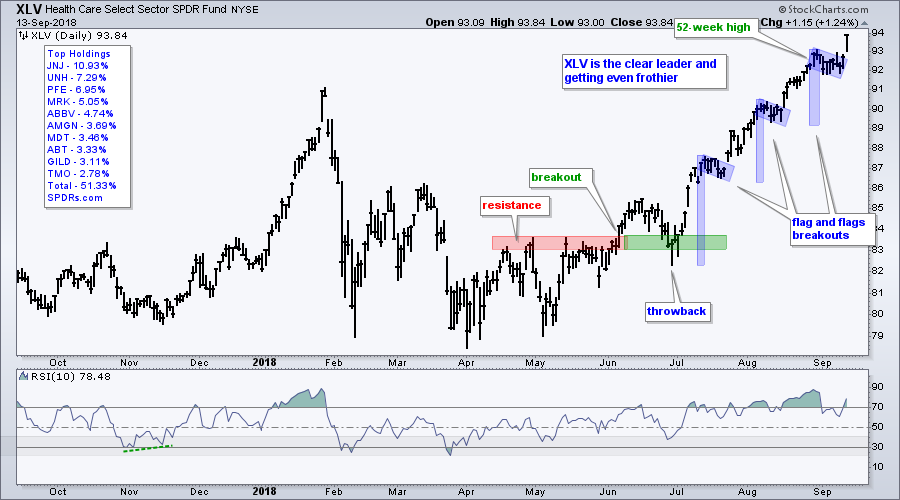
XLY and XLV hit new highs as XLK turns Up
So we have the Technology SPDR (XLK) turning up this week and the Consumer Discretionary SPDR (XLY) hitting a new high. The Health Care SPDR (XLV) is the king pin because it surged to a new high with a big move on Thursday. This marks the third flag and flag breakout since July and extends the uptrend. While I still think XLV is looking extended and ripe for a rest, it is the strongest of the ten sectors right now and the new high is bullish.
XLI Continues to Lead as XLF Lags
I discussed the Financials SPDR (XLF) on Thursday and pointed to weakness in the Broker-Dealer iShares (IAI) and Regional Bank SPDR (KRE). JPM held up on Thursday and still has a bullish wedge forming, but many of the other bank charts are not looking so good. Instead of rehashing XLF, I am going to focus on XLI because it extended its gains this week and continues to show upside leadership. XLI is not at its highest level since early February and I expect a challenge to the January high.
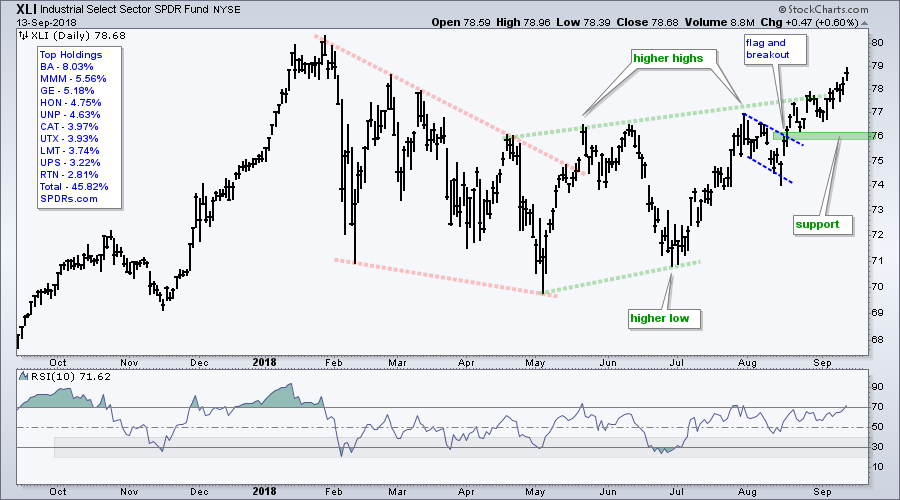
XLV, XLY, XLK and XLI account for around 64% of the S&P 500 and these four sectors are doing just fine. Throw in XLU, XLRE and XLP, which are also performing well, and some 75% of the market is in good shape. It is hard to be bearish when the majority of sector weightings are bullish.
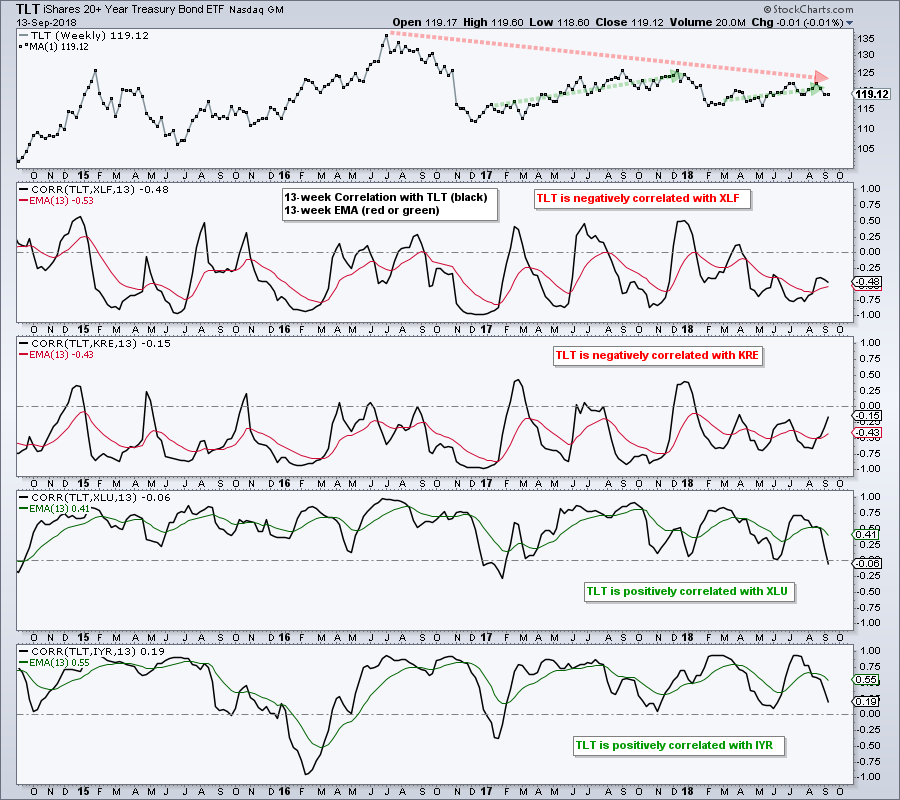
Bond Correlations Break Down
The Utilities SPDR (XLU) and the Real Estate SPDR (XLRE) are usually positively correlated with the 20+ YR T-Bond ETF (TLT). This means they tend to rise when bonds rise. Conversely, the Financials SPDR (XLF) and Regional Bank SPDR (KRE) are negatively correlated to TLT and tend to move in the opposite direction.
These correlations were turned on their heads over the last three weeks. TLT, XLF and KRE fell, while XLU, XLRE and XLP rose.
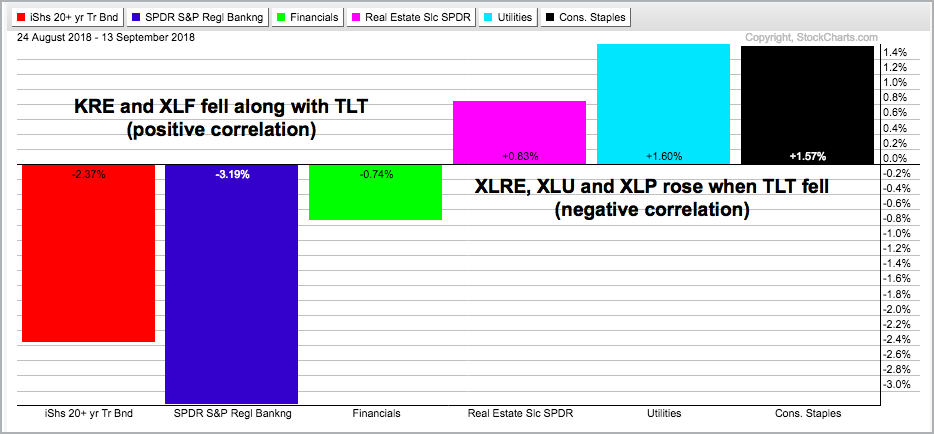
The usual correlations are not working the last three weeks. I am not sure what is going on here, but the inability of XLF and KRE to bounce when TLT falls is negative. Similar, the ability of XLU, XLRE and XLP to hold up when bonds fall is a positive, at least three the former three.
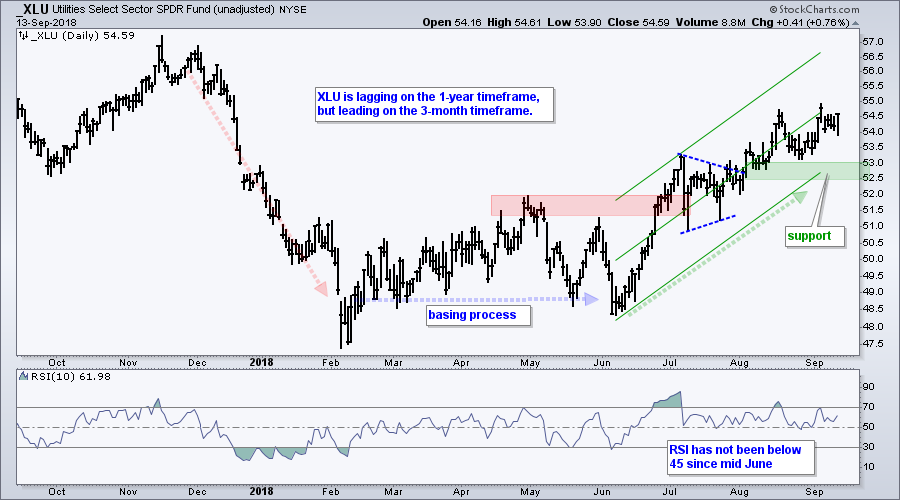
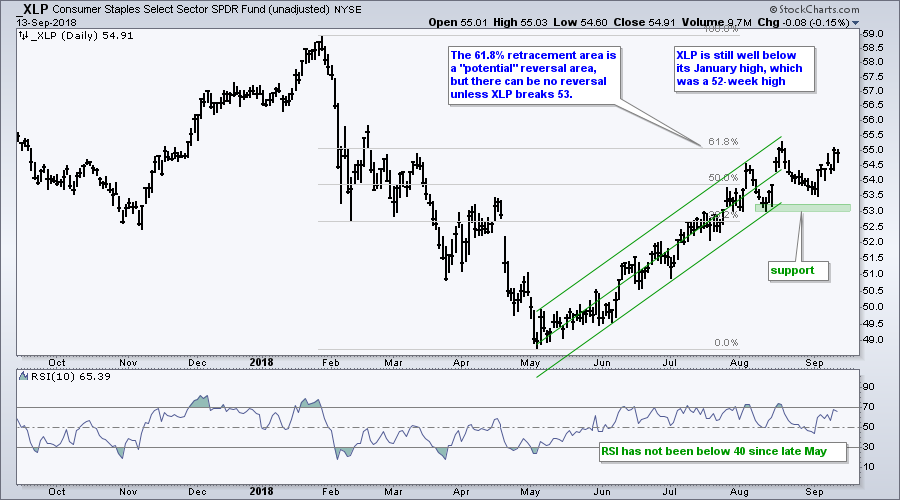
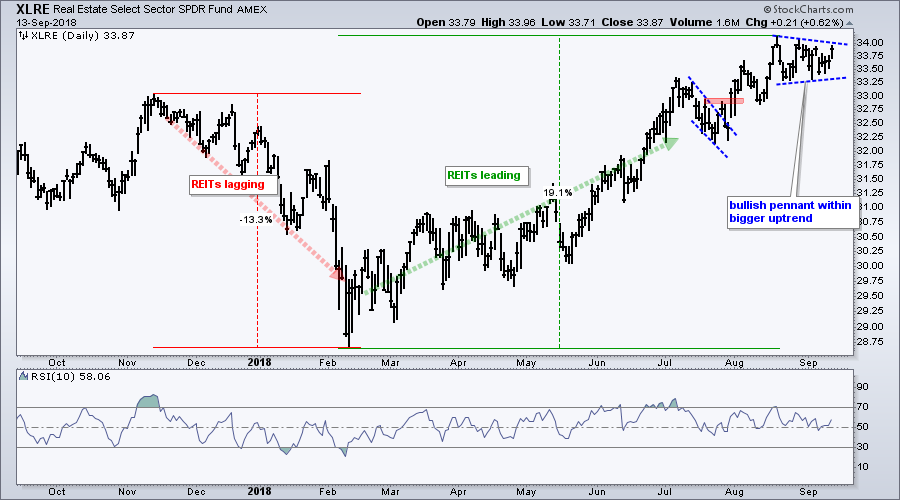
Utes, REITs and Staples Remain Strong
The next three charts shows XLU, XLRE and XLP in uptrends and the key support levels to watch going forward. I do not think it is negative to see these three defensive sectors leading. They are part of the stock market and they are contributing to the broad market gains. A true negative occurs when the big offensive sectors start to weaken and we have yet to see this happen.
Notes from the Art's Charts ChartList
- Chart Leaders: SKYY, HACK, IGV, IGN, REM, KIE, IYT, ITA, IHI, IHF
- Chart Laggards: ITB, IAI, XES, KOL, XME, SLX, COPX, GDX
- Chart Limbo: FDN, SOXX,
- Poised for a Bounce?: IBB, XBI, XSD
- The Home Construction iShares (ITB) continues to lag and is tracing out a bearish descending triangle.
- The Cyber Security ETF (HACK) broke out in late August and stalled with a potential bull flag the last two weeks.
- The Networking iShares (IGN) surged, broke out and then fall back to the breakout zone, which could offer support.
- The Semiconductor iShares (SOXX) is in a big contracting trading range since March, but the Semiconductor SPDR (XSD) hit a new high in late August and remains in a long-term uptrend.
- The Software iShares (IGV) hit a new high this week and is the clear leader in the technology sector.
- The Broker-Dealer iShares (IAI) is one of the weakest groups in 2018 and the Regional Bank SPDR (KRE) fell sharply the last two days (see blog post).
- The Insurance SPDR (KIE) is holding above its breakout zone.
- The REIT iShares (IYR) hit a 52-week high in late August and then formed a bullish pennant the last few weeks.
- The Transport iShares (IYT) is leading the market with a fresh 52-week high this week.
- The Biotech iShares (IBB) and Biotech SPDR (XBI) fell back in September, but the bigger trends are up and both firmed this week.
- Click here for the Art's Charts ChartList
Questions, Comments or Feedback?
I cannot promise to response to all correspondence, but I will read it and take into under consideration. I greatly appreciate all feedback because it helps me improve the commentary and provides ideas for the future. Sorry, I do not take symbol requests.

Plan Your Trade and Trade Your Plan.
- Arthur Hill, CMT
Senior Technical Analyst, StockCharts.com
Book: Define the Trend and Trade the Trend
Twitter: Follow @ArthurHill


