- Small-cap Materials Take the Lead.
- An Abandoned Hammer in SOXX.
- FireEye, the Big Base and Volume.
- Arista Hits Support and Oversold Zone.
... Small-cap Materials Take the Lead
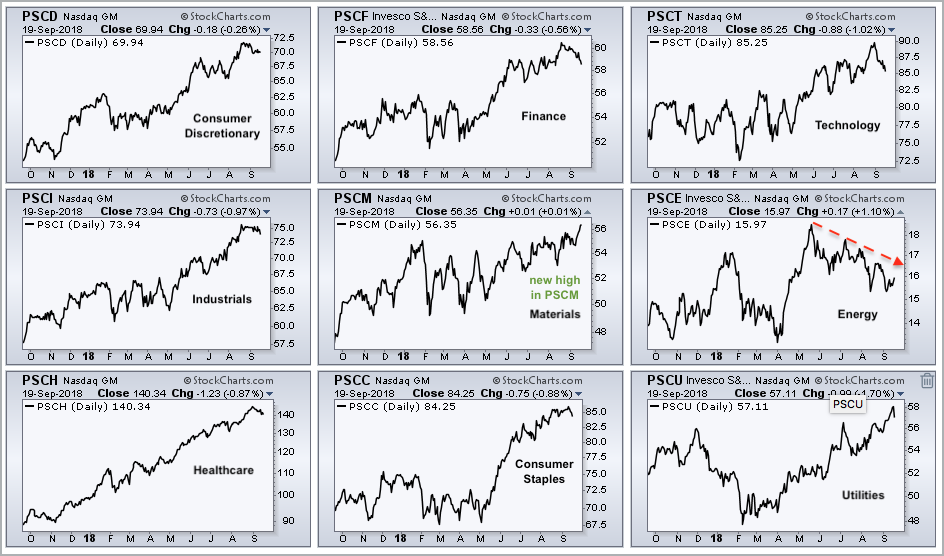
... There are nine small-caps sectors and the SmallCap Materials ETF (PSCM) is taking the lead. First, it is the only one of the nine small-cap sectors to hit a new high on Wednesday. Second, it is up over six percent the past month and leading. Third, the SmallCap Materials ETF and SmallCap Energy ETF (PSCE) are the only two small-cap sectors showing gains the last five trading days.
I realize that PSCM and the other small-cap sector ETFs have low volume and are not suited for trading, but there is still valuable information in these prices. Namely, small-cap materials stocks are showing upside leadership.
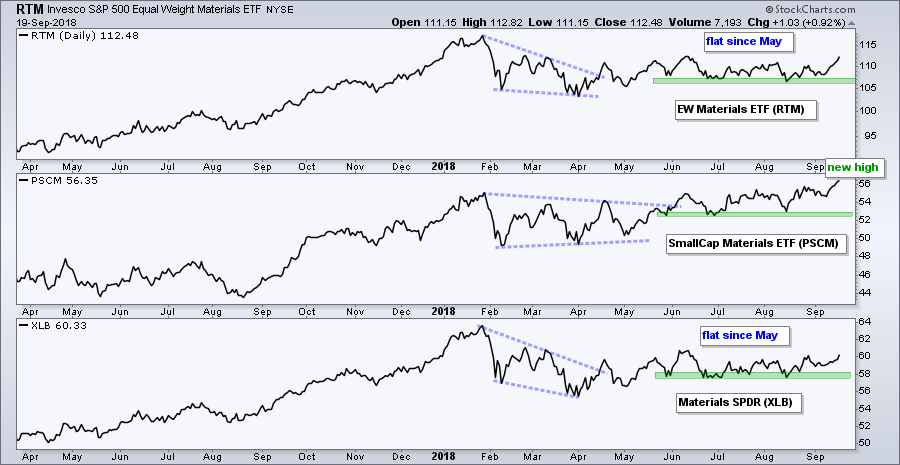
The chart below shows all three versions of the materials sector. The top window shows the Equal-Weight Materials ETF (RTM) surging 4% the last five trading days and moving above 110. Overall, RTM has traded sideways since May, but this surge off support shows renewed interest in the sector. The middle window shows the SmallCap Materials ETF hitting a new high, while the bottom window shows the Materials SPDR (XLB) in a trading range since May.
 Here are the symbol groups with links for CandleGlance charts:
- Sector SPDRs: XLY,XLF,XLK,XLI,XLB,XLE,XLV,XLP,XLU,XLRE,XLC
- EW Sectors: RCD,RYF,RYT,RGI,RYH,RHS,RYU,RTM,RYE
- Small-cap Sectors: PSCD,PSCF,PSCT,PSCI,PSCM,PSCE,PSCH,PSCC,PSCU
An Abandoned Hammer in SOXX
There is a candlestick pattern called the abandoned baby where you have a gap down, a small doji and a gap up. The doji (baby) is abandoned because the gaps created an island reversal of sorts. There is also a morning star, which consists of a long filled candlestick, a gap down with a small candlestick, and then a gap up and long hollow candlestick. Both candlestick patterns are bullish reversals with gaps on either side.
The Semiconductor iShares (SOXX) has some sort of island/candlestick reversal working as the ETF gapped down, formed a hammer and gapped up. These gaps created an abandoned hammer or island reversal that is short-term bullish. A resistance level formed at 193 the last two weeks so watch this level for a short-term breakout. Such a move would also be positive for the tech sector and the Nasdaq. On the downside, the gap zone now marks support and a close below 183 would negate the pattern.
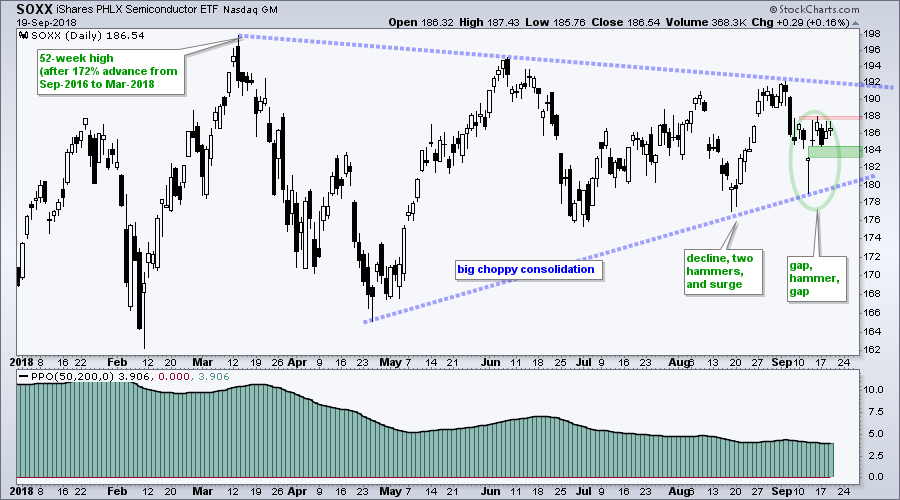
Overall, the long-term trend is up, but the ETF has gone nowhere the last six months. Keep in mind that SOXX was up over 150% from September 2016 to March 2018. A massive triangle formed as the consolidation narrowed into September and now we have an attempt to reverse within the triangle.
FireEye, the Big Base and Volume
The first chart shows FireEye (FEYE) with a big decline into February 2016 and a consolidation since then. This consolidation could be a big base and the lows look something like a rounding bottom. Also notice the breakout with high-volume in May 2017. This breakout zone turned into a support zone that held over the past year. More recently, notice that the stock surged on big volume five weeks ago.
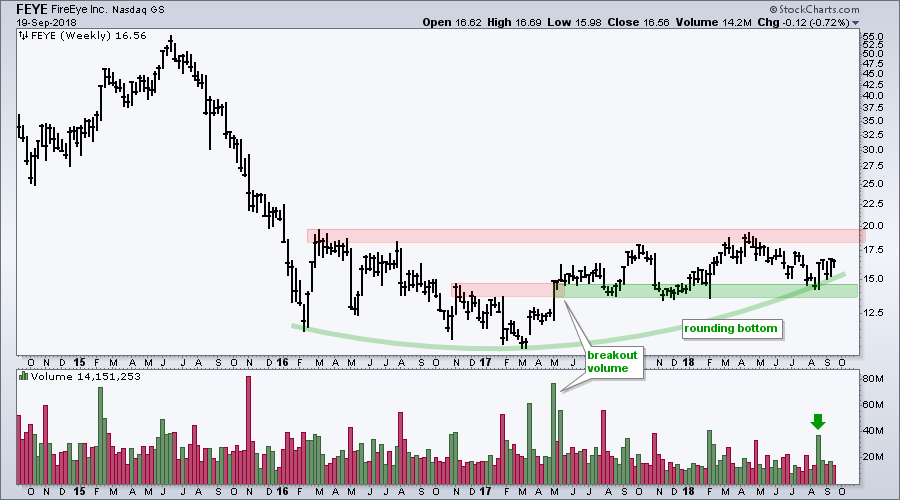
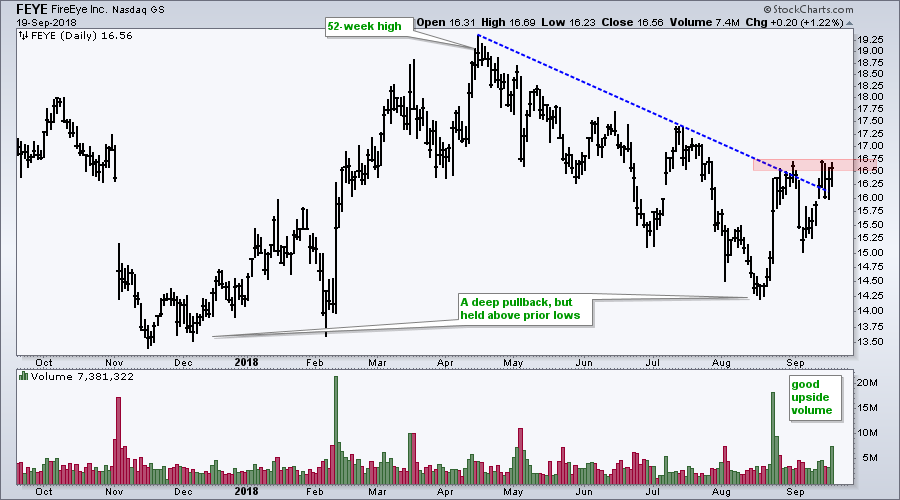
The next chart shows daily bars over the past year for more detail. Three things stand out. First, the stock recorded a 52-week high in April. Second, the subsequent decline, while deep, held above the November-February lows. Third, the August surge came with big volume and upside volume was strong three of the last five days. Buying pressure appears to be increasing and the downtrend from April to August appears to be reversing.
Arista Hits Support and Oversold Zone
Arista Networks (ANET) has gone nowhere since February, but the long-term trend is up and selling pressure has been quite muted. First, the stock hit 52-week highs in February and August, and the 50-day EMA is above the 200-day EMA. Price-wise, a large triangle formed and the stock broke out with a surge in August. ANET fell back into the apex and this area should offer support. Watch for a bounce here.
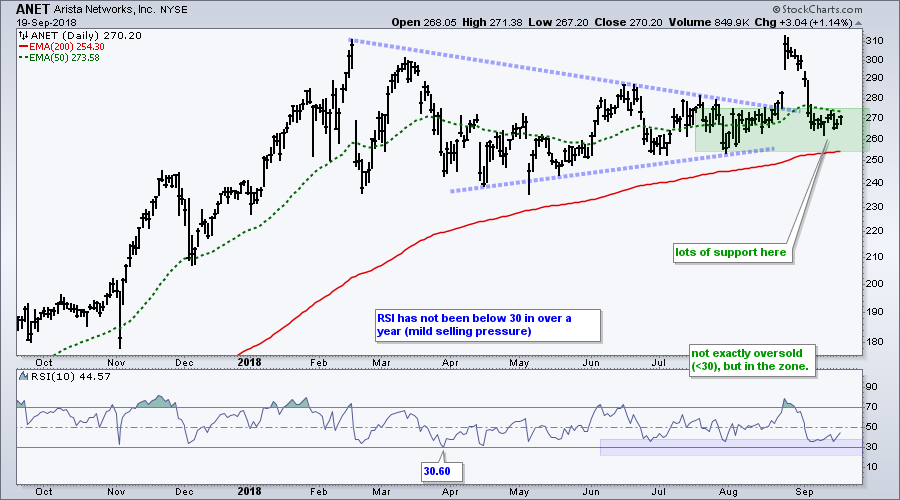
Selling pressure has been muted because 10-day RSI has not been below 30 in over a year. While a move below 30 provides the ideal oversold signal, sometimes selling pressure is muted and we have to relax our conditions by using an oversold zone, such as 20 to 40. RSI dipped below 40 a few times over the last three months and this mild oversold condition could give way to a bounce.
Questions, Comments or Feedback?
I cannot promise to response to all correspondence, but I will read it and take into under consideration. I greatly appreciate all feedback because it helps me improve the commentary and provides ideas for the future. Sorry, I do not take symbol requests.

Plan Your Trade and Trade Your Plan.
- Arthur Hill, CMT
Senior Technical Analyst, StockCharts.com
Book: Define the Trend and Trade the Trend
Twitter: Follow @ArthurHill


